Associate Performance Monitors with the device
The Associate Performance Monitors action in the Discovery Rule Engine lets you automatically assign performance monitors to devices at the time of discovery. This removes the need to manually attach monitors to each device after it is added to OpManager.
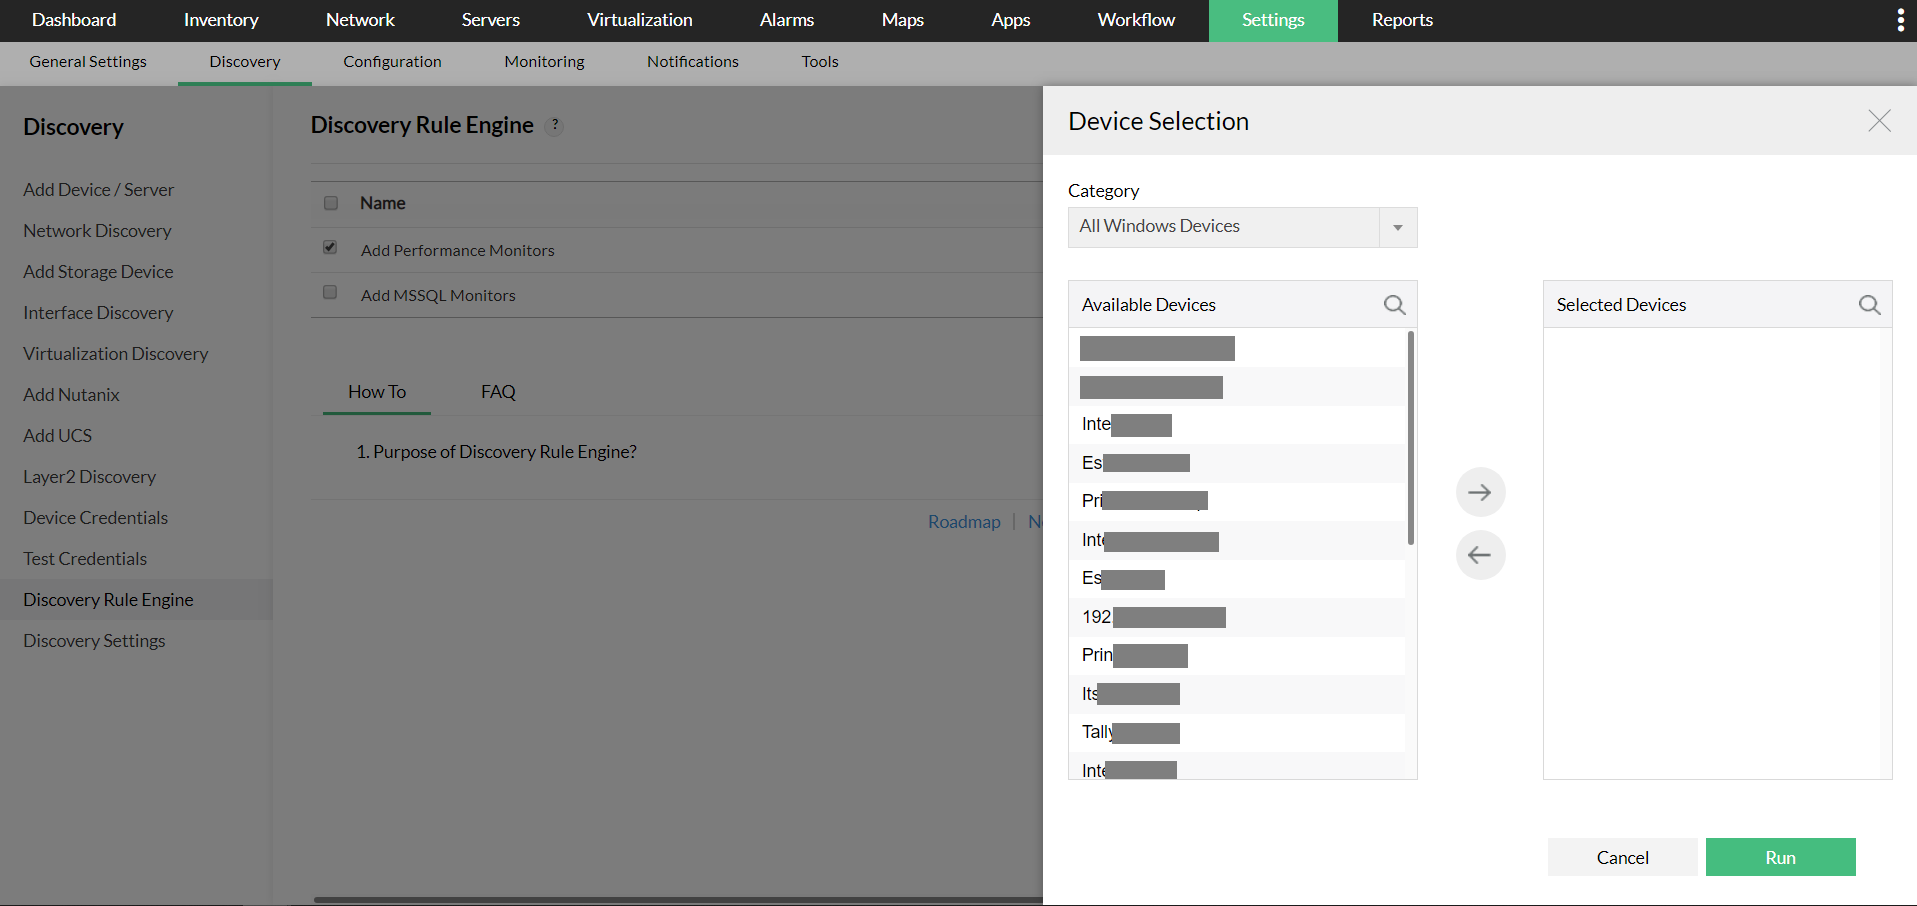
When this action is configured in a rule, OpManager applies the selected performance monitors to every device that matches the rule's criteria at the time of discovery or when the rule is re-run.
Settings → Discovery → Discovery Rule Engine
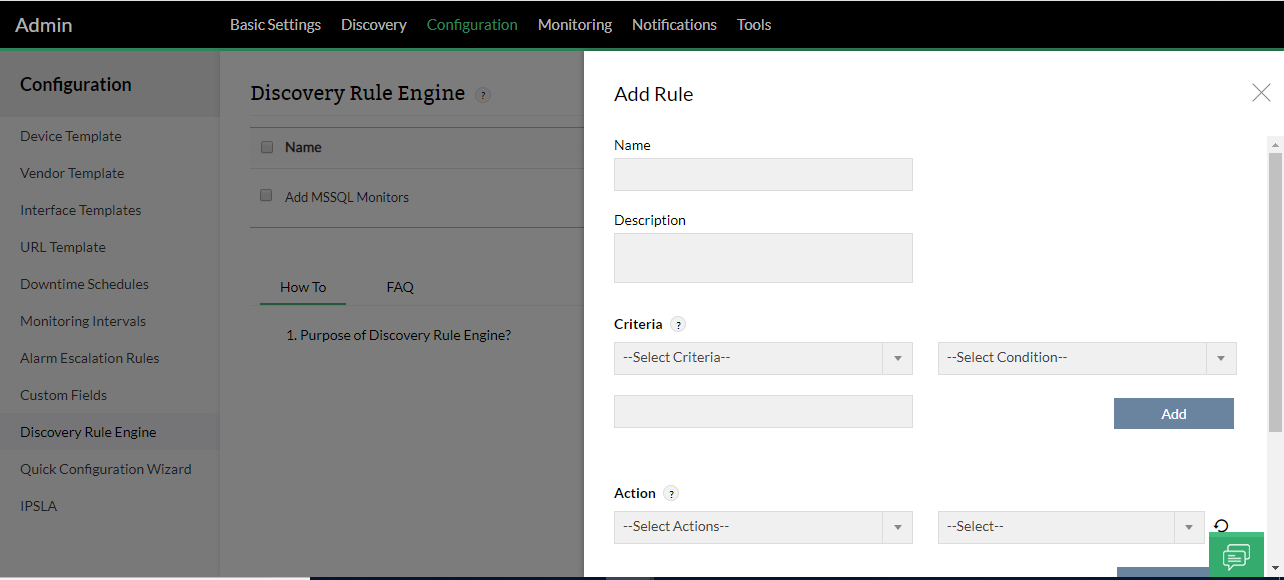
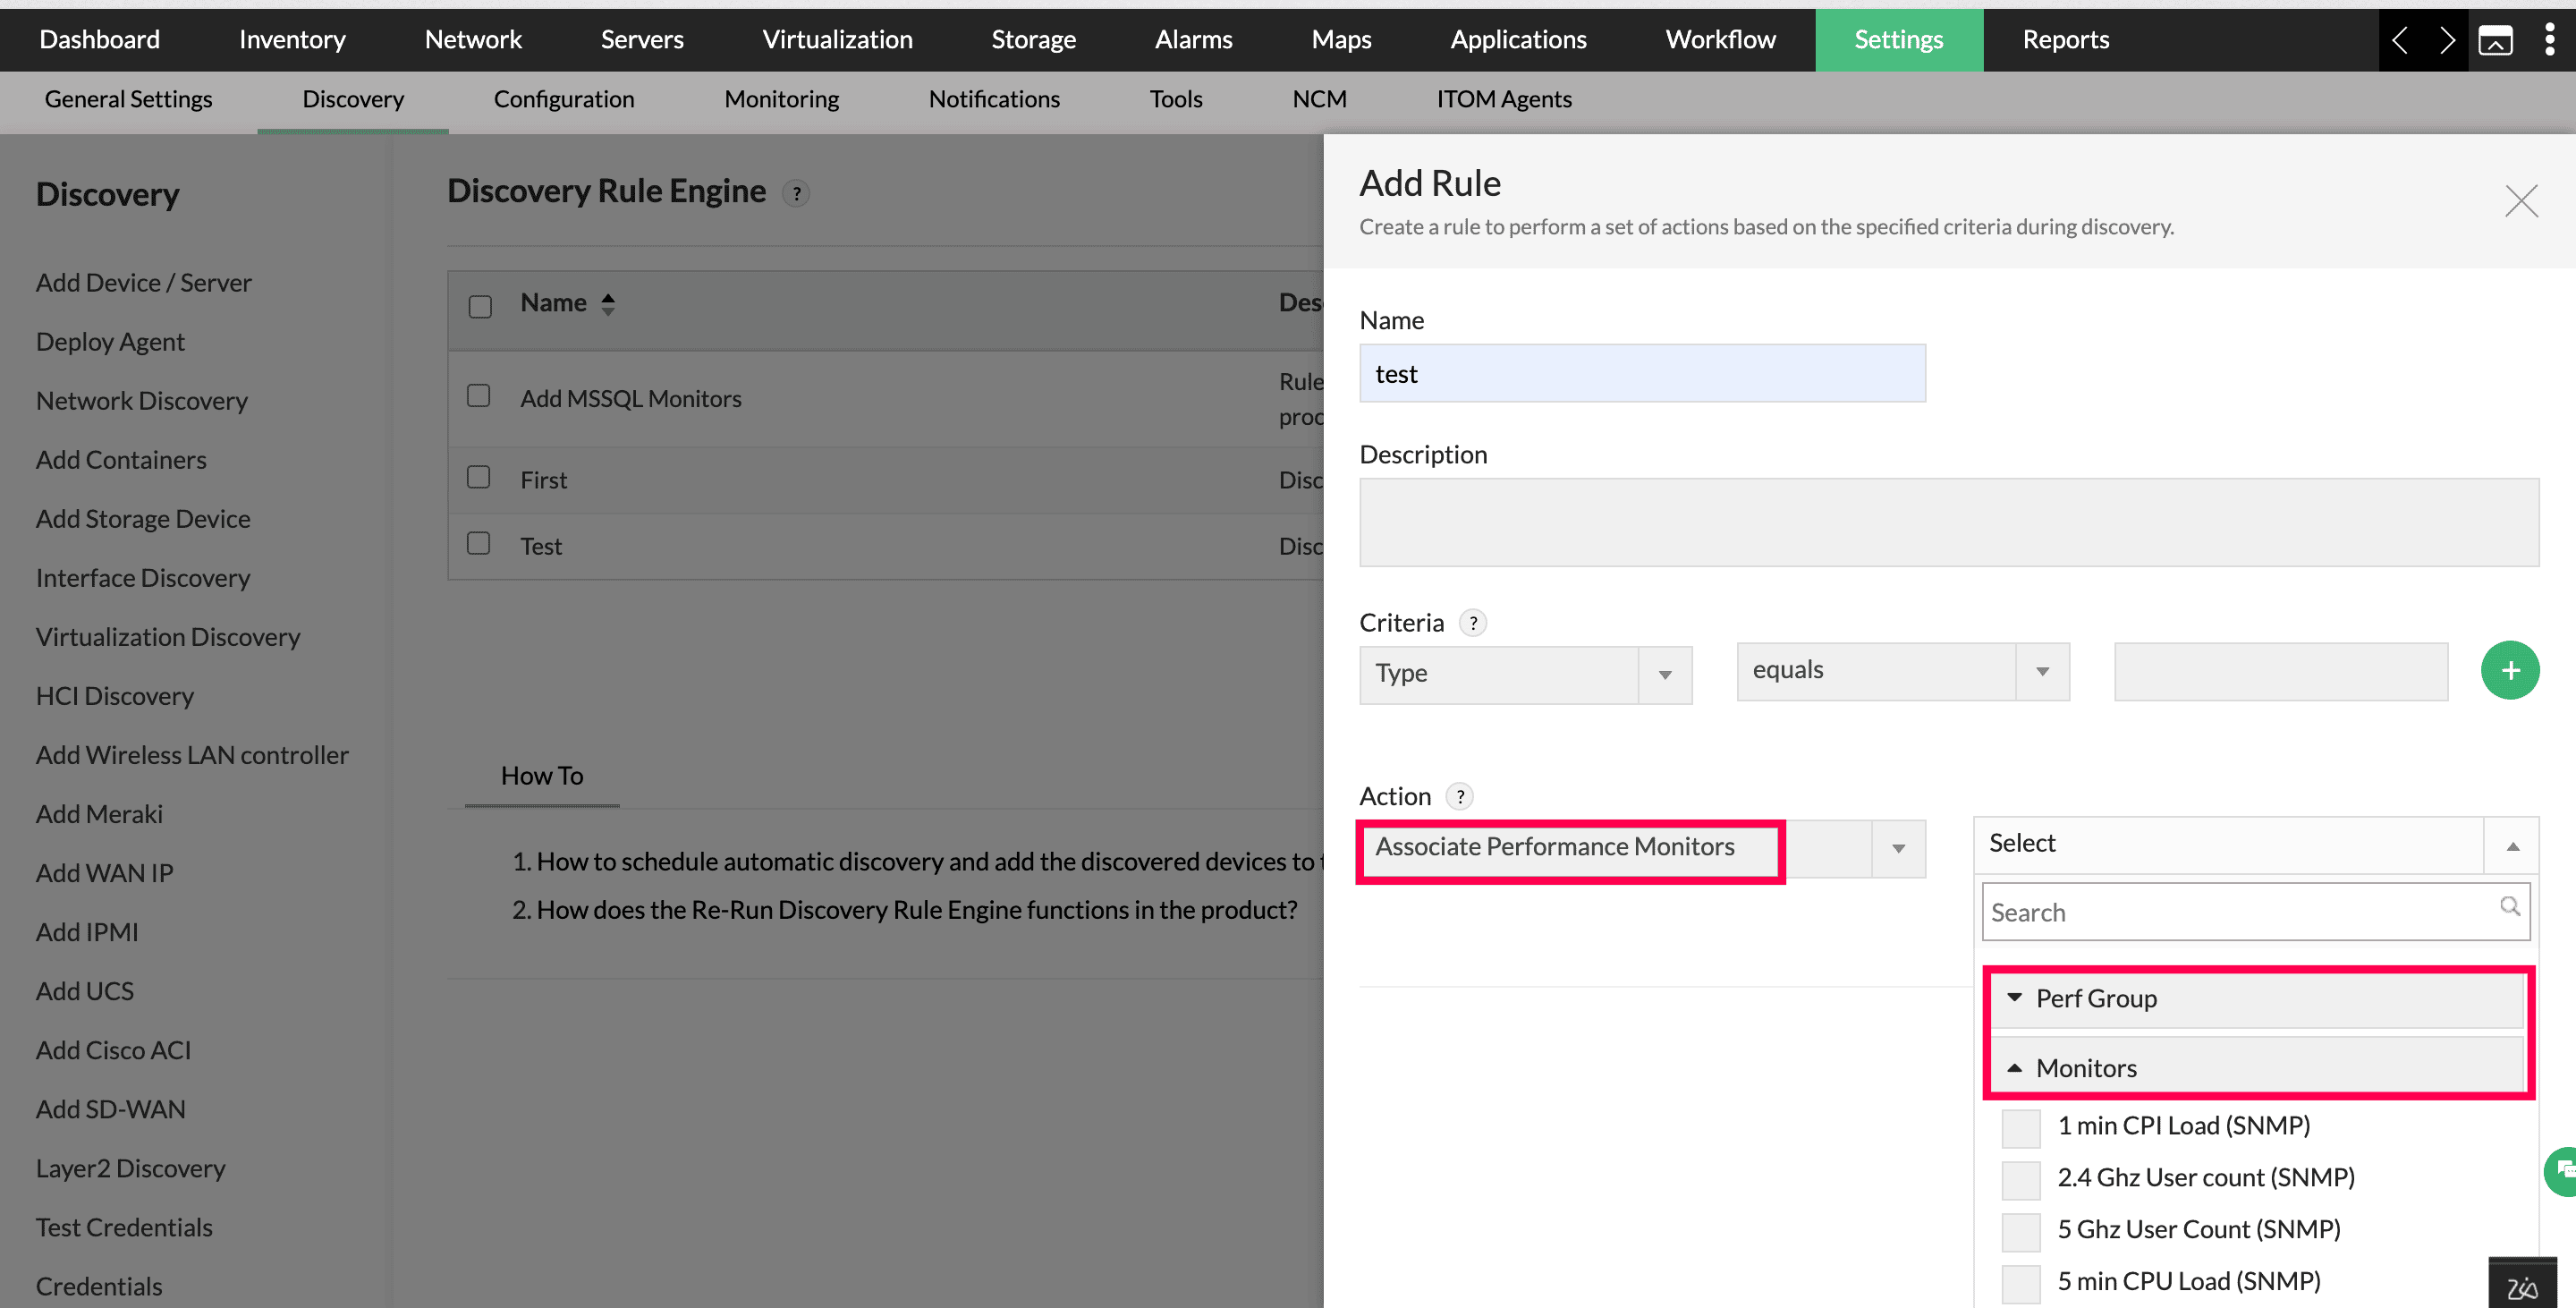
Create a new rule, or edit an existing one where under Actions, you can find Associate Performance Monitors.
Two Simple Ways to Associate Monitors:
Once you select this action, the Perf Monitors panel appears with two options:
- Perf Group
- Monitors
Perf Group
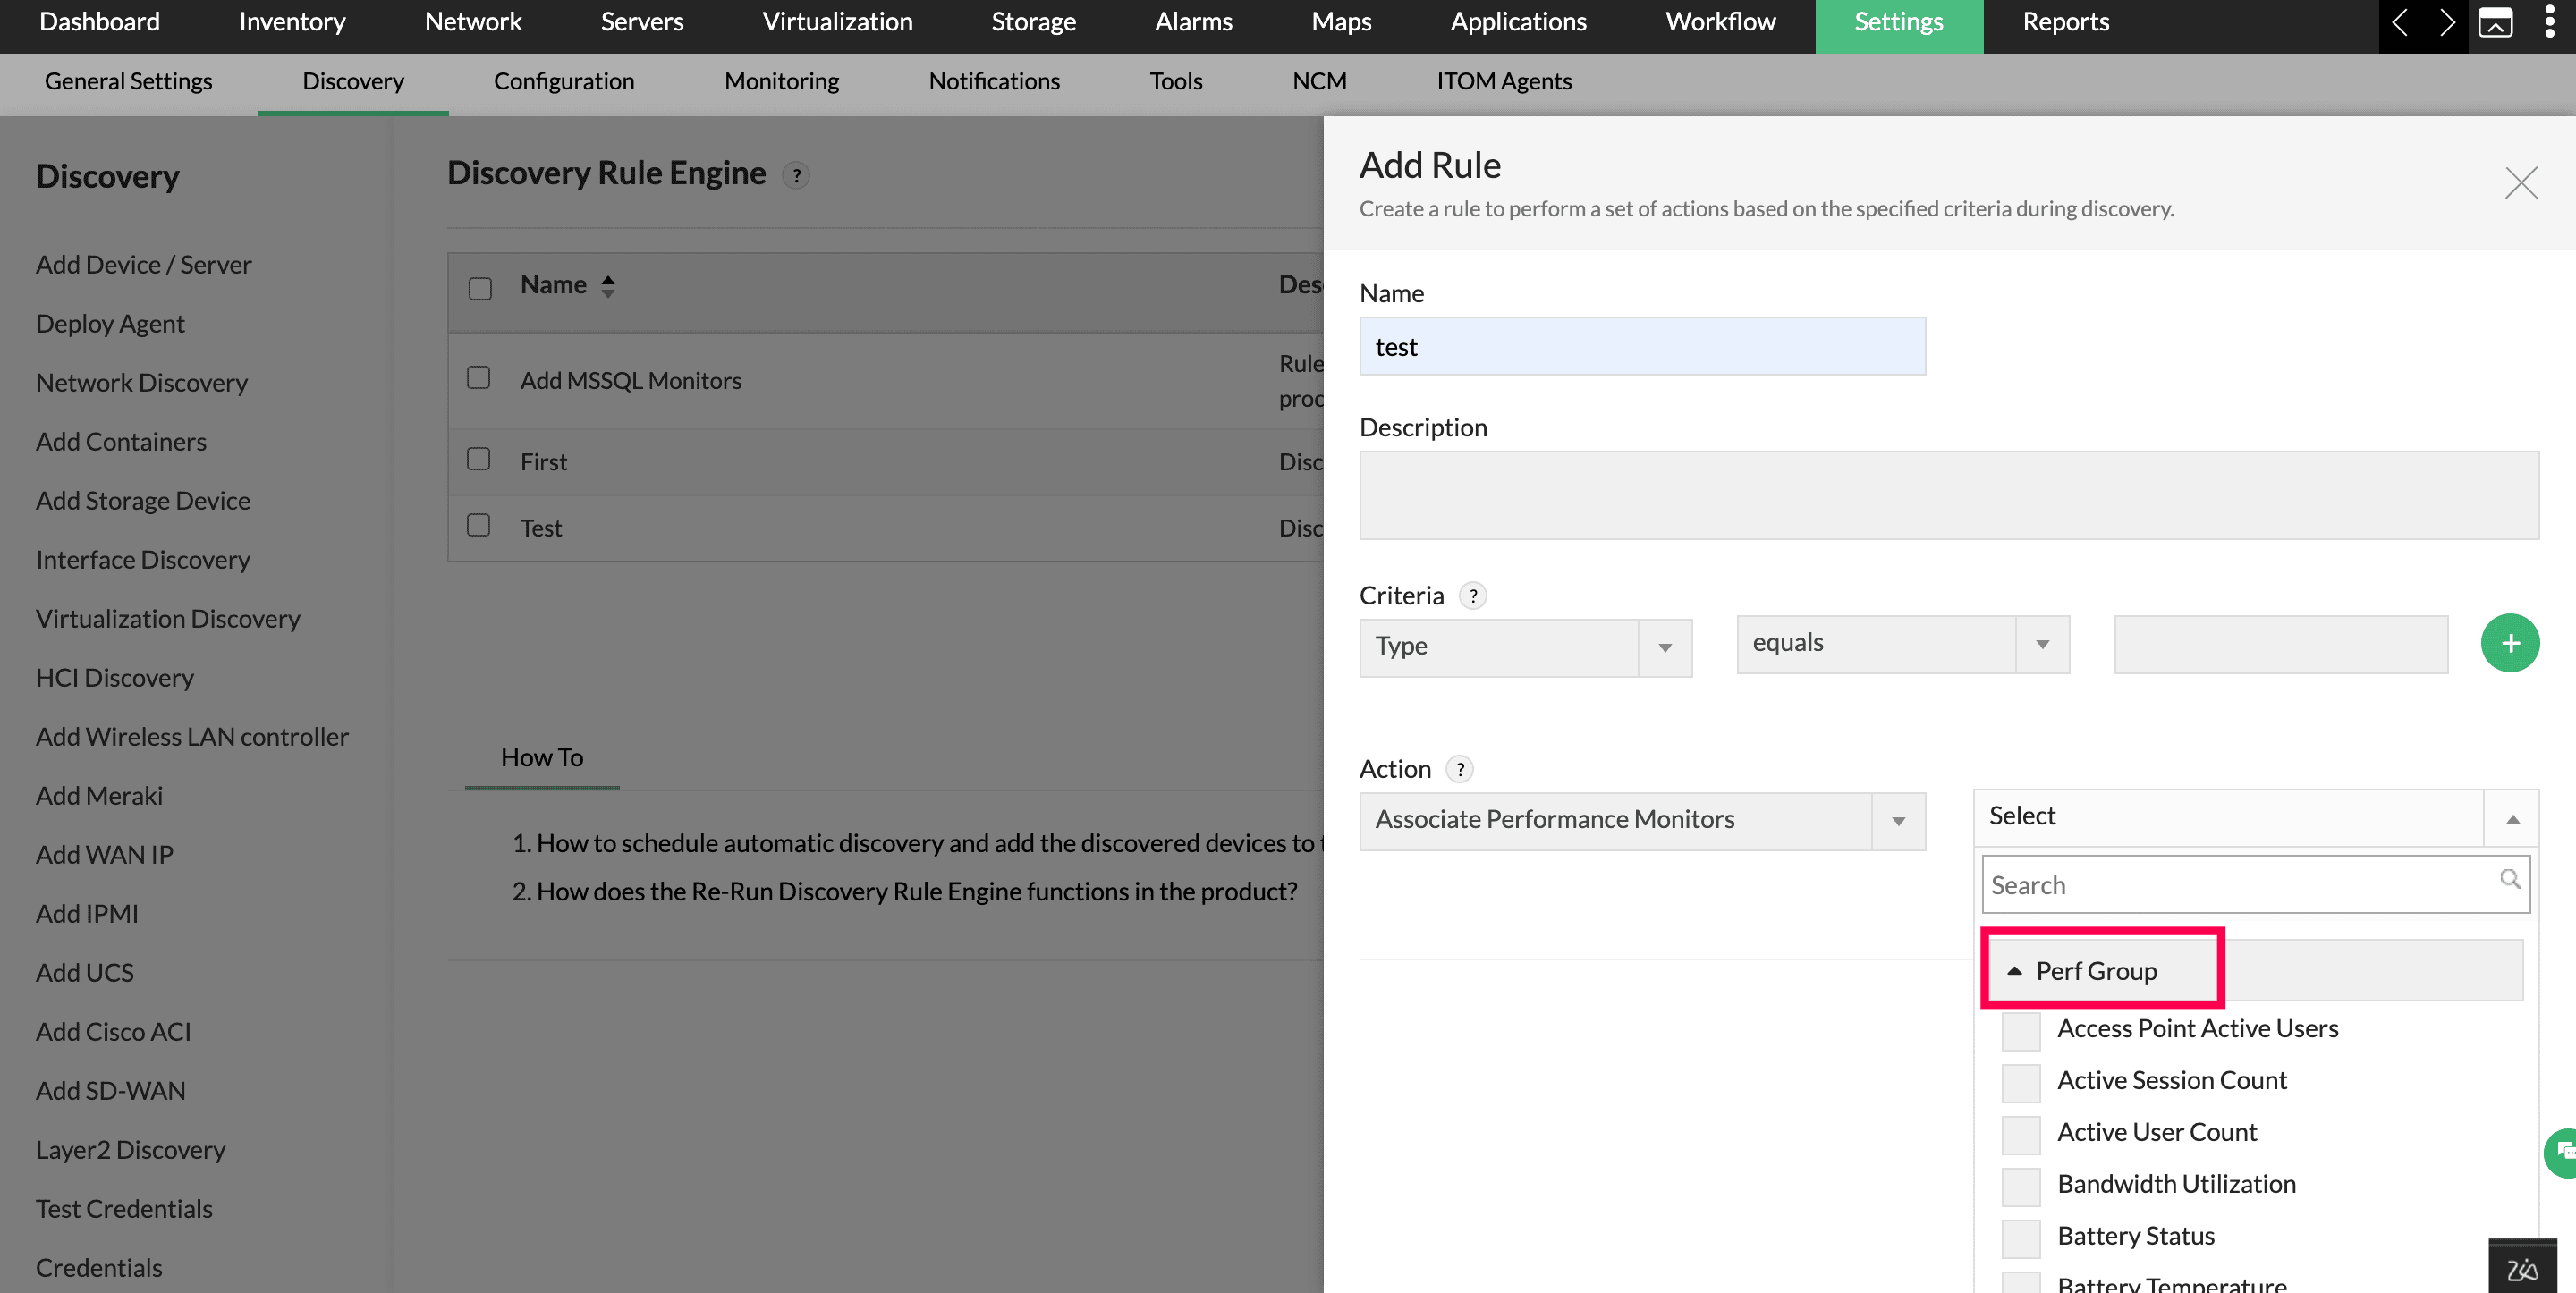
With PerfGroup, you can associate a predefined group of monitors and OpManager automatically picks the applicable monitors from the group based on the device's template mapping and the monitoring protocol it supports.
Note: When a Perf Group contains multiple monitors of the same type, OpManager associates only the first monitor that meets the test criteria.
Monitors
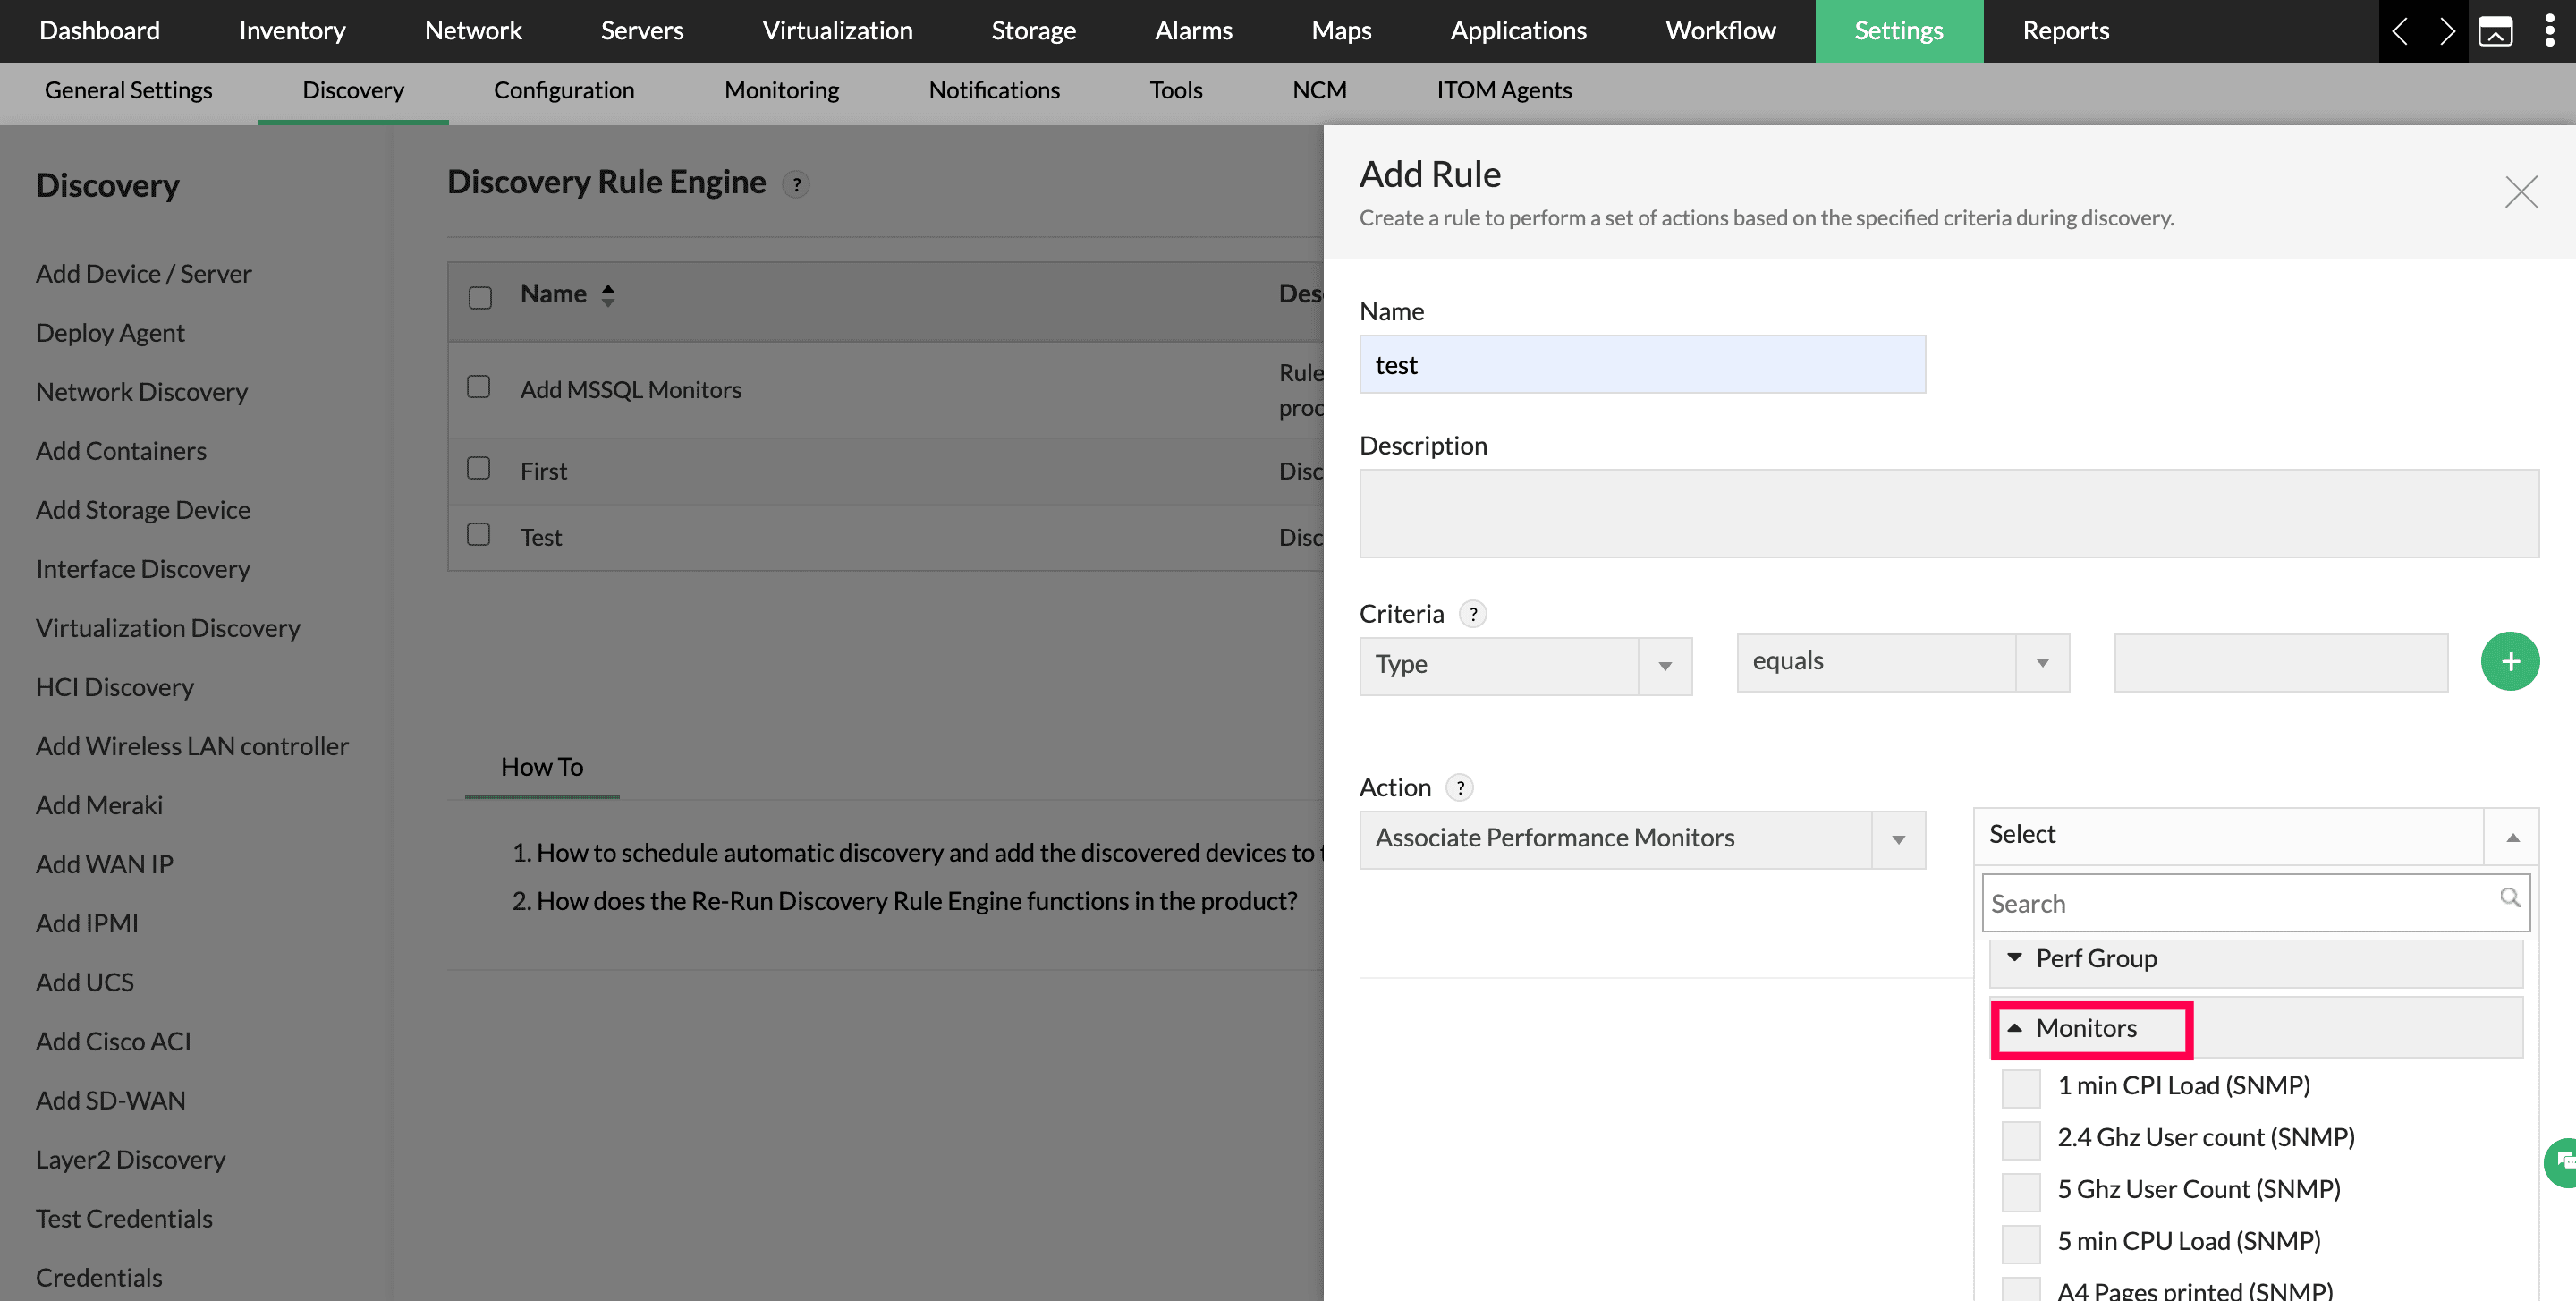
If a specific monitor you need is not included in the selected PerfGroup, you can add it individually using the Monitors option.
Note: The Monitors list only shows monitors that are not assigned to any PerfGroup. Monitors already covered by a PerfGroup do not appear here.
Both options can be used together in the same rule. However, the combined total of monitors selected across PerfGroup and Monitors must not exceed 15.
Configuring Thresholds
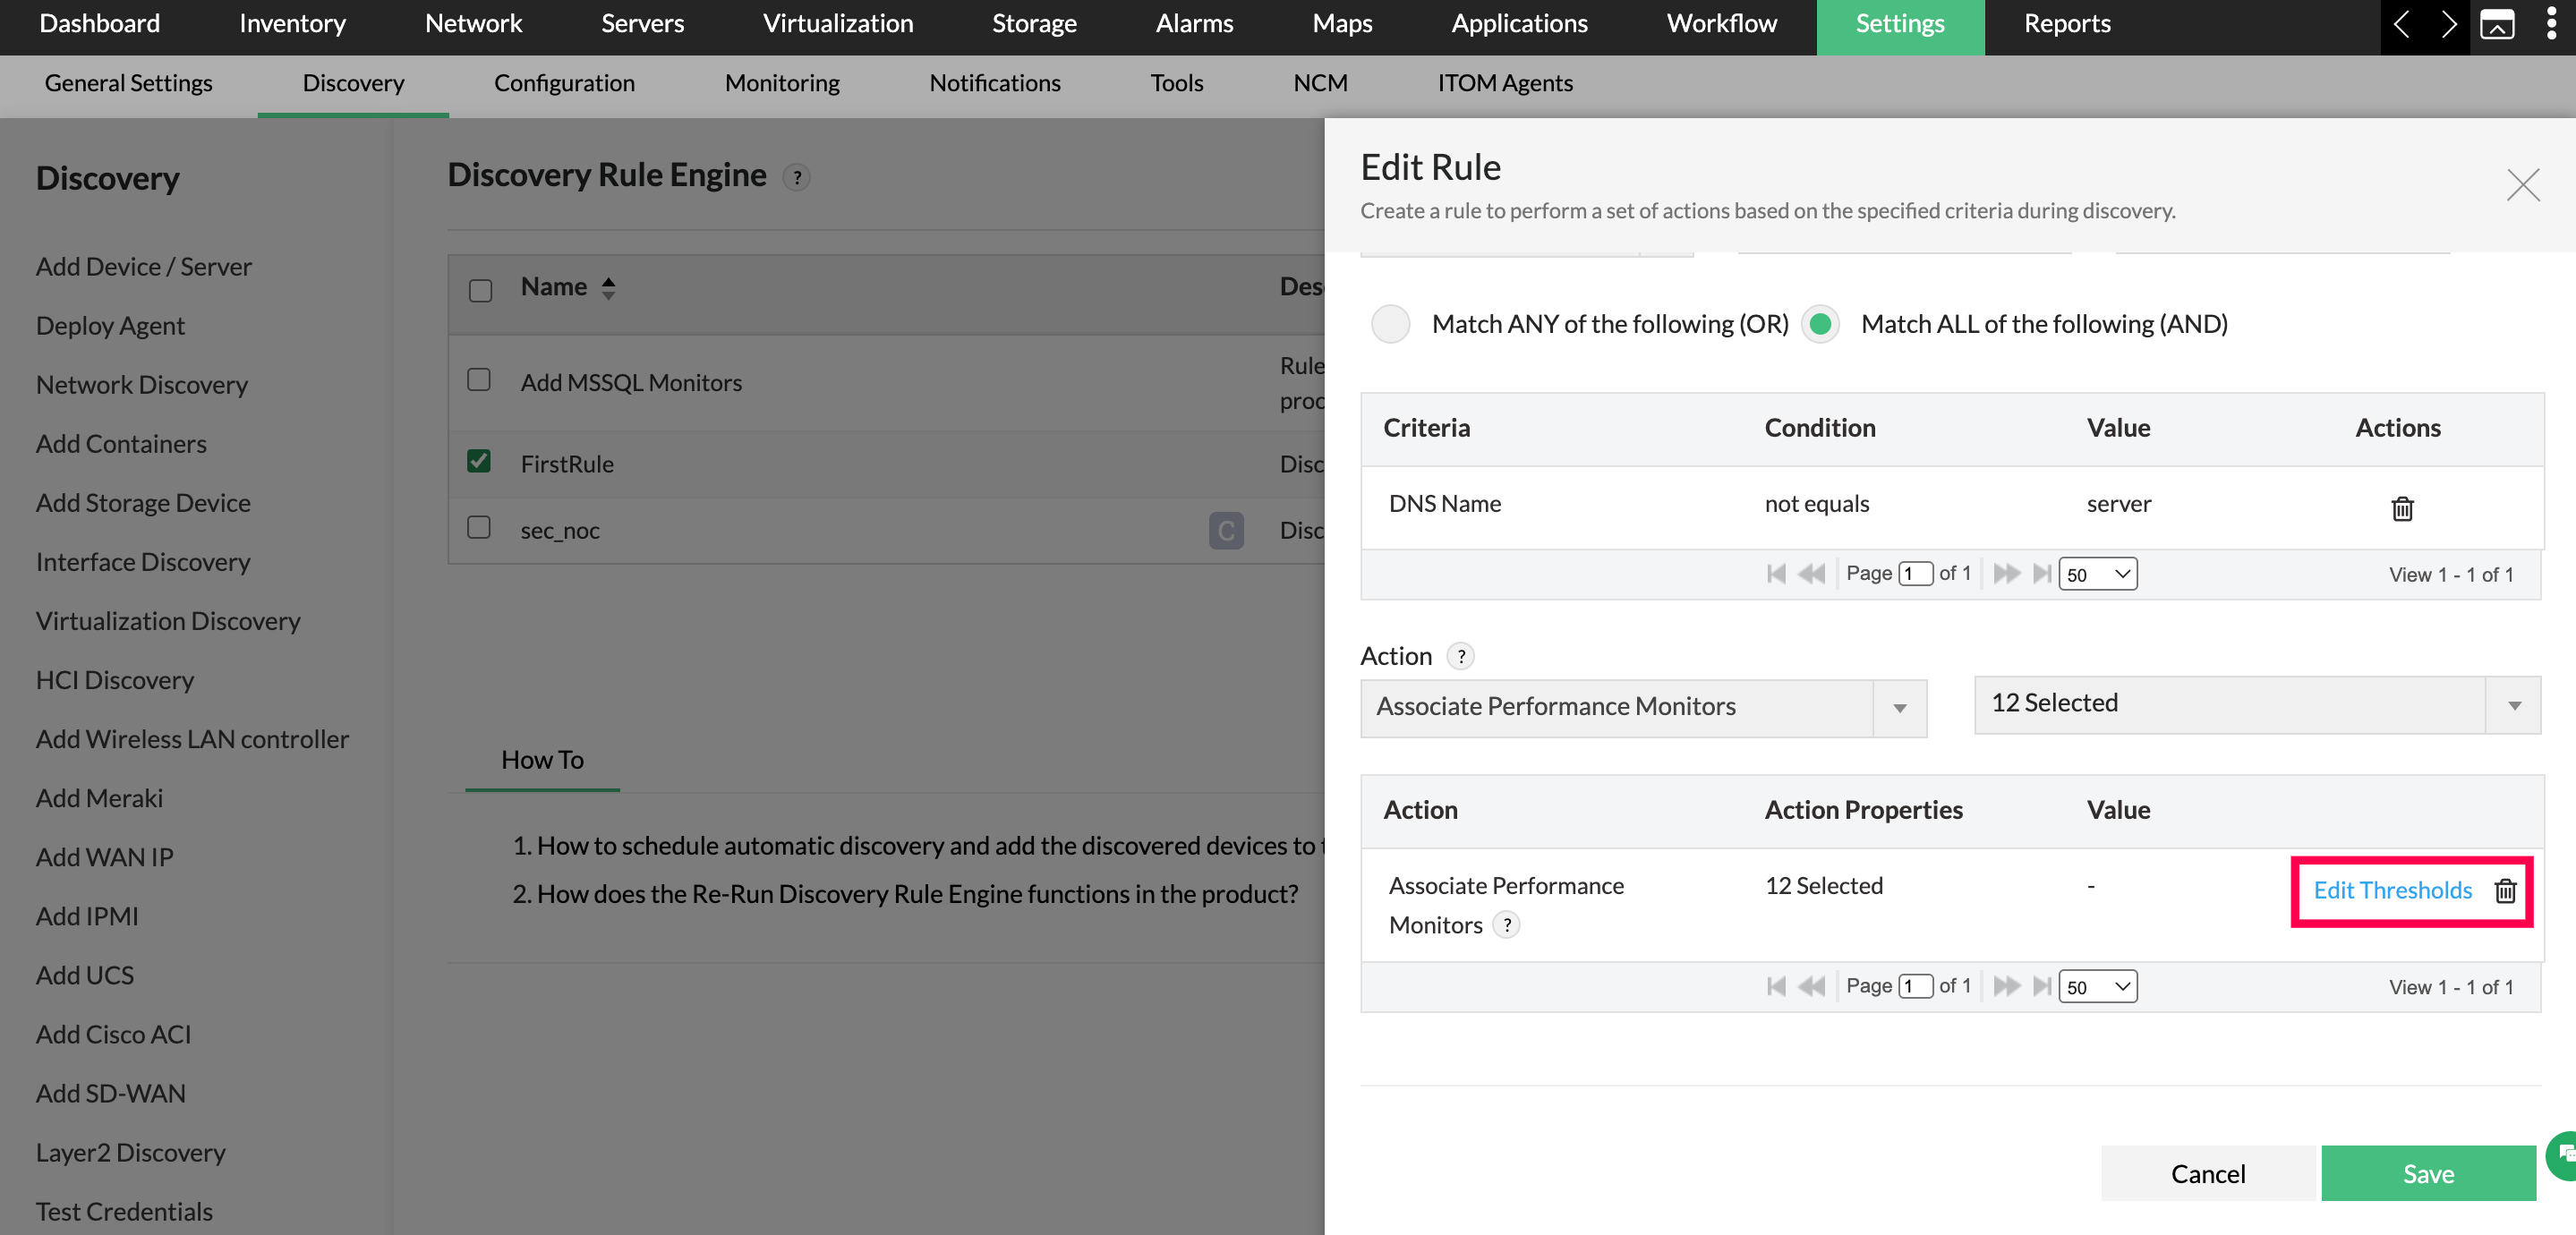
Without thresholds, a performance monitor collects data but raises no alarms, so problems can go unnoticed. Configuring thresholds at the rule level ensures every device matched by the rule is alarm-ready from the moment it is discovered. It also applies a consistent alerting standard across all devices of the same type, avoiding the need to set thresholds device by device.
Note: Threshold configuration is optional. If thresholds are configured here, they take precedence over any thresholds set at the device or template level, for all devices.
Click Edit Thresholds.
Once you click Edit Thresholds, you can configure the following for each performance monitor:
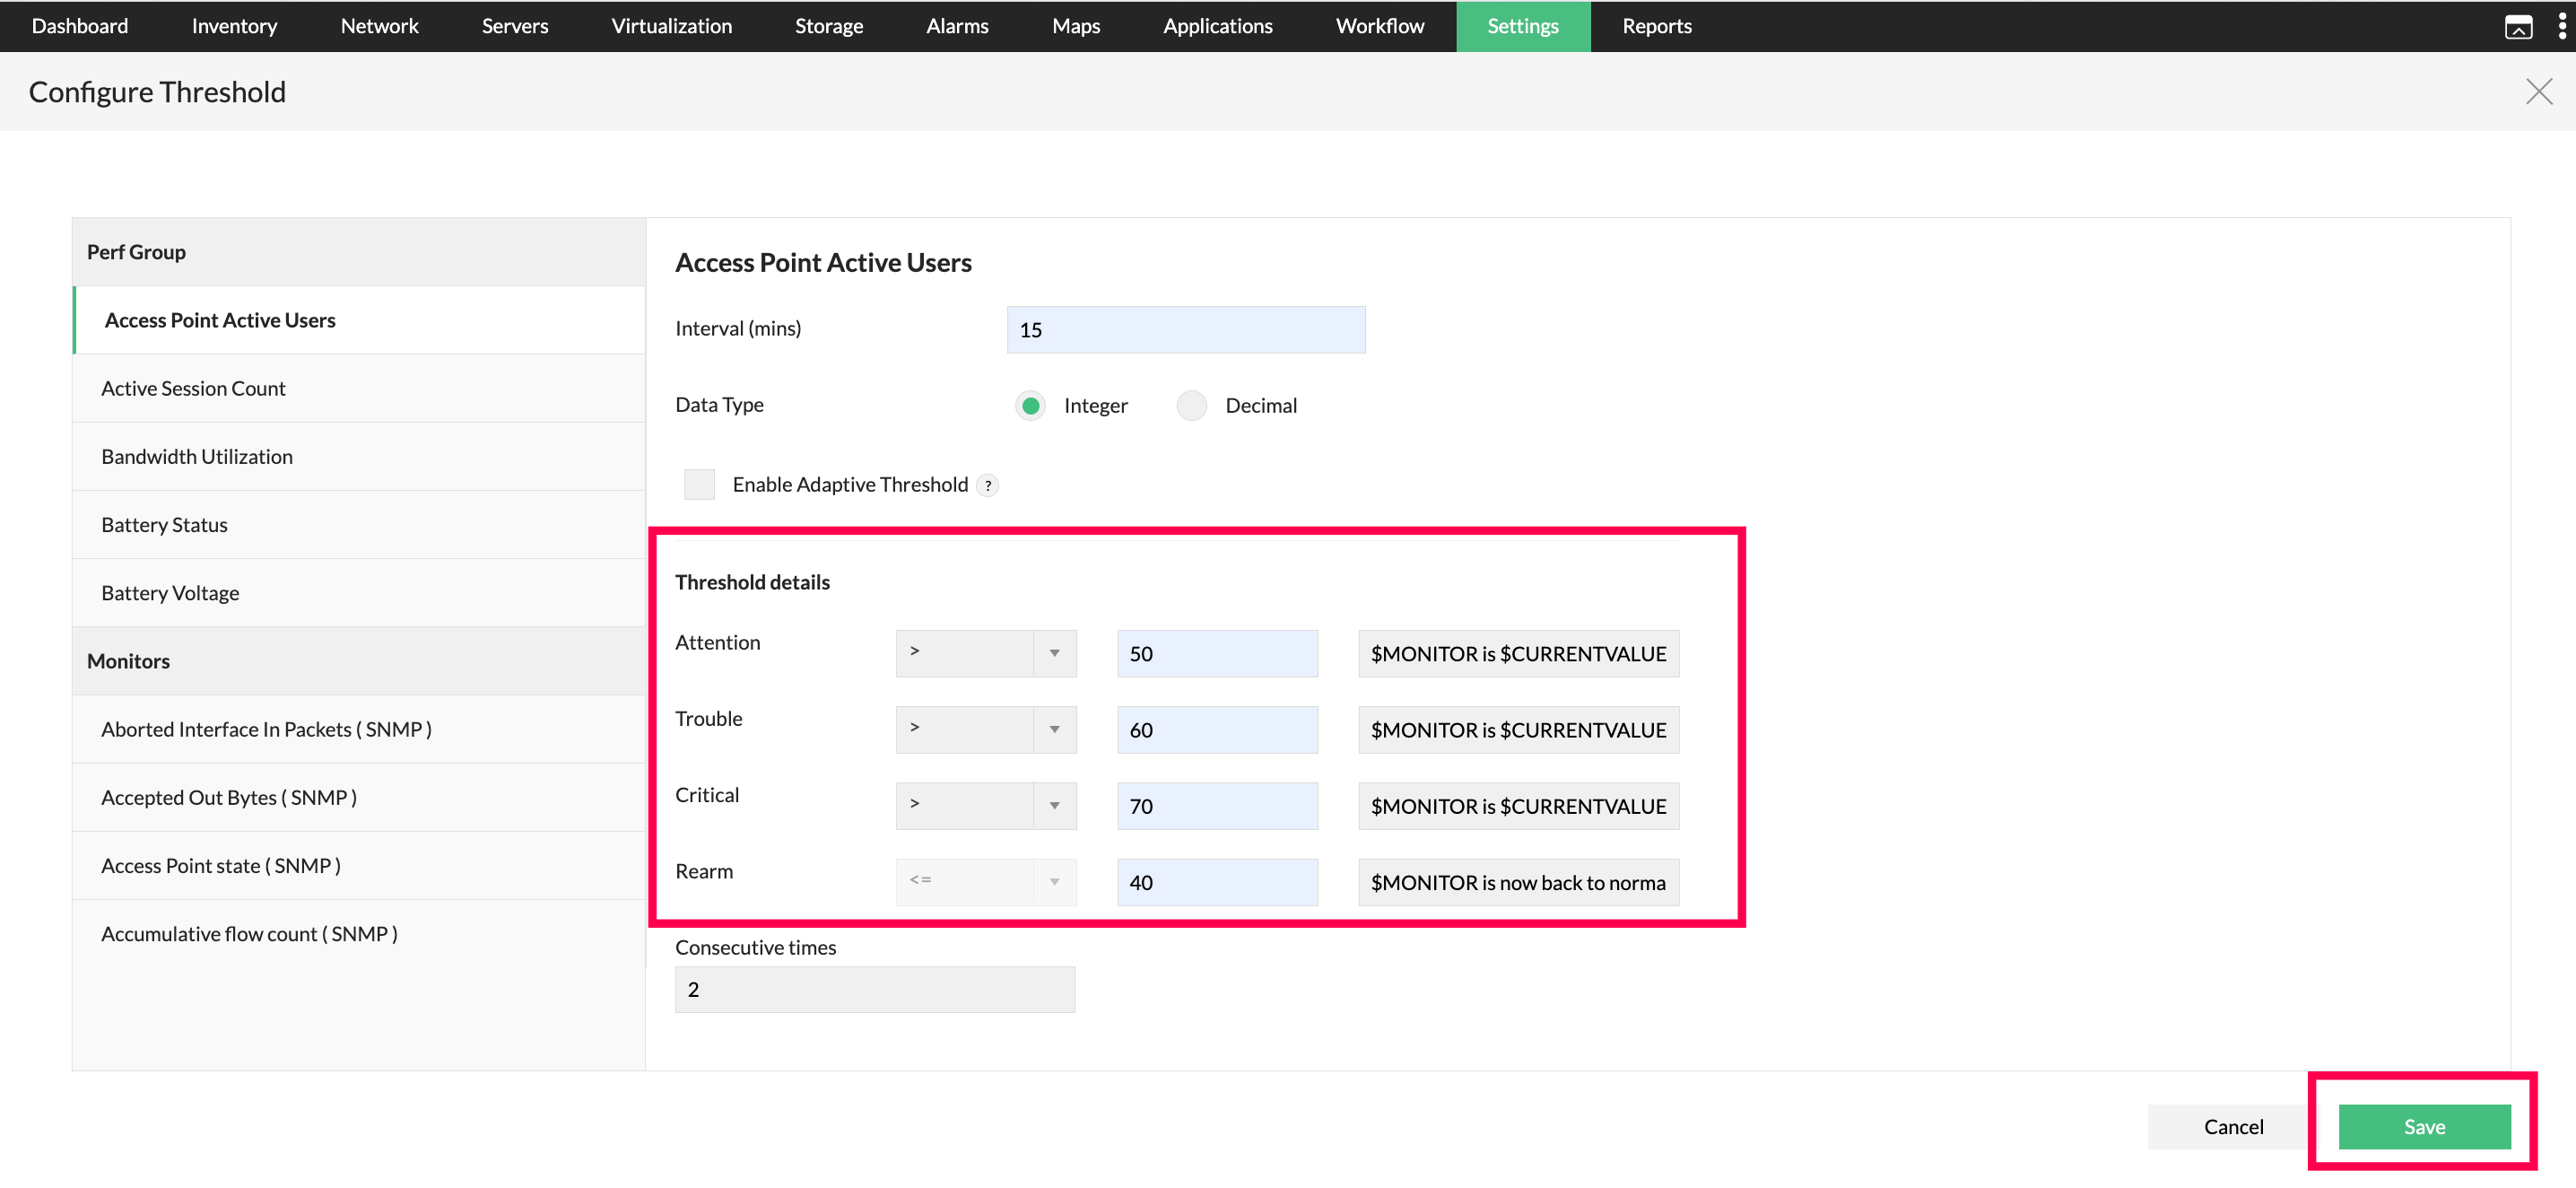
Once you click Edit Thresholds, you can configure the following for each performance monitor:
- Interval: How frequently the metric is polled (e.g., every 15 minutes.
- Data Type: The type of data collected, used to determine how threshold values are evaluated.
- Attention: The threshold value at which an Attention severity alarm is raised.
- Trouble: The threshold value at which a Trouble severity alarm is raised.
- Critical: The threshold value at which a Critical severity alarm is raised.
- Rearm: The value at which an active alarm is automatically cleared once the monitored metric returns to an acceptable level.
- Consecutive Times: The number of back-to-back polling cycles the metric must breach the threshold before an alarm is raised. This prevents false alarms caused by momentary spikes.
Once configured, click Save.
- How to discover devices and interfaces in OpManager?
- How to add a new credential?
- Can I add a non-admin user account for WMI?
- Can I add devices using SSH?
- Why are devices discovered as 'Unknown'?
- What are devices supported in OpManager?
- Why are interfaces not discovered for my device?
- How can I associate device templates to a newly discovered device?
- How to associate monitors to the discovered device?
- What is a discovery filter?
- How to manage or unmanage a device?
- How to configure device dependencies?
- How can find the missing VMs and hosts?
- How can I discover a VLAN?.
- How does availability monitoring work in OpManager?
- What are the basic system requirements to install and use OpManager?
- How can I troubleshoot issues with device discovery?
- How can I troubleshoot issues with VCenter/ESX discovery?