APM Insight Dashboard
Overview
Applications Manager provides a primary set of application performance metrics such as response time, CPU utilization, disk, and memory utilization, error states, etc. These metrics will help you to keep track of the efficiency of applications, during regular intervals. You can also find the number of applications that are active, down, and unmanaged. Attributes like Availability, Application name, Agent type, APDEX score, Errors, Throughput, Fatal count, Avg. Response time etc.. can be viewed and managed either in tabular or grid view.
The performance metrics of the applications being monitored in APM Insight are displayed under the APM tab. These metrics include mainly:
- Application Performance Index (APDEX)
- Response Time
- Throughput, etc.

Configure Alarms
- In APM, the 'Monitor actions' dropdown->'
 Configure Alarm' option is supported at the Instance level (and not the Application level) and is provided on the Instance page so that we can use it to configure Threshold and Actions.
Note: In APM Insight versions 16430 and below, the 'Actions' dropdown->'
Configure Alarm' option is supported at the Instance level (and not the Application level) and is provided on the Instance page so that we can use it to configure Threshold and Actions. - By default, for the Availability and Health attributes, we fetch average data for the last 5 minutes while applying a threshold every minute. For other attributes, we fetch average data for the last 5 minutes while applying a threshold for 5 minutes.
Note: In APM Insight versions 16560 and below, the average data for the last 5 minutes is fetched while applying a threshold for the respective attributes by default. Users can update the 5 minutes interval in the apminsight.properties file under <Applications Manager Home>\working\apminsight\conf directory (Key Name: attribute.update.timeinterval). Restart is required to apply these changes.
Enable Reports
- In APM, the the 'Monitor Actions' dropdown->'
 Enable Reports' option is also supported at the Instance level (and not the Application level) and is provided on the Instance page so that we can use it to enable/disable reportsfor APM Insight attributes.
Note: In APM Insight versions 16430 and below, the Actions' dropdown->'
Enable Reports' option is also supported at the Instance level (and not the Application level) and is provided on the Instance page so that we can use it to enable/disable reports for APM Insight attributes. - By default, reports are enabled for all APM Insight attributes (under Setting → Enable Reports → Custom Reports → Set Monitor Type to APM Insight) and can be customized based on the requirement. Following is the list of reports that can be generated for APM Insight attributes:
- Trend Analysis Report
- At a Glance Report
- Forecast Report
- Inventory Report
- Schedule Reports
- Availability Report
- Health Report
- Attributes Report
Note: Common time zone should be maintained between the Applications Manager server and APM Insight agent-installed server for proper functioning.
Monitored Parameters
To view detailed performance metrics, click over the corresponding listed instance. The metrics are categorized into ten different tabs for better understanding:
- Monitor Information
- Overview
- Transactions
- Database
- Traces
- JVM
- Exceptions
- Service Map
- App Parameters
- Thread Profiling
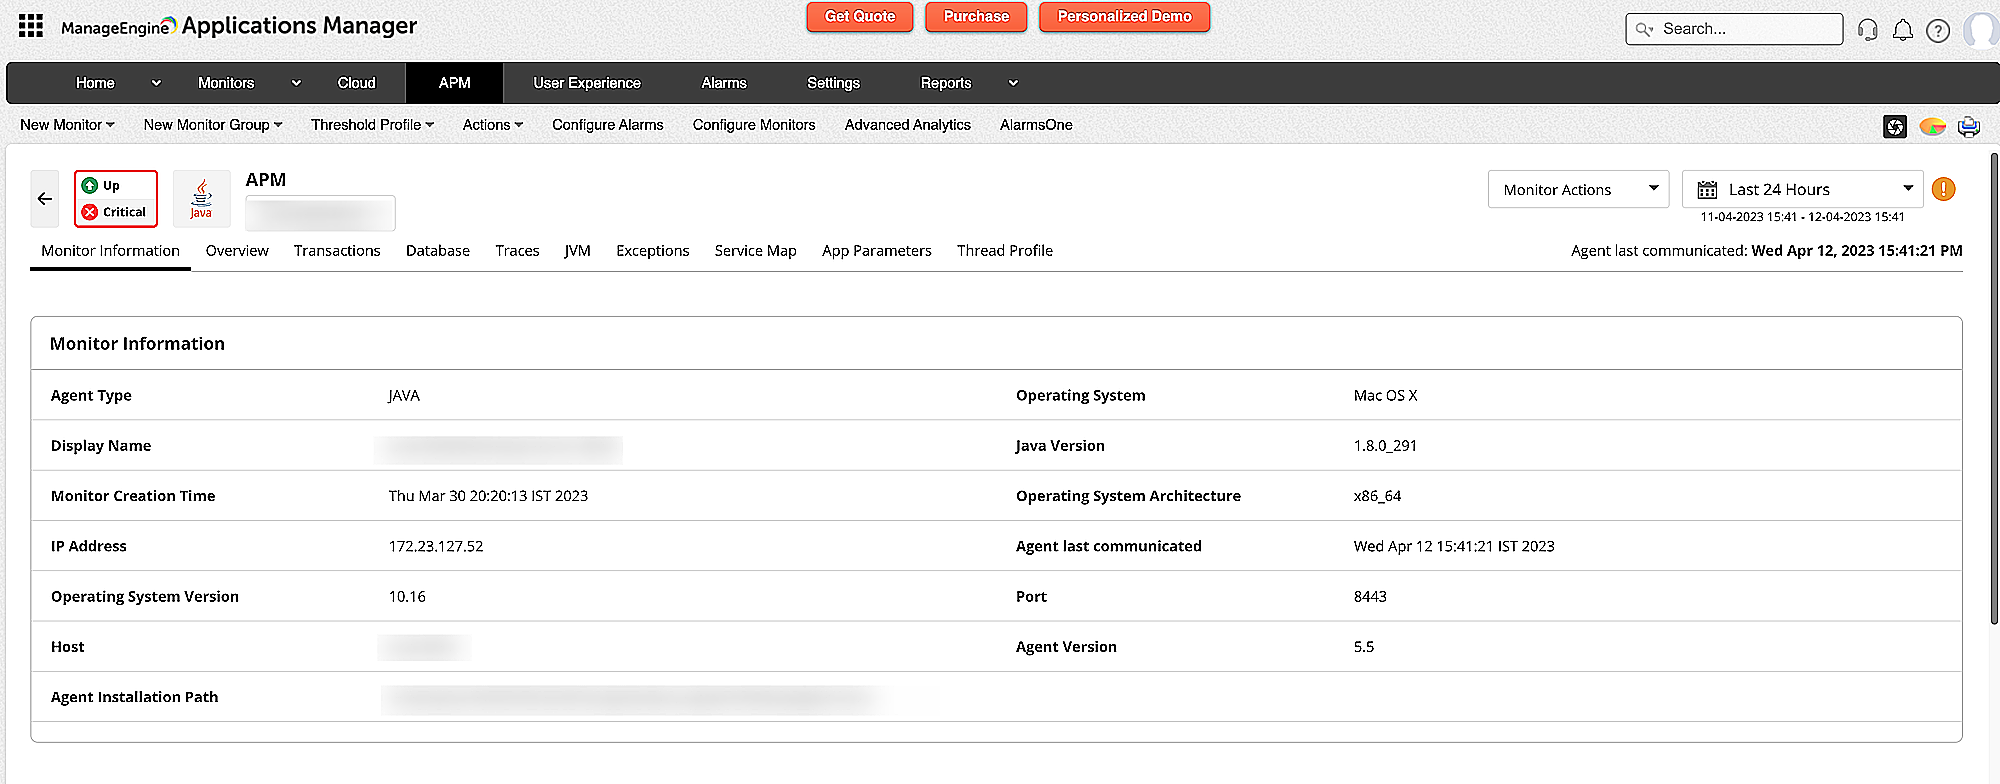
Monitor Information
The Monitor Information tab displays crucial specifications related to your monitor pertaining to the Operating system, Host, Port, etc.
Instance Split Up:
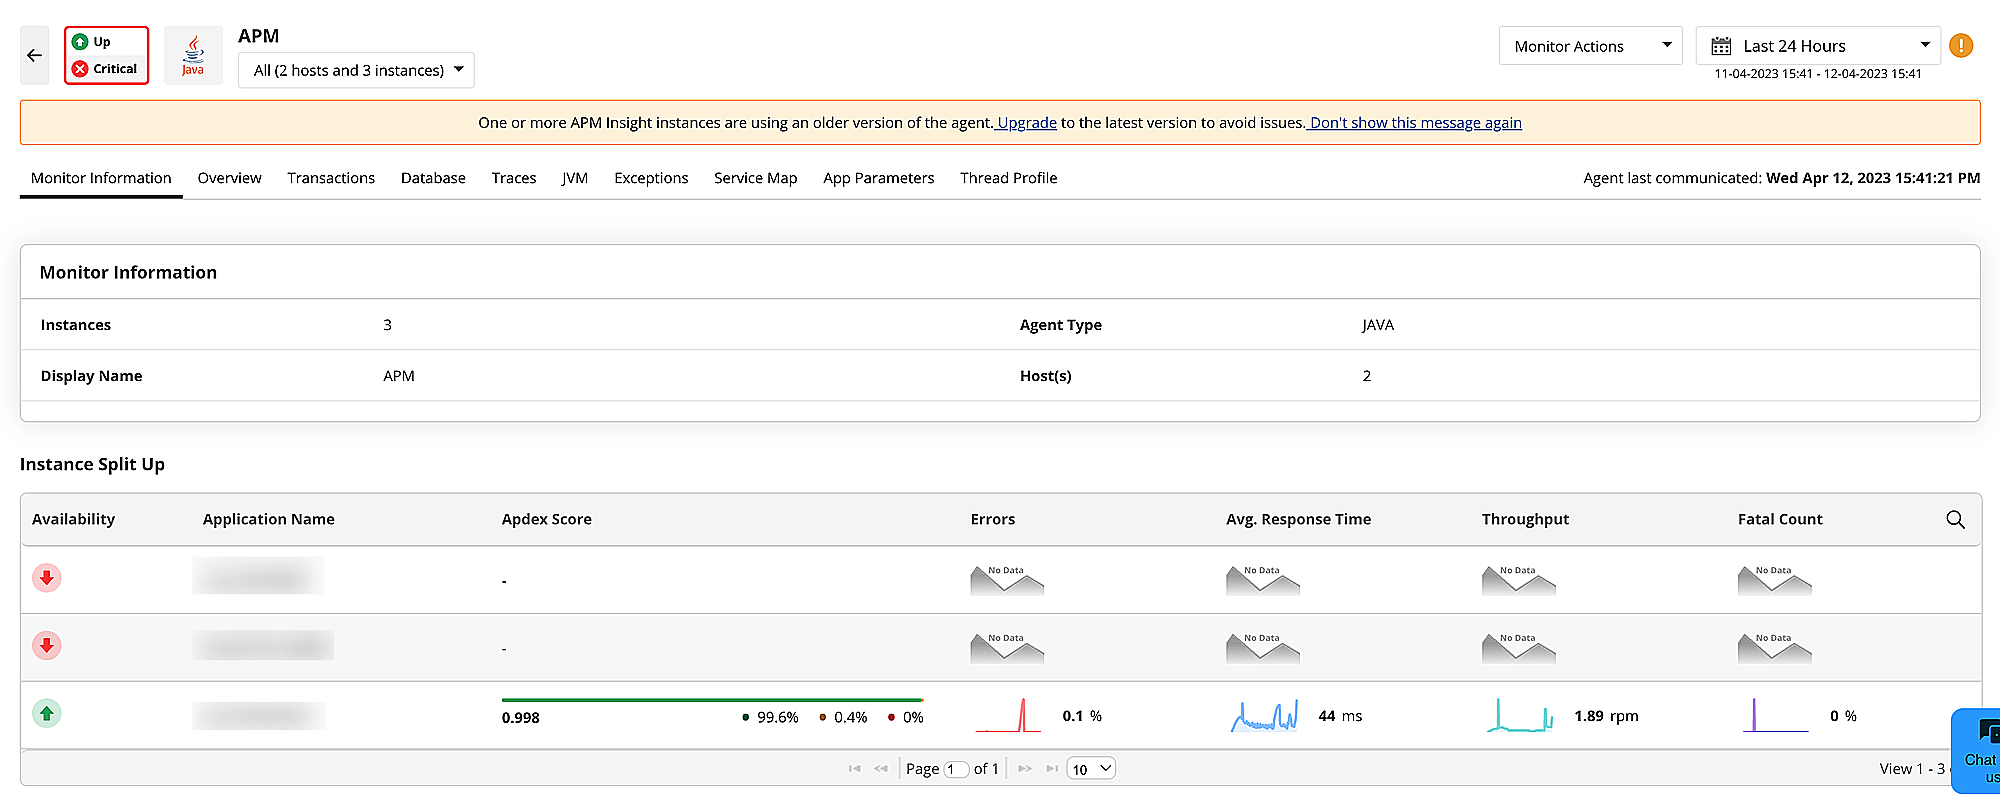
Following are the metrics displayed in the Monitor Information tab:
| Category | Attribute | Description | Agent / Supported Application | ||||||
|---|---|---|---|---|---|---|---|---|---|
| Java | .NET | .NET Core | Node.js | PHP | Ruby | Python | |||
| Application | Display Name | Name of the application given during the time of monitor creation. |  | | | | | | |
| Agent Type | Type of the agent running on the particular Application. | | | | | | | | |
| Hosts | Total number of hosts present in the particular application. | | | | | | | | |
| Instances | Total Number of Instances present on the particular application. | | | | | | | | |
| Associated Monitor groups | Displays the monitors associated with all the groups. | | | | | | | | |
| Instance | Display Name | Name of the instance given during the time of monitor creation. | | | | | | | |
| Agent Installed Path | Indicates the directory where the agent is installed. | | | | |  | | | |
| Last communicated time | The timestamp when the agent last communicated with the Application Manager. | | | | | | | | |
| Agent Type | Type of the agent running on the particular instance. | | | | | | | | |
| Monitor Creation Time | The time at which the monitor was created. | | | | | | | | |
| Agent Version | Indicates the agent version which is currently used. | | | | | | | | |
| Host | The host where the agent is running on a particular instance. | | | | | | | | |
| Port | The port where the agent is running on a particular instance. | | | | | | | | |
| IP Address | The IP Address of the particular instance. | | | | | | | | |
| OS | Operating System where the instance of the application is running. | | | | | | | | |
| OS Version | Version of the operating system where the instance of the application is running. | | | | | | | | |
| OS Architecture | Architecture of the operating system where the instance of the application is running. | | | | | | | | |
| Application Runtime Environment Version | Environment version where the application is running. | | | | | | | | |
| Data Exporter Version | Indicates the Data Exporter version which is currently used. | | | | | | | | |
| Data Exporter Installation Path | Indicates the directory where the Data Exporter is installed. | | | | | | | | |
| Associated Monitor groups | Displays the monitors associated with all the groups. | | | | | | | | |
| Application Server | Displayes the type of the Application server used by the running instance. | | | | | | | | |
Overview
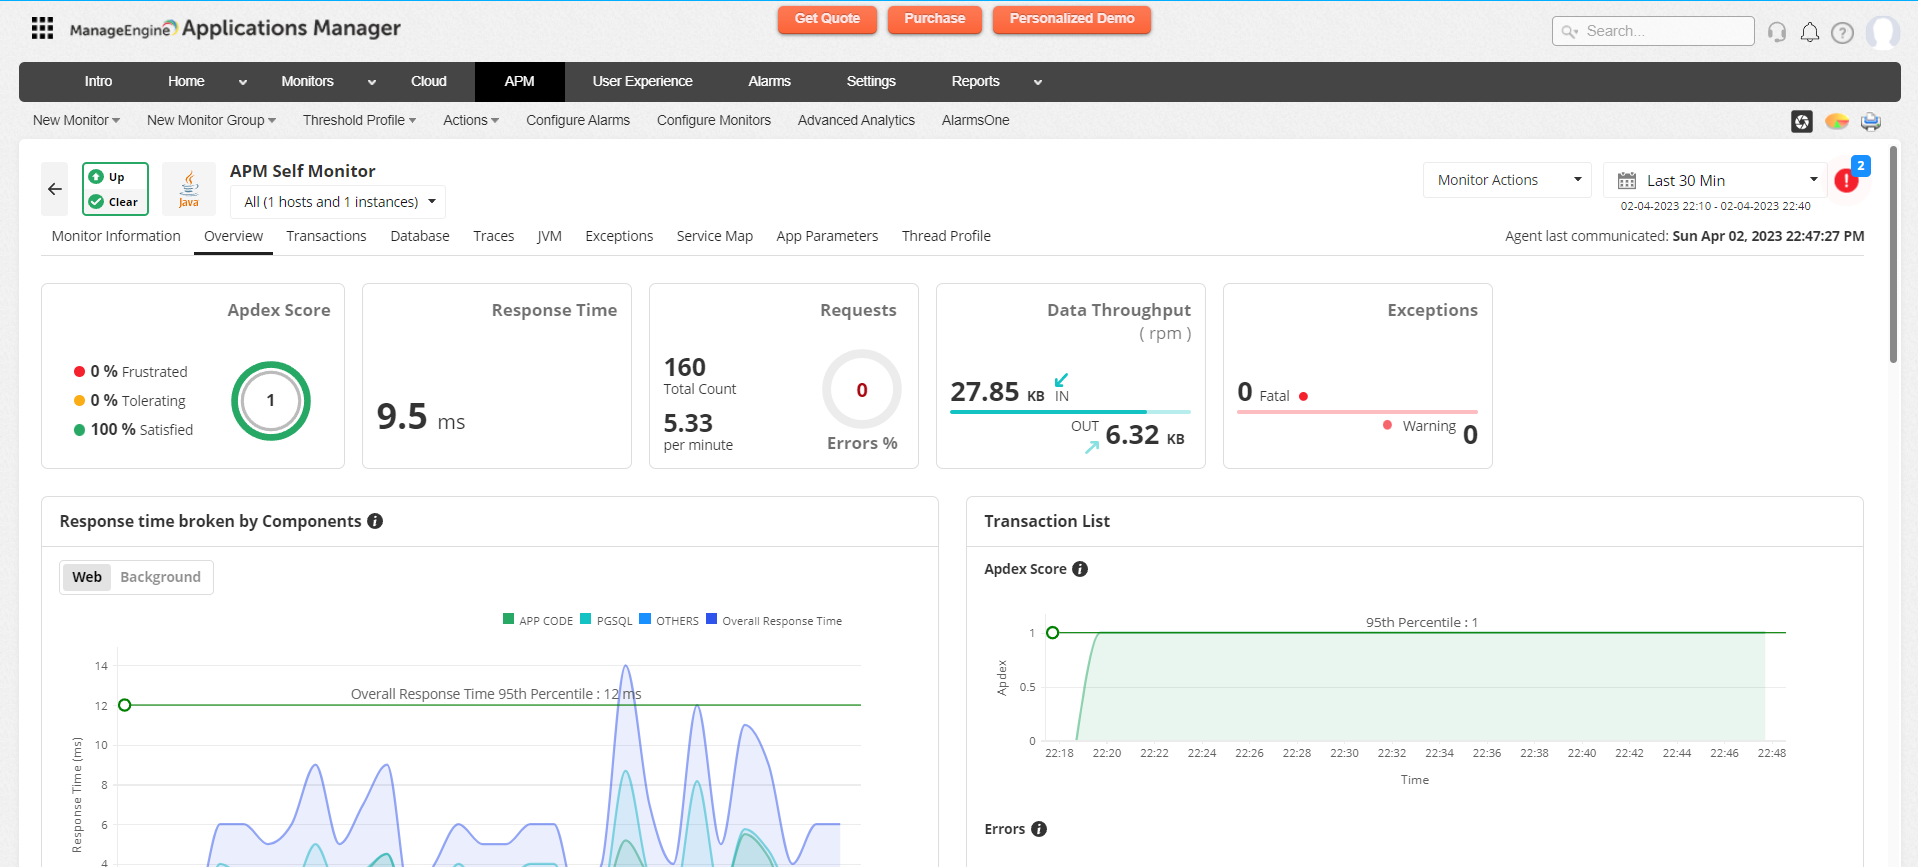
The performance metrics of the applications being monitored in APM Insight are displayed under the Overview tab. These metrics include:
| Category | Attribute | Description | Agent / Supported Application | ||||||
|---|---|---|---|---|---|---|---|---|---|
| Java | .NET | .NET Core | Node.js | PHP | Ruby | Python | |||
| Application/Instance information | Apdex Score | It is a measure of response time based on a set threshold. Satisfied, Tolerating, and Frustrated are the percentages of users under the respective categories. | | | | | | | |
| Average Response Time | The average response time of transactions for the chosen time frame. | | | | | | | | |
| Request - Total Count | The total number of transactions that are running in the application. | | | | | | | | |
| Requests - Per minute | The number of requests served per minute for the chosen time frame. | | | | | | | | |
| Errors | The percentage of errors encountered in relation to the total number of requests made at the application level during a specific time period. Errors(%) = (Error Count/ Total request Count) * 100 Where,
| | | | | | | | |
| Exceptions | The total number of exceptions that occurred at the application level within a specific time frame. Exceptions = Fatal Exception + Warning Exception Where,
| | | | | | | | |
| Data Throughput | The size of the request and response objects are tracked. | | | | | | | | |
| Agent Last Communicated | The timestamp at which the agent communicated with APM. | | | | | | | | |
| Graph Metrics | Min | The minimum value for the corresponding parameter for the chosen time frame. | | | | | | | |
| Max | The maximum value of the corresponding parameter in the chosen time frame. | | | | | | | | |
| 95th Percentile | The 95th percentile of the value of the corresponding parameter within the chosen time frame. | | | | | | | | |
| Average | The averaged value for the corresponding parameter for chosen time frame. | | | | | | | | |
| Average Resp. Time | The averaged value for the corresponding response time of transaction for chosen time frame. | | | | | | | | |
| Apdex Score | A decimal value between 0 and 1 for instance or application for the chosen time frame. | | | | | | | | |
| Throughput | The number of requests served per minute for the chosen time frame. (cpm) | | | | | | | | |
| Count | The number of occurrences for the particular parameter in the chosen time frame. | | | | | | | | |
| Transaction Name | The name of the transaction. | | | | | | | | |
| Resp. Time | The value of response time for a transaction. | | | | | | | | |
| Exception Count | The total number of exceptions that occurred at the application level within a specific time frame. Exceptions = Fatal Exception + Warning Exception Where,
| | | | | | | | |
In addition to the above metrics, you can also view various types of transaction details and represent them as graphs/charts. These include:
| Graph | Agent / Supported Application | ||||||
|---|---|---|---|---|---|---|---|
| Java | .NET | .NET Core | Node.js | PHP | Ruby | Python | |
| Response time broken by Components | | | | | | | |
| Apdex Score | | | | | | | |
| Request Throughput | | | | | | | |
| Data Throughput | | | | | | | |
| Errors | | | | | | | |
| Exception count | | | | | | | |
| Exception Split up | | | | | | | |
| Recent 5 Error Transactions | | | | | | | |
| Top 5 Transactions by Resp. Time (in sec) | | | | | | | |
| Recent 5 Exception Traces | | | | | | | |
| Top 5 Slow Traces (in sec) | | | | | | | |
Transactions
The Transactions tab displays transaction details pertaining to the action that consumes longer time, frequently accessed actions, and tier-wise breakdown of transaction response time (Example: JVM, Database, and much more) from the application level down to the individual transaction level. You can also view various transactions that are running as Web Transaction, Background, or Errors.
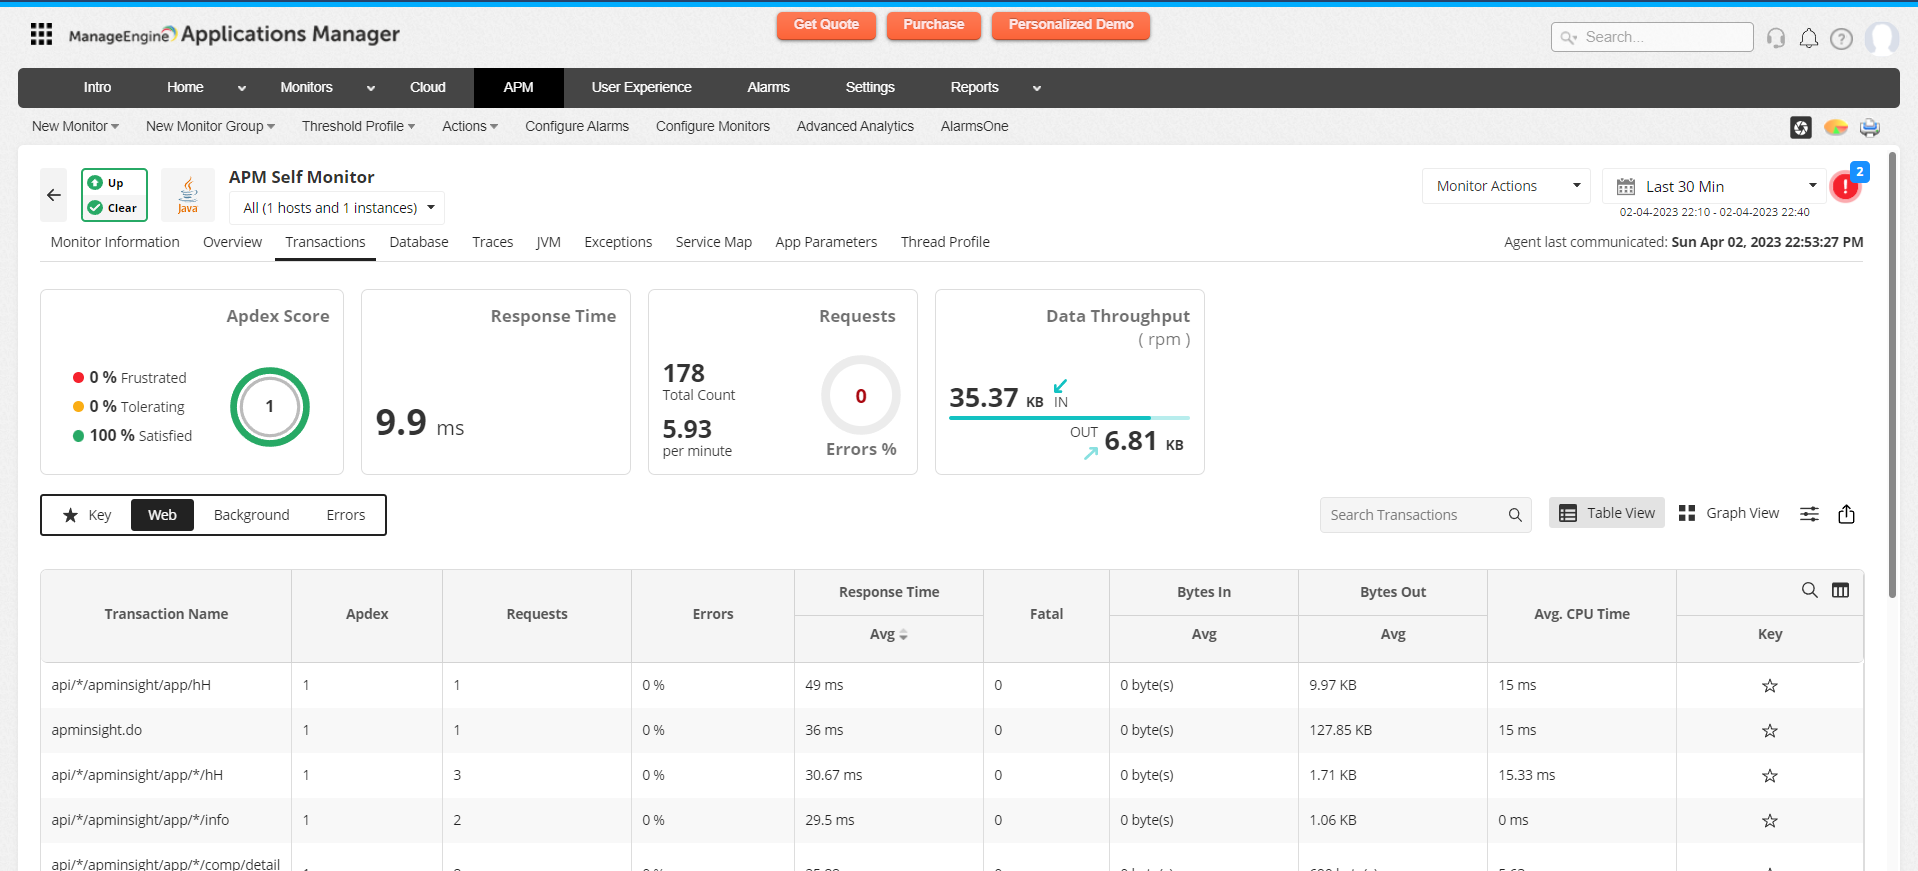
Below are the metrics shown in the Transactions tab:
| Category | Attribute | Description | Agent / Supported Application | ||||||
|---|---|---|---|---|---|---|---|---|---|
| Java | .NET | .NET Core | Node.js | PHP | Ruby | Python | |||
| Table Metrics | Transaction Name | Name of the transaction | | | | | | | |
| Apdex | The Application Performance Index (APDEX) score of the transaction. | | | | | | | | |
| Requests | The number of requests made for the transaction. | | | | | | | | |
| Errors | The percentage of errors relative to the total number of requests made during a specific time period at the transaction level. Errors(%) = (Error Count/ Total request Count) * 100 Where,
| | | | | | | | |
| Avg. CPU Time | The average value of the amount of time taken by the CPU to run the transaction (in ms). | | | | | | | | |
| Fatal | Count of exceptions at the transaction level classified as 'Fatal.' These exceptions indicate critical issues that can severely impact the transaction's functionality. | | | | | | | | |
| Response Time | |||||||||
| Avg | The average value of the time taken for the transaction to respond within the application (in sec). | | | | | | | | |
| Min | The minimum amount of time taken for the transaction to respond within the application (in sec). | | | | | | | | |
| Max | The maximum amount of time taken for the transaction to respond within the application (in sec). | | | | | | | | |
| Total | The total amount of time taken for the transaction to respond within the application (in sec). | | | | | | | | |
| Bytes In | |||||||||
| Avg | The average amount of bytes that are received by that transaction within the application. | | | | | | | | |
| Min | The minimum amount of bytes that are received by that transaction within the application. | | | | | | | | |
| Max | The maximum amount of bytes that are received by that transaction within the application. | | | | | | | | |
| Total | The total amount of bytes that are received by that transaction within the application. | | | | | | | | |
| Bytes Out | |||||||||
| Avg | The average amount of bytes that are sent from that transaction within the application. | | | | | | | | |
| Min | The minimum amount of bytes that are sent from that transaction within the application. | | | | | | | | |
| Max | The maximum amount of bytes that are sent from that transaction within the application. | | | | | | | | |
| Total | The total amount of bytes that are sent from that transaction within the application. | | | | | | | | |
| Graph Metrics | Min | The minimum value for the corresponding parameter for the chosen time frame. | | | | | | | |
| Max | The maximum value of the corresponding parameter in the chosen time frame. | | | | | | | | |
| 95th Percentile | The 95th percentile of the value of the corresponding parameter within the chosen time frame. | | | | | | | | |
| Average | The averaged value for the corresponding parameter for chosen time frame. | | | | | | | | |
| Requests per minute | The number of requests served per minute for the chosen time frame. | | | | | | | | |
| Apdex Score | The Application Performance Index (APDEX) score of the particular transaction. | | | | | | | | |
| Total Requests | The overall number of requests (transactions) made at the application level, including both successful and erroneous requests. | | | | | | | | |
| Average Response Time | The value of response time for a transaction. | | | | | | | | |
| Exceptions | |||||||||
| Fatal | The number of exceptions at the transaction level with a severity level classified as 'Fatal.' These exceptions indicate critical issues that can severely impact the transaction's functionality. | | | | | | | | |
| Warning | This indicates the number of exceptions at the transaction level with a severity level classified as 'Warning.' These exceptions highlight potential issues or non-fatal errors that may require attention but do not result in a complete transaction failure. | | | | | | | | |
| Table Metrics - (Recent 5 Traces/Slow Traces of this Transaction) | Request Time | The time in which communication happened for the Trace | | | | | | | |
| Avg. Response Time (Response Time) | The time taken by the trace to complete its execution (in sec). | | | | | | | | |
| CPU Time | The amount of time taken by the CPU to respond (in ms). | | | | | | | | |
| External Calls | The total number of external calls made by the trace. | | | | | | | | |
| Exceptions (Exception Count) | The number of exceptions that occurred within a specific period at the transaction level. Exceptions = Fatal Exception + Warning Exception Where,
| | | | | | | | |
| SQL Time | The minimum amount of time taken for the trace to respond within the application (in ms). | | | | | | | | |
| Distributed Calls (Distributed Calls Count) | The total number of external calls made by the trace in various applications. | | | | | | | | |
| Raw Table Data Metrics | Collection Time | The time taken to collect the transaction. | | | | | | | |
| Apdex Score | The Application Performance Index (APDEX) score of the particular transaction. | | | | | | | | |
| Avg. Response Time | The average value of the time taken for the transaction to respond within the application (in sec). | | | | | | | | |
| Requests - Total Count | The total number of transactions that are running in the application. | | | | | | | | |
| Errors | Count of requests (transactions) that resulted in response codes falling within the range of 400 to 599 during the collected time at the transaction level. | | | | | | | | |
In addition to the above metrics, you can also view all the transaction details and represent them as graphs based on:
| Graph Name | Agent / Supported Application | ||||||
|---|---|---|---|---|---|---|---|
| Java | .NET | .NET Core | Node.js | PHP | Ruby | Python | |
| Response time broken by Components | | | | | | | |
| Request Throughput | | | | | | | |
| Data Throughput | | | | | | | |
| App Server Components Split Up | | | | | | | |
| Split up by Exception | | | | | | | |
| Split up by Error | | | | | | | |
| Response time and Throughput broken by Components (Will be available only for background transactions.) | | | | | | | |
Note:
You can switch between the graphical or tabular representation of the transaction page using the Graph View and Table View buttons available at the top of the page.
Traces
The Tracing feature will provide you with insight into individual transactions that are running within your application. Transaction Traces are snapshots of transactions to help you identify performance bottlenecks by drilling down the transactions to pinpoint the cause of trouble.
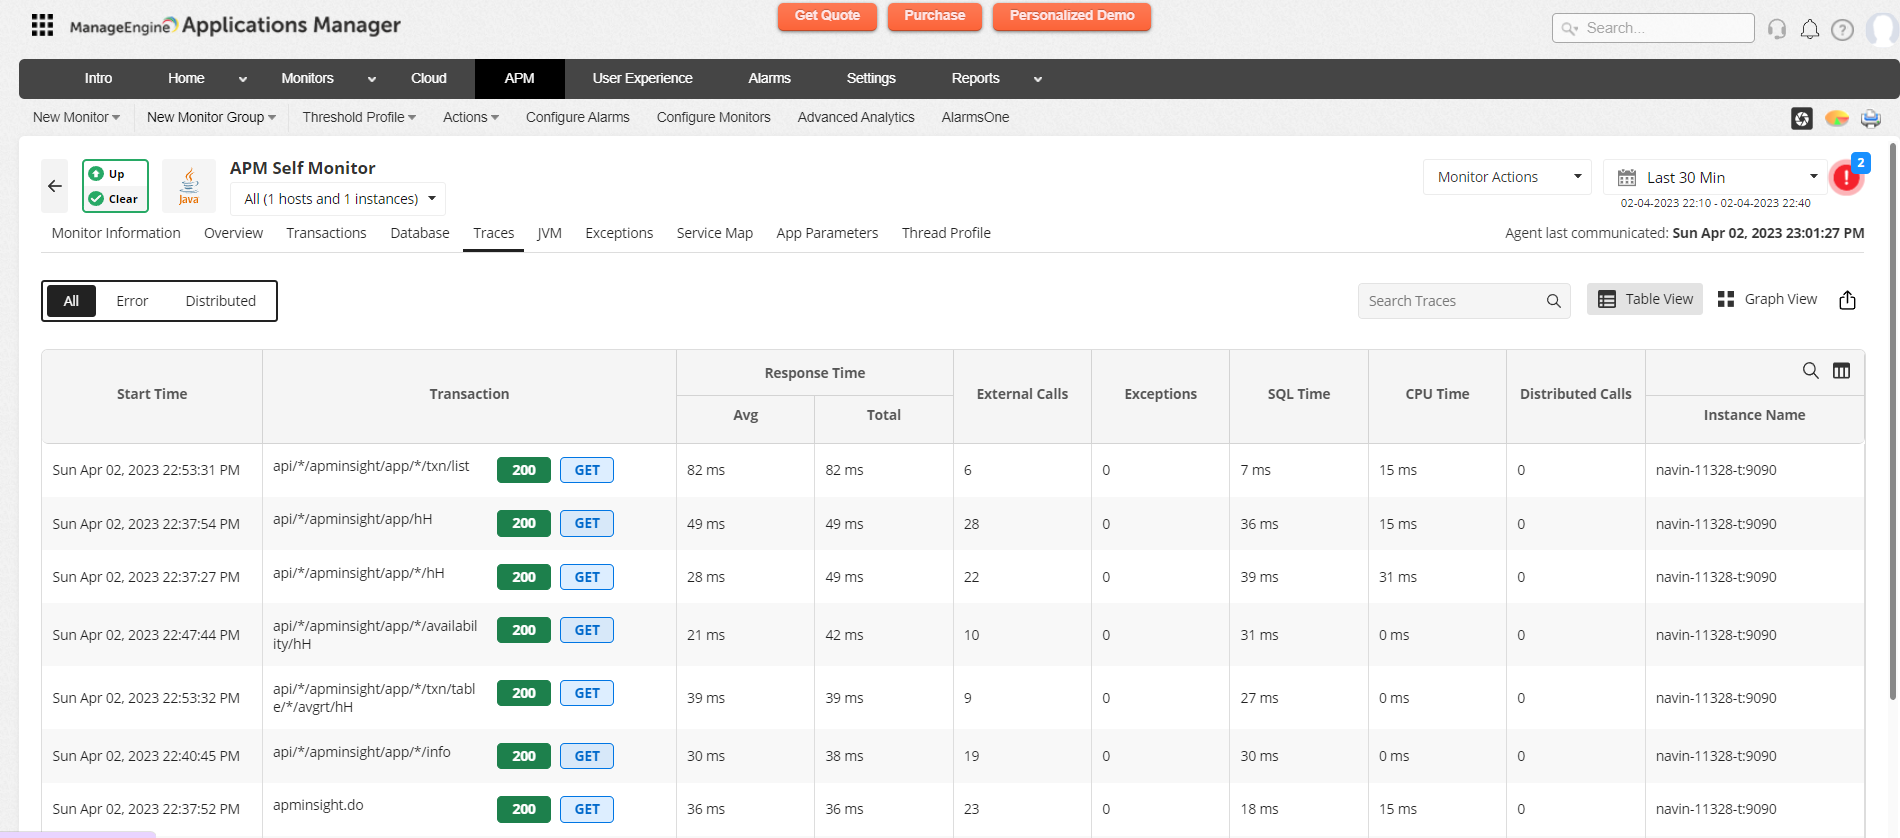
Based on the options configured in the web client file, the SQL statements executed within the transaction and its stack trace are collected and displayed in the tree view. Also, you can view various transactions that are running as Error Traces and Distributed Traces.
| Tab Name | Agent / Supported Application | ||||||
|---|---|---|---|---|---|---|---|
| Java | .NET | .NET Core | Node.js | PHP | Ruby | Python | |
| All Traces | | | | | | | |
| Error Traces | | | | | | | |
| Distributed Traces | | | | | | | |
Below are the metrics shown in the Traces tab:
| Attribute | Description | Agent / Supported Application | ||||||
|---|---|---|---|---|---|---|---|---|
| Java | .NET | .NET Core | Node.js | PHP | Ruby | Python | ||
| Start Time | Detailed date and time at which the trace was started. | | | | | | | |
| Transaction | Name of the transaction on which the trace was launched along with the request type and response code. | | | | | | | |
| CPU Time | The amount of time taken by the CPU to respond (in ms). | | | | | | | |
| Avg. Response Time | Average amount of time taken by the trace when run multiple times (in ms/sec). | | | | | | | |
| Total Response Time | The total time taken by the trace to complete its execution (in ms/sec). | | | | | | | |
| SQL Time | The minimum amount of time taken for the trace to respond within the application (in sec). | | | | | | | |
| External calls | The total number of external calls made by the trace. | | | | | | | |
| Exception Count | The count of exceptions that occurred within a specific timeframe at the traces level. Exceptions = Fatal Exception + Warning Exception Where,
| | | | | | | |
| Bytes In | The total number of bytes requested. | | | | | | | |
| Bytes Out | The total number of bytes responded. | | | | | | | |
| Memory Used | Total amount of memory used by the trace. | | | | | | | |
| Method Count | Total number of method calls executed by the trace. | | | | | | | |
| Distributed Calls (Distributed calls Count) | Total number of external calls made by the trace in various applications. | | | | | | | |
| Instance name | Name of the Instance. | | | | | | | |
By clicking on individual transactions, you get a detailed view of the performance of executions for the selected transaction trace along with the list of internal invocations that were performed within the transaction. Following is the list of metrics that are monitored in this view:
Summary
| Attribute | Description | Agent / Supported Application | ||||||
|---|---|---|---|---|---|---|---|---|
| Java | .NET | .NET Core | Node.js | PHP | Ruby | Python | ||
| HTTP Response code | Response code | | | | | | | |
| HTTP Method | HTTP Method | | | | | | | |
| Total calls | The Total Number of method calls and the total number of external calls executed by the trace. | | | | | | | |
| Thread Name | The name of the thread which executes the trace. | | | | | | | |
| Thread ID | Identifier of the thread which executes the trace. | | | | | | | |
| DB Queries (No.of DB Queries) | The Number of Database Queries Executed by the trace. | | | | | | | |
| Slowest Method calls and count - Slowest Method call | The names of all the components traced with the slowest being shown first. | | | | | | | |
| Slowest Method calls and count - Count | The number of times a component is called. | | | | | | | |
| Slowest Method calls and count - Duration | The time duration the component took to executed out of the total time that the trace took to execute. | | | | | | | |
| Slowest Method calls and count - Percentage | Percentage value of the duration the component took to execute. | | | | | | | |
| Total External calls count - External call | The name of all the external call components. | | | | | | | |
| Total External calls count - Total Time | The Total time taken for the external call execution. | | | | | | | |
| Total External calls count - Count | The number of times the external component is called. | | | | | | | |
| Request Parameters | The Query String passed in the trace. | | | | | | | |
| Request Headers | The HTTP header used to provide information on the HTTP request. | | | | | | | |
Following is the list of graphs shown under this tab:
| Graph Name | Agent / Supported Application | ||||||
|---|---|---|---|---|---|---|---|
| Java | .NET | .NET Core | Node.js | PHP | Ruby | Python | |
| Slowest Method calls | | | | | | | |
| External calls | | | | | | | |
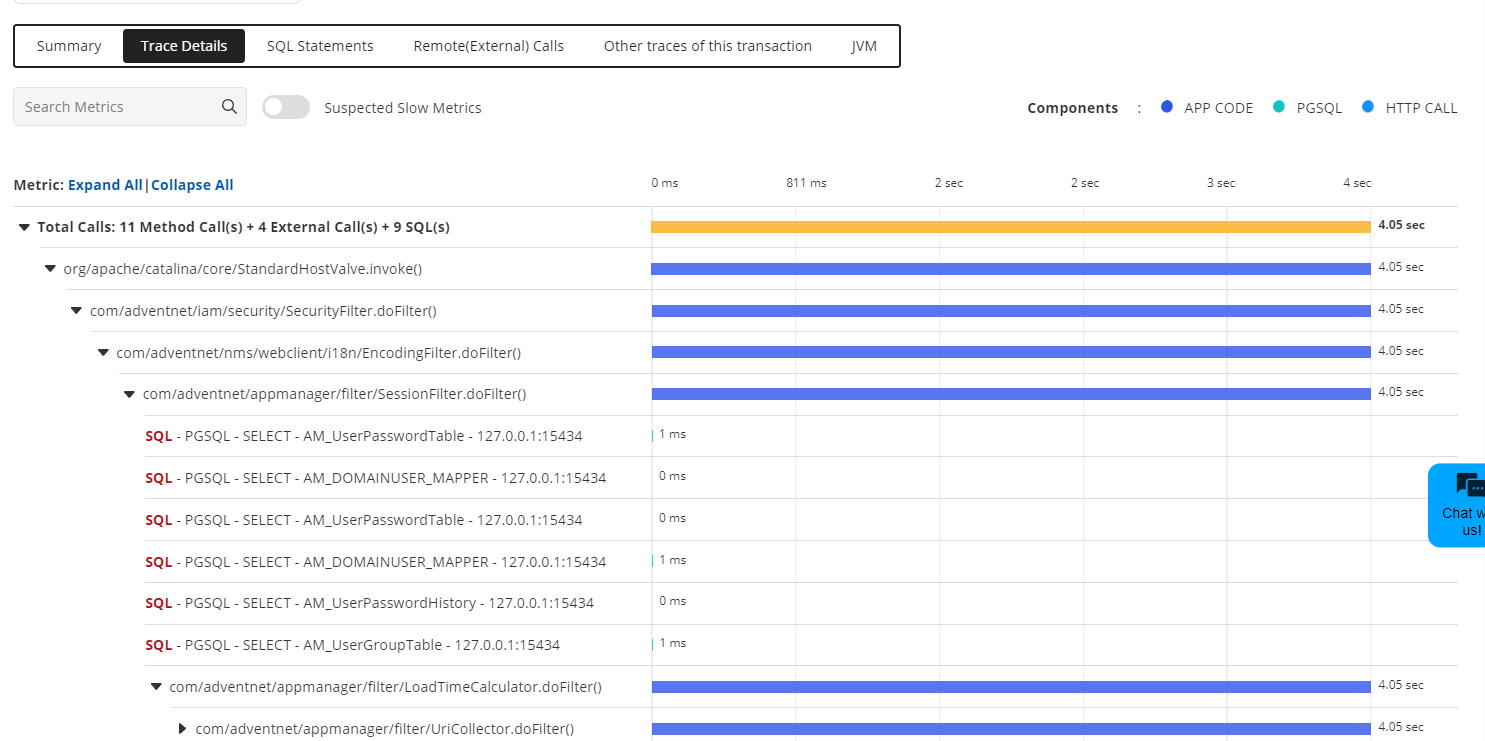
Trace Details
APM Insight version 16440 includes a Trace Details tab that displays all running methods and their durations in seconds. Users may use the supported search option to filter out specific metrics and methods for further analysis. It also supports a toggle button for suspected slow metrics that helps improve overall performance by identifying the methods that are executed slowly.
Tree View: (Available in versions 16430 and below)
| Attribute | Description | Agent / Supported Application | ||||||
|---|---|---|---|---|---|---|---|---|
| Java | .NET | .NET Core | Node.js | PHP | Ruby | Python | ||
| Delay Time | The difference between the time taken for the method call and the current method call. | | | | | | | |
| Exclusive | The time taken to execute a particular method. | | | | | | | |
| Total | The time taken to complete a command and all its sub commands. | | | | | | | |
| Metric | Name of all the action performed by the trace. | | | | | | | |
Components View: (Available in versions 16430 and below)
| Graph Name | Agent / Supported Application | ||||||
|---|---|---|---|---|---|---|---|
| Java | .NET | .NET Core | Node.js | PHP | Ruby | Python | |
| Components View | | | | | | | |
SQL Statements
| Attribute | Description | Agent / Supported Application | ||||||
|---|---|---|---|---|---|---|---|---|
| Java | .NET | .NET Core | Node.js | PHP | Ruby | Python | ||
| Start Time (Timestamp) | The time when the SQL query was executed by the trace (in ms). | | | | | | | |
| Total Time (Execution Time) | The total time for the execution of a particular method (in ms). | | | | | | | |
| Query | Query which is executed. | | | | | | | |
| No.Of Queries | The total number of queries executed. | | | | | | | |
Remote (External) Calls
| Attribute | Description | Agent / Supported Application | ||||||
|---|---|---|---|---|---|---|---|---|
| Java | .NET | .NET Core | Node.js | PHP | Ruby | Python | ||
| External calls | The name of all the external calls executed. | | | | | | | |
| Count | The number of times the external component is called. | | | | | | | |
| Execution time | The total time for the execution of an external call (in sec). | | | | | | | |
Exceptions
| Attribute | Description | Agent / Supported Application | ||||||
|---|---|---|---|---|---|---|---|---|
| Java | .NET | .NET Core | Node.js | PHP | Ruby | Python | ||
| Time | The time at which the Exception occurred. | | | | | | | |
| Severity | Level of exception | | | | | | | |
| Message | Error message when an exception occurs. | | | | | | | |
| Exception class | Class name of the exception | | | | | | | |
| Stack Trace (Available in versions 16430 and below) | Stack Trace of the exception | | | | | | | |
Note: In version 16440 and above, Stack Trace will be available under the Exception Class Attribute dropdown.
Other traces of this transaction
| Attribute | Description | Agent / Supported Application | ||||||
|---|---|---|---|---|---|---|---|---|
| Java | .NET | .NET Core | Node.js | PHP | Ruby | Python | ||
| Minimum | The minimum value of the corresponding parameter for a chosen time frame. | | | | | | | |
| Maximum | The maximum value of the corresponding parameter in the chosen time frame. | | | | | | | |
| Average | The averaged value for the corresponding parameter for the chosen time frame. | | | | | | | |
| 95th Percentile | The 95th percentile of the value of the corresponding parameter within the chosen time frame. | | | | | | | |
Following is the list of graphs shown under this tab:
| Graph Name | Agent / Supported Application | ||||||
|---|---|---|---|---|---|---|---|
| Java | .NET | .NET Core | Node.js | PHP | Ruby | Python | |
| Transaction Response time and Throughput | | | | | | | |
JVM
Following is the list of graphs shown under this tab:
| Graph Name | Agent / Supported Application | ||||||
|---|---|---|---|---|---|---|---|
| Java | .NET | .NET Core | Node.js | PHP | Ruby | Python | |
| JVM CPU Usage | | | | | | | |
| JVM Classes Count | | | | | | | |
| Non Heap Memory | | | | | | | |
| Heap Memory | | | | | | | |
Database
With APM Insight's Database feature, you can get detailed performance metrics to identify the slow database calls, database usage, and overall performance of the database furnished with detailed graphical and tabular representations. By clicking on an individual database operation, you will be able to view a list of web transactions that were performed by that particular operation, thereby allowing you to narrow down and isolate the root cause of the performance slowdown.
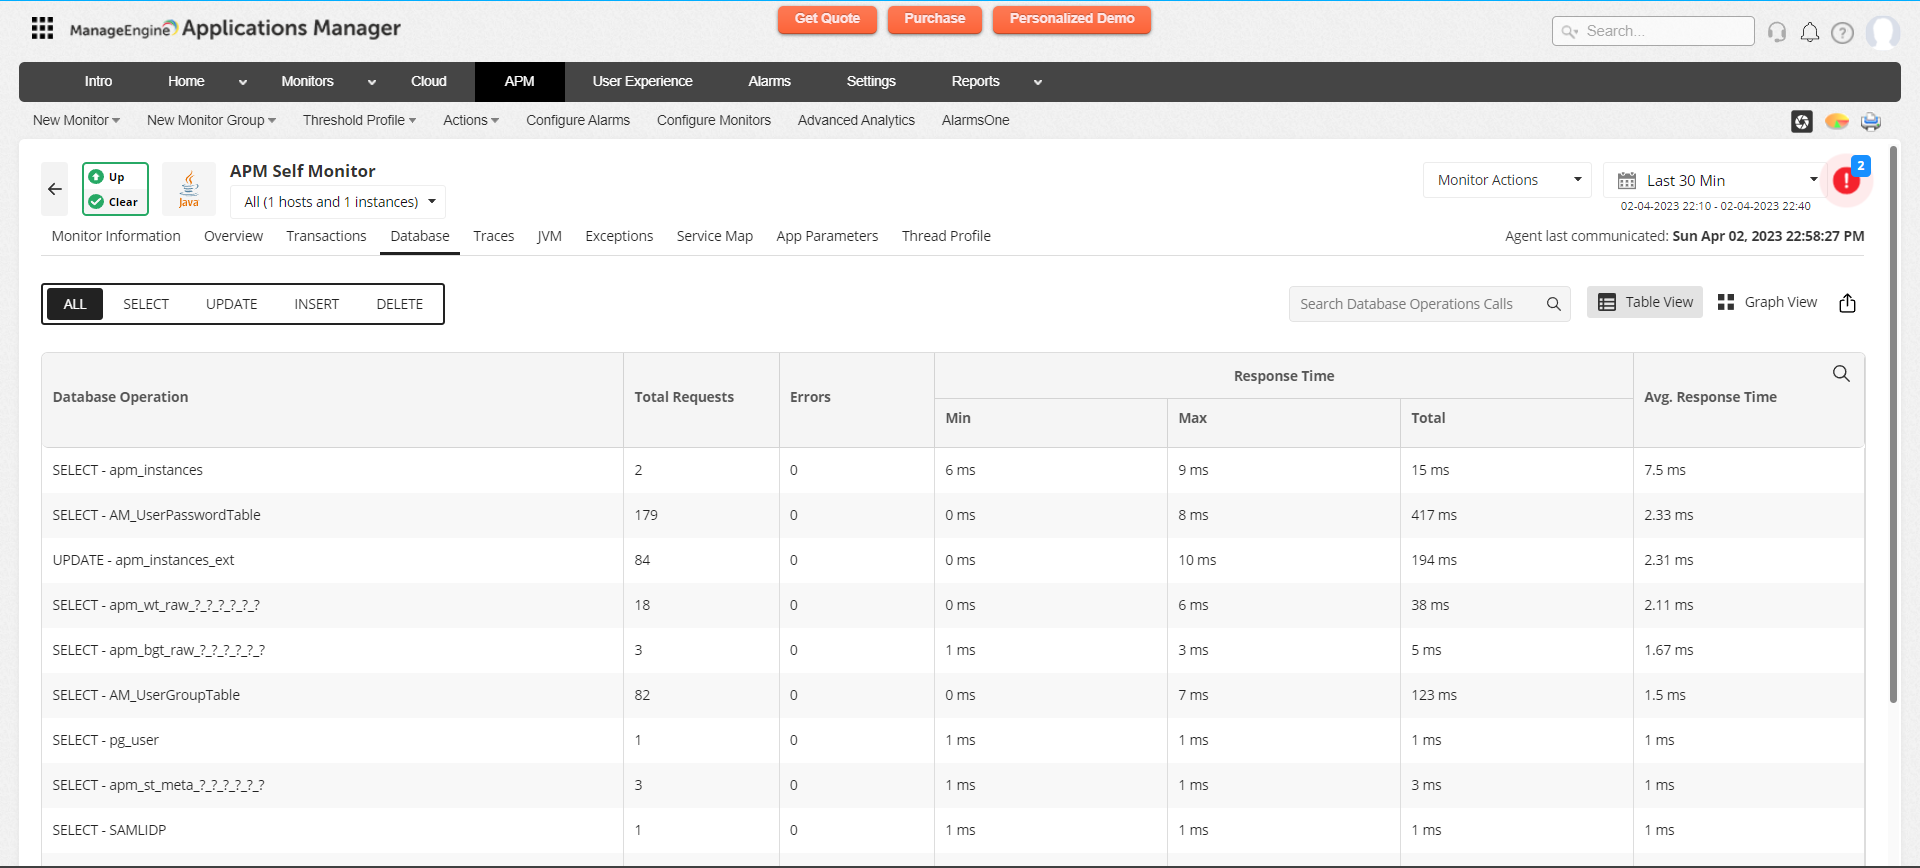
Below are the metrics shown in the Database tab:
Table View:
| Attribute | Description | Agent / Supported Application | ||||||
|---|---|---|---|---|---|---|---|---|
| Java | .NET | .NET Core | Node.js | PHP | Ruby | Python | ||
| Database Operation | The name of the database operation. | | | | | | | |
| Total Requests (Count) | The total number of times the database operation has run in the application. | | | | | | | |
| Errors (%) | These metrics measure the percentage of errors in relation to the total number of database operations conducted at the database operation level within a specific timeframe. Errors(%) = (Error Count/ Total request Count) * 100 Where,
| | | | | | | |
| Avg. Response Time | The average value of the time taken for the database operation to respond within the application. | | | | | | | |
| Min. Response Time | The minimum amount of time taken for the database operation to respond within the application. | | | | | | | |
| Max. Response Time | The maximum amount of time taken for the database operation to respond within the application. | | | | | | | |
| Total Response Time | The total amount of time taken for the database operation to respond within the application. | | | | | | | |
Graph View:
| Attribute | Description | Agent / Supported Application | ||||||
|---|---|---|---|---|---|---|---|---|
| Java | .NET | .NET Core | Node.js | PHP | Ruby | Python | ||
| Average Response Time (Response Time) | The response time of a transaction (in ms). | | | | | | | |
| Errors(%) | The proportion of errors with respect to the total number of requests made within a specific period at the application/transaction level. Calculated as Errors(%) = (Error Count/ Total request Count) * 100 Where,
| | | | | | | |
| Graph Metrics | ||||||||
| Min | The minimum value for the corresponding parameter for the chosen time frame. | | | | | | | |
| Max | The maximum value of the corresponding parameter in the chosen time frame. | | | | | | | |
| 95th Percentile | The 95th percentile of the value of the corresponding parameter within the chosen time frame. | | | | | | | |
| Top 5 Traces in DB | ||||||||
| Transaction | The name of the transaction occurring within the database. | | | | | | | |
| SQL Time | The amount of time taken for the SQL query to execute. | | | | | | | |
| Requests | ||||||||
| Per minute (Throughput) | The number of requests served per minute for the chosen time frame (cpm) . | | | | | | | |
| Total Count (Available from version 16440) | The total number of requests made during in transaction. | | | | | | | |
In addition to the above metrics, you can also view all the database operations and represent them as graphs based on:
| Graph Name | Agent / Supported Application | ||||||
|---|---|---|---|---|---|---|---|
| Java | .NET | .NET Core | Node.js | PHP | Ruby | Python | |
| Overall Database Response Time and Throughput | | | | | | | |
| Response Time | | | | | | | |
| Database Throughput by Operation | | | | | | | |
| Database Operation by caller | | | | | | | |
| Database Operation by Response Time | | | | | | | |
| Database Operation Throughput | | | | | | | |
JVM
Applications Manager's APM Insight aids you in monitoring your Java application by monitoring your application code that is running on your JVM. The JVM tab helps you monitor key metrics that are crucial for your Java applications and provides deep insight by visualizing the performance and representing them in tabular and graphical representations, allowing admins to gain visibility into how various resources and system parameters impact the Java application performance.
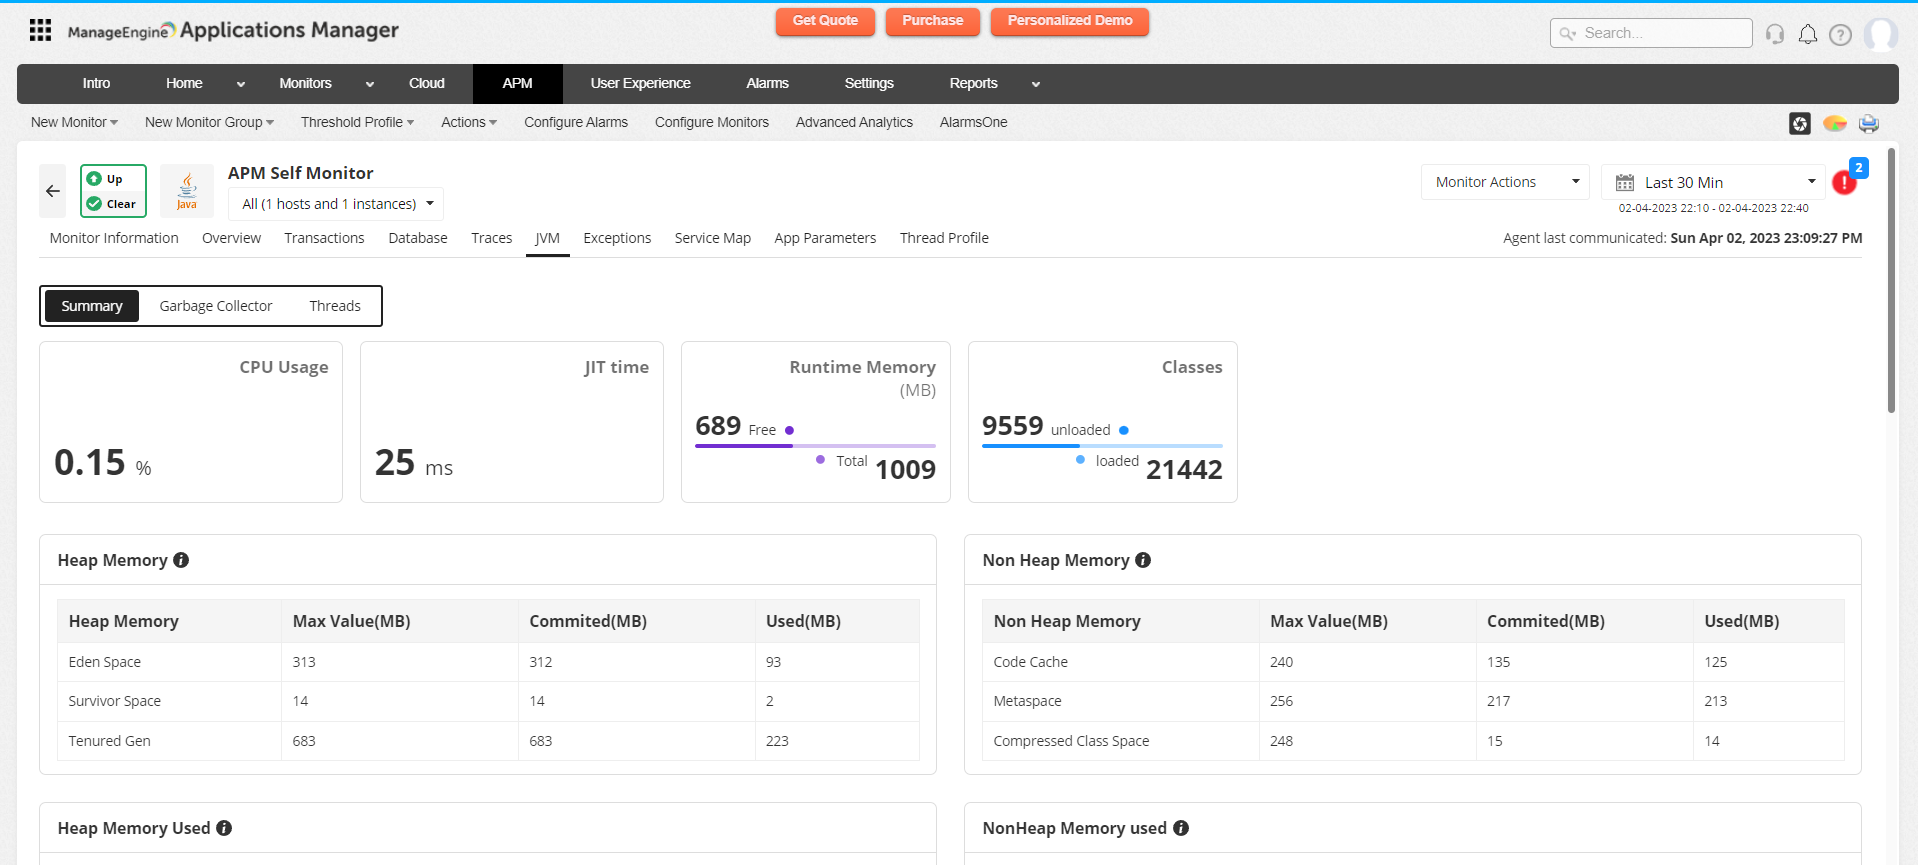
Below are the metrics shown in the JVM tab:
Summary
| Attribute | Description | Agent / Supported Application | ||||||
|---|---|---|---|---|---|---|---|---|
| Java | .NET | .NET Core | Node.js | PHP | Ruby | Python | ||
| JVM CPU Usage | This indicates the CPU usage of the JVM on the server. | | | | | | | |
| Runtime Memory | The total memory reserved by the Java virtual machine. | | | | | | | |
| Heap Memory |
| | | | | | | |
| Non-Heap Memory |
| | | | | | | |
| Just In Time Compiler | The time taken by the just-in-time compiler to optimize the classes loaded onto the JVM. | | | | | | | |
| JVM Classes Count |
| | | | | | | |
Garbage Collector - PS Scavenge & PS MarkSweep
| Attribute | Description | Agent / Supported Application | ||||||
|---|---|---|---|---|---|---|---|---|
| Java | .NET | .NET Core | Node.js | PHP | Ruby | Python | ||
| Time Spent | Approximate time since the JVM started (sec/ms). | | | | | | | |
| Collection Count | The total collection count since the JVM started. | | | | | | | |
Following is the list of graphs shown under this tab:
| Graph Name | Description | Agent / Supported Application | ||||||
|---|---|---|---|---|---|---|---|---|
| Java | .NET | .NET Core | Node.js | PHP | Ruby | Python | ||
| PS Marksweep- The total amount of garbage collection completed by the PS MarkSweep garbage collector on the 'Old Generation' memory. | ||||||||
| Time Spent Collecting Objects- Instance Split Up | Time spent collecting objects for each instance. | | | | | | | |
| Collected Objects Count- Instance Split Up | Collected objects count for each instance. | | | | | | | |
| PS Scavenge- The total amount of garbage collection completed by the PS Scavenge garbage collector on the Eden and Survivor components of the 'Young Generation' memory. | ||||||||
| Time Spent Collecting Objects- Instance Split Up | Time spent collecting objects for each instance. | | | | | | | |
| Collected Objects Count- Instance Split Up | Collected objects count for each instance. | | | | | | | |
Threads
| Attribute | Description | Agent / Supported Application | ||||||
|---|---|---|---|---|---|---|---|---|
| Java | .NET | .NET Core | Node.js | PHP | Ruby | Python | ||
| Collection Time | The timestamp at which the current thread count was recorded. | | | | | | | |
| Peak Threads | Peak live thread count since the Java virtual machine started or peak was reset. | | | | | | | |
| Live Threads | Number of live threads currently running. | | | | | | | |
| Daemon Threads | Number of daemon threads currently running. | | | | | | | |
| Deadlock Threads | Number of threads that are in deadlock waiting to acquire object monitors. | | | | | | | |
Following is the list of graphs shown under this tab:
| Graph Name | Agent / Supported Application | ||||||
|---|---|---|---|---|---|---|---|
| Java | .NET | .NET Core | Node.js | PHP | Ruby | Python | |
| Threads | | | | | | | |
| Aggregated CPU and User Time of all Threads | | | | | | | |
Configuration
| Attribute | Description | Agent / Supported Application | ||||||
|---|---|---|---|---|---|---|---|---|
| Java | .NET | .NET Core | Node.js | PHP | Ruby | Python | ||
| Up Time | The total available time of the instance. | | | | | | | |
| Processor Count | The total number of processors available. | | | | | | | |
| Total Threads | The total number of threads taken by the Instance. | | | | | | | |
| Total classes | The total no. of classes used by the Instance. | | | | | | | |
| General | ||||||||
| JVM Name | Specifies the Java virtual machine name. | | | | | | | |
| JVM Version | The Version of JVM which is currently being used by the Application. | | | | | | | |
| Java Arguments | The input arguments passed to the Java virtual machine, that are not included to the main method. | | | | | | | |
| Class Version | The version of Java class that is used by the system class loader to search for class files. | | | | | | | |
| Classpath | The Java class path that is used by the system class loader to search for class files. | | | | | | | |
| Library Path | The Java library path. | | | | | | | |
| Boot Classpath | The boot class path that is used by the bootstrap class loader to search for class files. | | | | | | | |
| Host | ||||||||
| OS | The name of the operating system. | | | | | | | |
| OS Arch | The operating system architecture. | | | | | | | |
| OS Version | The Version of Operating System | | | | | | | |
| Memory | ||||||||
| Heap Initial | The amount of heap that the Java virtual machine initially requests from the operating system in MB. | | | | | | | |
| Heap Maximum | Maximum amount of heap that can be used for memory management in MB. This amount of memory is not guaranteed to be available if it is greater than the amount of committed memory. The Java virtual machine may fail to allocate memory even if the amount of used memory does not exceed this maximum size. | | | | | | | |
| Non-Heap Initial | The amount of non-heap memory that the Java virtual machine initially requests from the operating system in MB. | | | | | | | |
| Non-Heap Maximium | Maximum amount of non-heap memory that can be used for memory management in MB. This amount of memory is not guaranteed to be available if it is greater than the amount of committed memory. The Java virtual machine may fail to allocate memory even if the amount of used memory does not exceed this maximum size. | | | | | | | |
| Up Time | The Uptime of the JVM. | | | | | | | |
| Processor Count | The number of processors available for the JVM. | | | | | | | |
| Total Threads | The total number of threads started by the JVM. | | | | | | | |
| Total classes | The total number of classes loaded into the JVM. | | | | | | | |
Exceptions
Applications Manager's APM Insight eases your monitoring needs by providing detailed insights into various exceptions that are occurring within the application. The Exceptions tab helps you identify different types of exceptions and errors that are hindering the performance of your applications with detailed graphical and tabular representations.
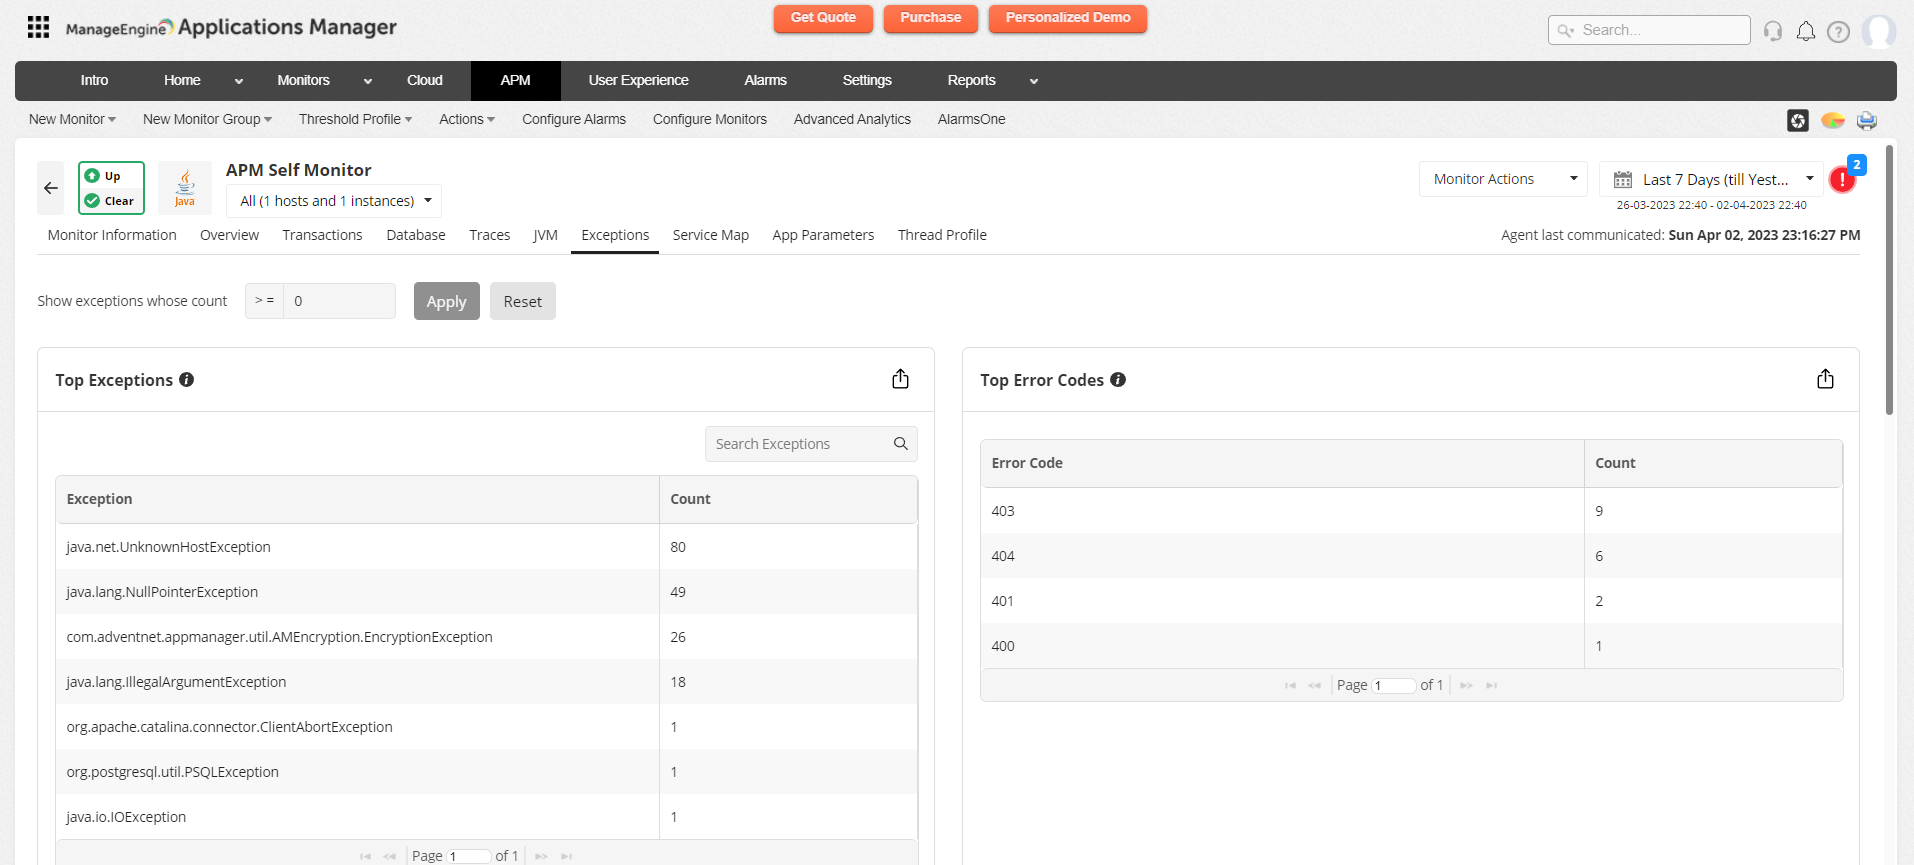
Below are the metrics shown in the Exceptions tab:
| Attribute | Description | Agent / Supported Application | ||||||
|---|---|---|---|---|---|---|---|---|
| Java | .NET | .NET Core | Node.js | PHP | Ruby | Python | ||
| Top Exceptions | ||||||||
| Exception | The name of the exception that has occurred in the application. | | | | | | | |
| Count | The number of times that exception has occurred in the application. | | | | | | | |
| Top Error Codes | ||||||||
| Error Code | The error code that has occurred in the application. | | | | | | | |
| Count | The number of times that error code has occurred in the application. | | | | | | | |
| Recent 5 Exception Traces | ||||||||
| Transaction Name | The name of the transaction where the exception has occurred. | | | | | | | |
| Exception Count | This metric reflects the count of exceptions that occurred within a specific timeframe at the exceptions level, providing a detailed perspective on exception occurrences. Exceptions = Fatal Exception + Warning Exception Where,
| | | | | | | |
| Recent 5 Error Transactions traces (Recent 5 Error Transactions) | ||||||||
| Transaction Name | The name of the transaction where the error code has occurred. | | | | | | | |
| Error Count | The number of requests (transactions) at the application level that has returned with a response code like 400 to 599. | | | | | | | |
In addition to the above metrics, you can also view all the various exceptions occurring within the application and represent them as graphs based on:
| Graph Name | Agent / Supported Application | ||||||
|---|---|---|---|---|---|---|---|
| Java | .NET | .NET Core | Node.js | PHP | Ruby | Python | |
| Transaction Split up by Exception | | | | | | | |
| Transaction Split up by Error Code | | | | | | | |
| Exception Count | | | | | | | |
| Error Count | | | | | | | |
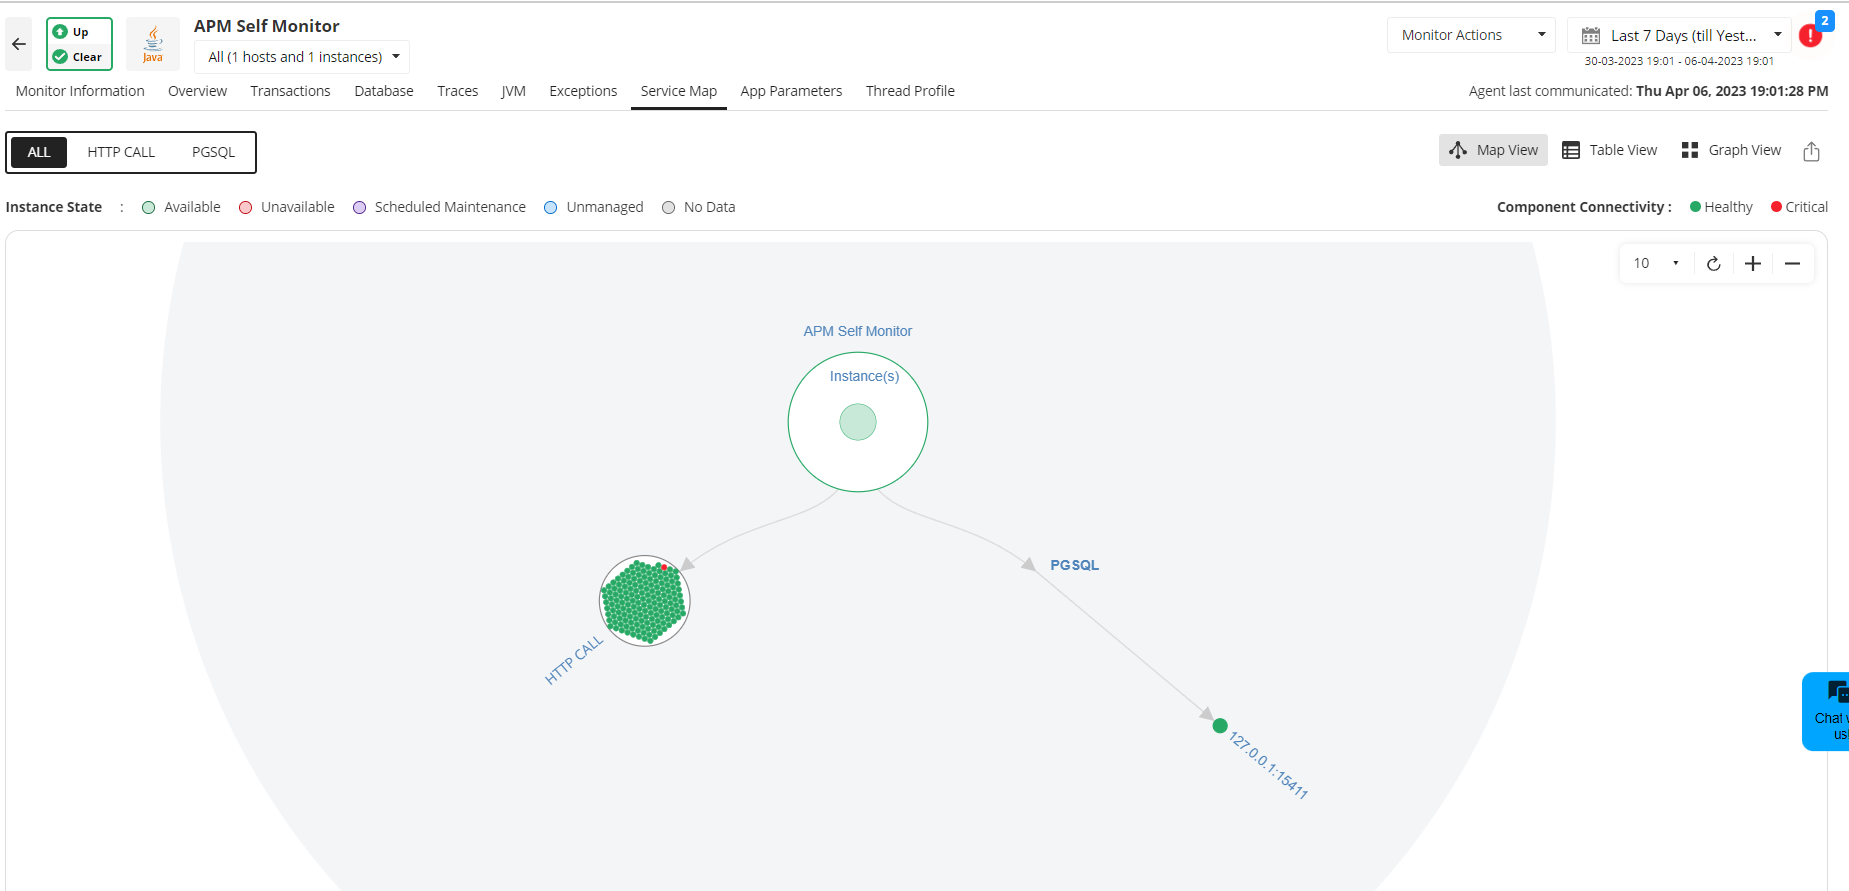
Service Map
The Service Map tab provides a topological view of all the components in the application. The external calls are mapped and categorized into colour coded instance states based on availability, management, etc, for deeper insight.
Following are the metrics monitored under 'Service Map' tab.
| Attribute | Description | Agent / Supported Application | ||||||
|---|---|---|---|---|---|---|---|---|
| Java | .NET | .NET Core | Node.js | PHP | Ruby | Python | ||
| Component | Monitored applications dependent resources | | | | | | | |
| Host | Monitored applications dependent resource host | | | | | | | |
| Avg. Response Time | The average response time of the individual component or host. | | | | | | | |
| Failed Requests | The number of failed request count by the Individual component or host to the application | | | | | | | |
| Total Requests | The total number of requests made by the Individual component or host to the application | | | | | | | |
| Request Throughput | The number of requests served per minute for the chosen time frame. | | | | | | | |
Following is the list of graphs shown under this tab:
| Graph Name | Agent / Supported Application | ||||||
|---|---|---|---|---|---|---|---|
| Java | .NET | .NET Core | Node.js | PHP | Ruby | Python | |
| Average Response Time | | | | | | | |
| Total Response Time | | | | | | | |
| Throughput | | | | | | | |
| Request Count | | | | | | | |
| Count | | | | | | | |
| Rate | | | | | | | |
App Parameters
The App Parameters tab helps monitor the crucial operations involved with each parameter such as Sum and Average.
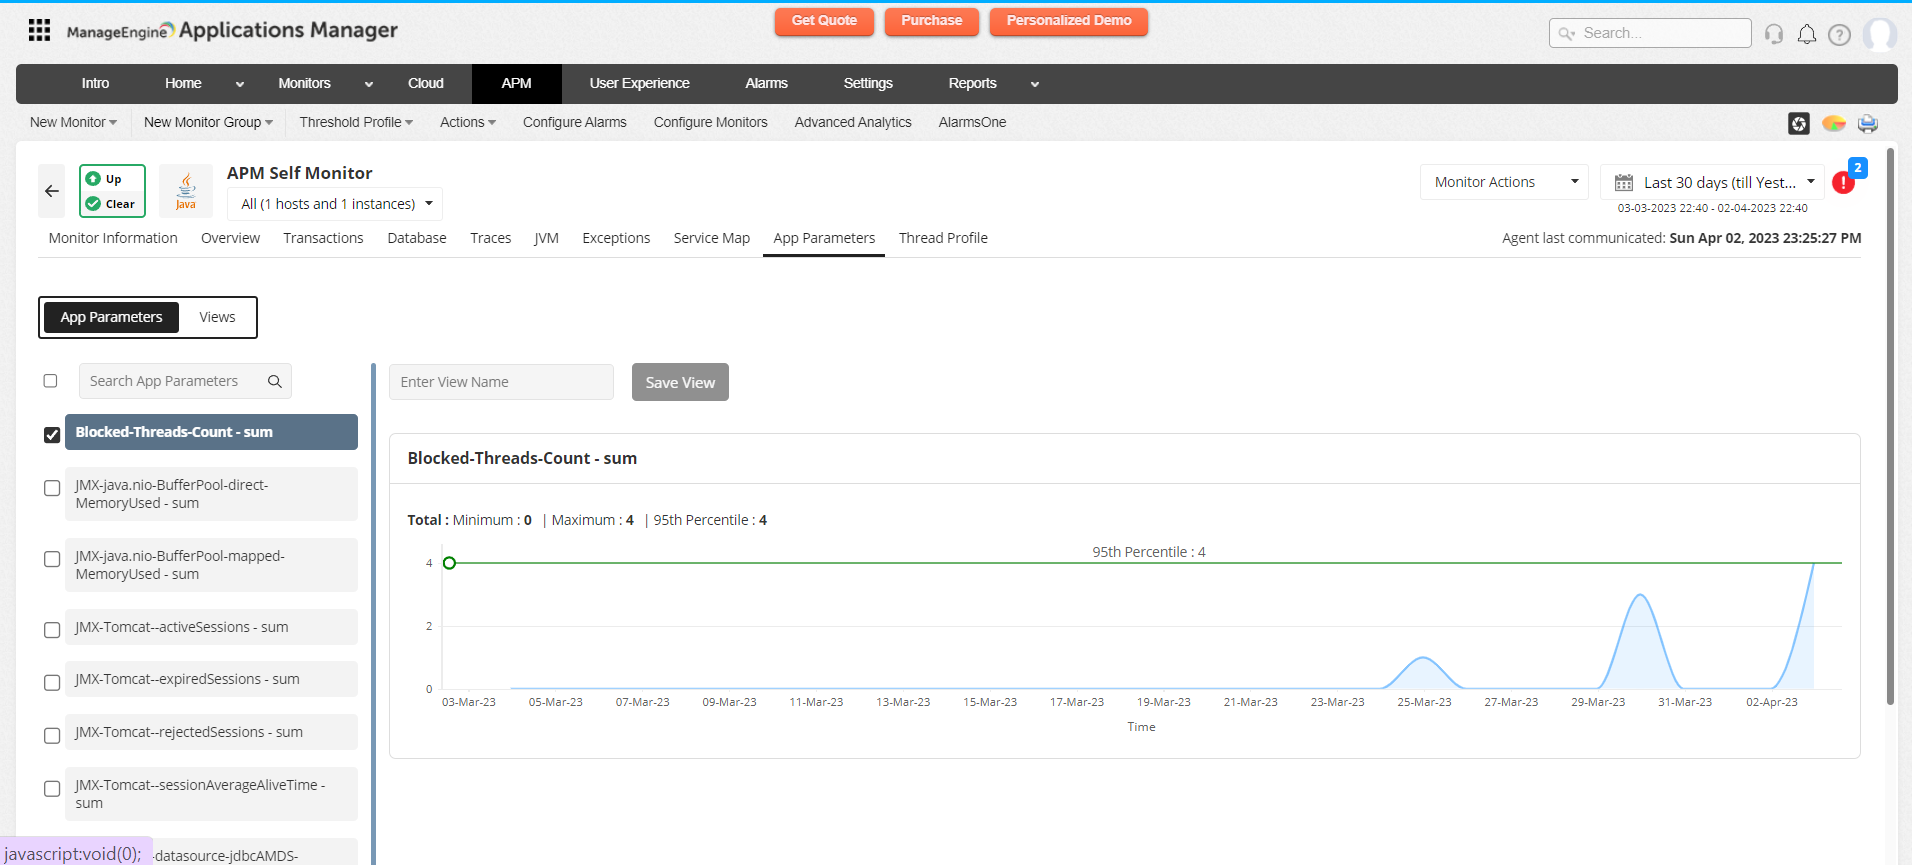
Following are the metrics monitored under the 'App Parameters' tab.
| Category | Attribute | Description | Agent / Supported Application | ||||||
|---|---|---|---|---|---|---|---|---|---|
| Java | .NET | .NET Core | Node.js | PHP | Ruby | Python | |||
| Sum | Parameter Name | The parameter name provided by the user in the application | | | | | | | |
| Min | The minimum aggregated value for the corresponding parameter on a particular interval. | | | | | | | | |
| Max | The maximum aggregated value for the corresponding parameter on a particular interval. | | | | | | | | |
| 95th Percentile | The 95th percentile of the value of the corresponding parameter within the chosen time frame. | | | | | | | | |
| Total | The aggregated value for the corresponding parameter on a particular interval | | | | | | | | |
| Average | Parameter Name | The parameter name provided by the user in the application | | | | | | | |
| Min | The minimum value for the corresponding parameter on a particular interval. | | | | | | | | |
| Max | The maximum value of the corresponding parameter in a particular interval | | | | | | | | |
| 95th Percentile | The 95th percentile of the value of the corresponding parameter within the chosen time frame. | | | | | | | | |
| Average | The averaged value for the corresponding parameter on a particular interval | | | | | | | | |
Thread Profile
The Thread Profile tab displays all the available thread profiles of all the threads running in the application. Each profile includes data on important metrics such as thread count, CPU time, Memory, etc.
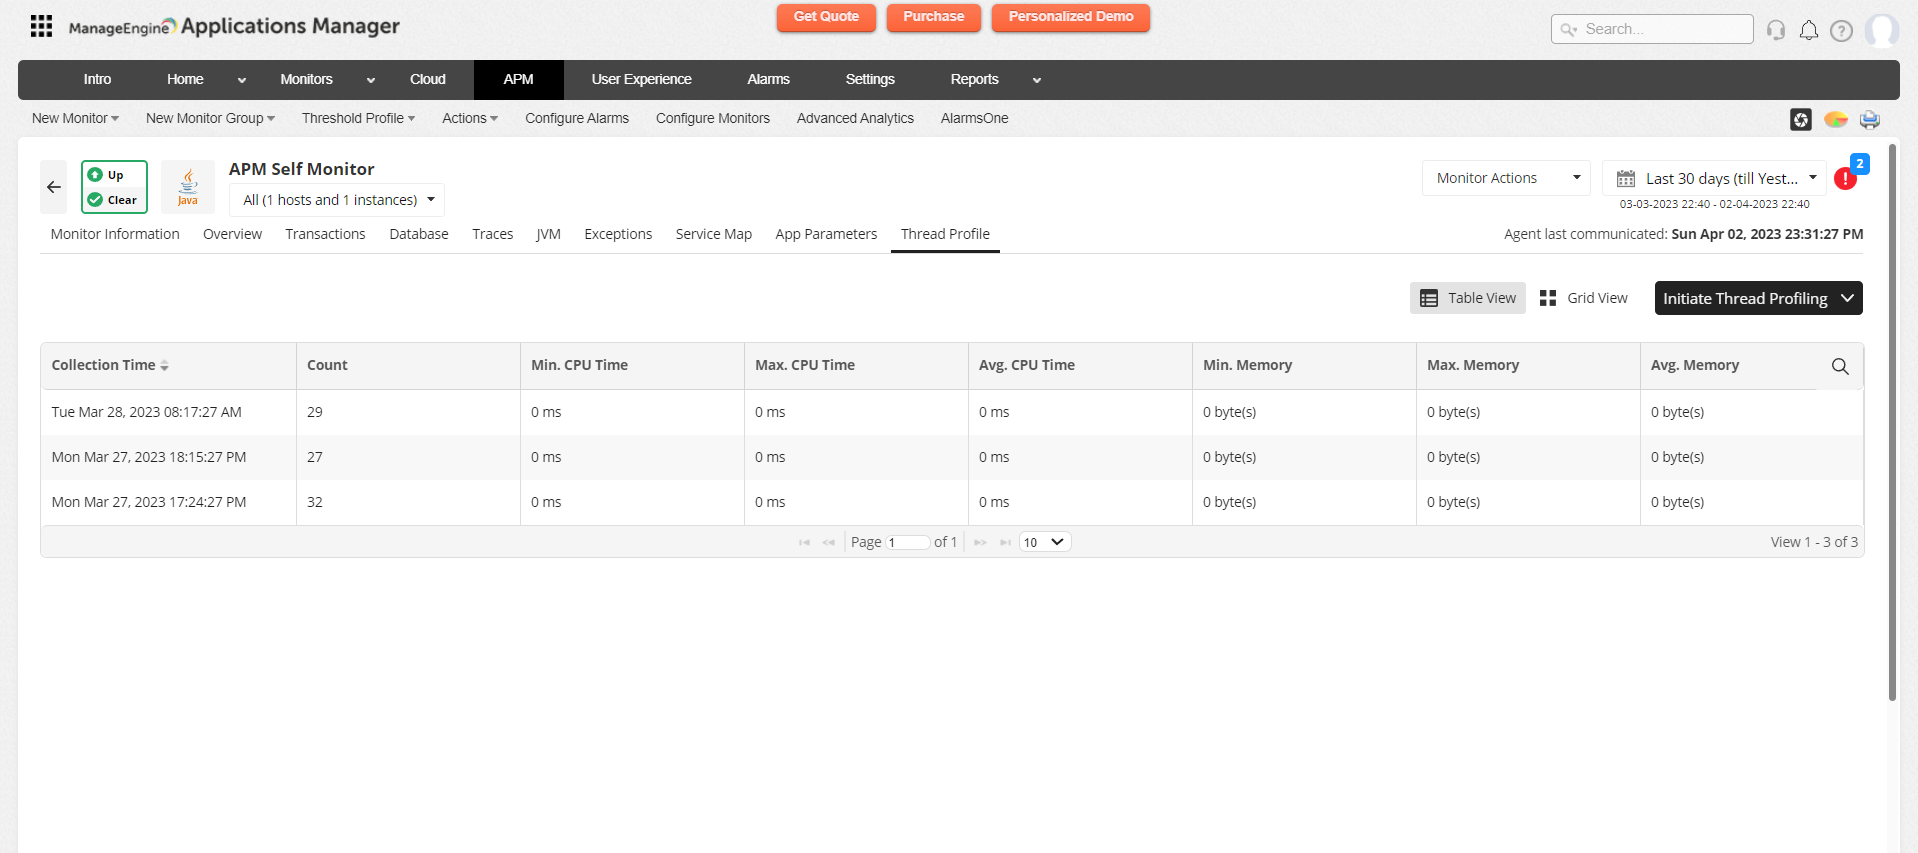
Following are the metrics monitored under 'Thread Profile' tab.
| Category | Attribute | Description | Agent / Supported Application | ||||||
|---|---|---|---|---|---|---|---|---|---|
| Java | .NET | .NET Core | Node.js | PHP | Ruby | Python | |||
| Thread profiles | Collection Time | The time in which the demanded thread profiling collection takes place. | | | | | | | |
| Thread Count | The number of simultaneous requests handled by the application in a demanded duration | | | | | | | | |
| Min. CPU Time | The minimum amount of time taken by CPU to execute application threads in a demanded duration | | | | | | | | |
| Max CPU Time | The maximum amount of time taken by CPU to execute application threads in a demanded duration | | | | | | | | |
| Avg. CPU Time | The average amount of time taken by CPU to execute application threads in a demanded duration | | | | | | | | |
| Min. Memory | The minimum amount of memory allocated for application threads in a demanded duration (in MB). | | | | | | | | |
| Max. Memory | The maximum amount of memory allocated for application threads in a demanded duration (in MB). | | | | | | | | |
| Avg. Memory | The average amount of memory allocated for application threads in a demanded duration (in MB). | | | | | | | | |
| Thread Dump | Thread Id | Identifier of a thread which should be high CPU consuming thread | | | | | | | |
| Method | High CPU consuming method for selected thread | | | | | | | | |
| CPU Time | The amount of time taken by the CPU to execute the selected thread | | | | | | | | |
| Memory Allocated | The amount of memory allocated for selected threads (in MB). | | | | | | | | |
| Count | The method execution count for selected thread | | | | | | | | |
| Thread Name | Name of the Thread | | | | | | | | |
| Stacktrace | Stacktrace for the particular thread | | | | | | | | |
| Dump list | Collection Time | The time in which the demanded thread profiling collection takes place. | | | | | | | |
| Instance Name | The instance in which the dump is collected. | | | | | | | | |
| Runnable | The number of threads that are in runnable state. | | | | | | | | |
| Blocked | The number of threads that are in blocked state. | | | | | | | | |
| Waiting | The number of threads that are in waiting state. | | | | | | | | |
| Timed Waiting | The number of threads that are in TIMED_WAITING state when it's waiting for another thread to perform a particular action within a stipulated amount of time. | | | | | | | | |
Note:
To view reports on the metrics for the APM Insight monitor, click on Reports from the main tab and then select Trend Analysis Report from the list at the left. The following report types are displayed:
- At a glance Report
- Downtime History
- Summary Report of Monitor
Data Cleanup & Collection Configurations
Data clean-up options and Data collection limits can be set by navigating to Settings -> Performance Polling -> APM Insight.
Following are the clean-up parameters for which the retention period can be set:
| Parameter | Description | Maximum Limit |
|---|---|---|
| Raw Data Retention Period | The number of days for which raw performance data for APM Insight monitors will be retained before clean-up. | 60 days |
| Traces Retention Period | The number of days for which traces data for APM Insight monitors will be retained before clean up. | 60 days |
Following are the parameters for which data logging and storage configurations can be set:
| Parameter | Description | Allowed Values |
|---|---|---|
| Traces Storage Location | Specifies where to store the trace data for analysis and troubleshooting. Path should have read and write access. Default Traces Storage Location: <AppManager_Home>/working/apminsight/traces | |
| Logging Level | Set the level of detail in log messages, balancing performance and troubleshooting needs. FINE or INFO level will be reverted to WARNING after 30 mins to avoid the performance slowness. | SEVERE, WARNING, INFO, FINE |
Note: Cleanup schedule Details: Data cleanup happens during every restart of Applications Manager, and subsequently every Sunday at 00:00 hours.
Following are the parameters for which data collection limits can be set:
| Parameter | Description | Allowed Range (Per Application) |
|---|---|---|
| Web Transactions | The maximum number of unique web transactions that can be stored for an application. | 350-2000 |
| Background Transactions | The maximum number of unique background transactions that can be stored for an application. | 300-2000 |
| Exceptions | The maximum number of exceptions that can be stored for an application. | 150-500 |
| Database Operations | The maximum number of database operations that can be stored for an application. | 500-1000 |
| Components | The maximum number of components that can be stored for an application. | 200-400 |
| App Parameters | The maximum number of app parameters that can be stored for an application. | 50-200 |
Following are the options for which auto-scaling can be set:
| Parameter | Description | Allowed Range (Per Application) |
|---|---|---|
| Enable Reuse Resource ID | Allows you to reuse the resource ID of the Auto-unmanaged Docker/cloud APM Insight monitors. | |
| Auto-Unmanaged Instances Retention Period | The Auto-unmanaged APM Insight Instances are retained for a specified period. The default value is 3 days. | 1-15 |
| Auto Unmanage If Instance not communicating more than the specified Time | All the cloud applications will be unmanaged if the instance is not communicating with the Appmanager for the configured time period. | 5-120 |
| Enable auto scaling by default for cloud Monitors | By Default Autoscaling mode will be enabled for all the cloud applications | true/false |
Reference Screenshot:
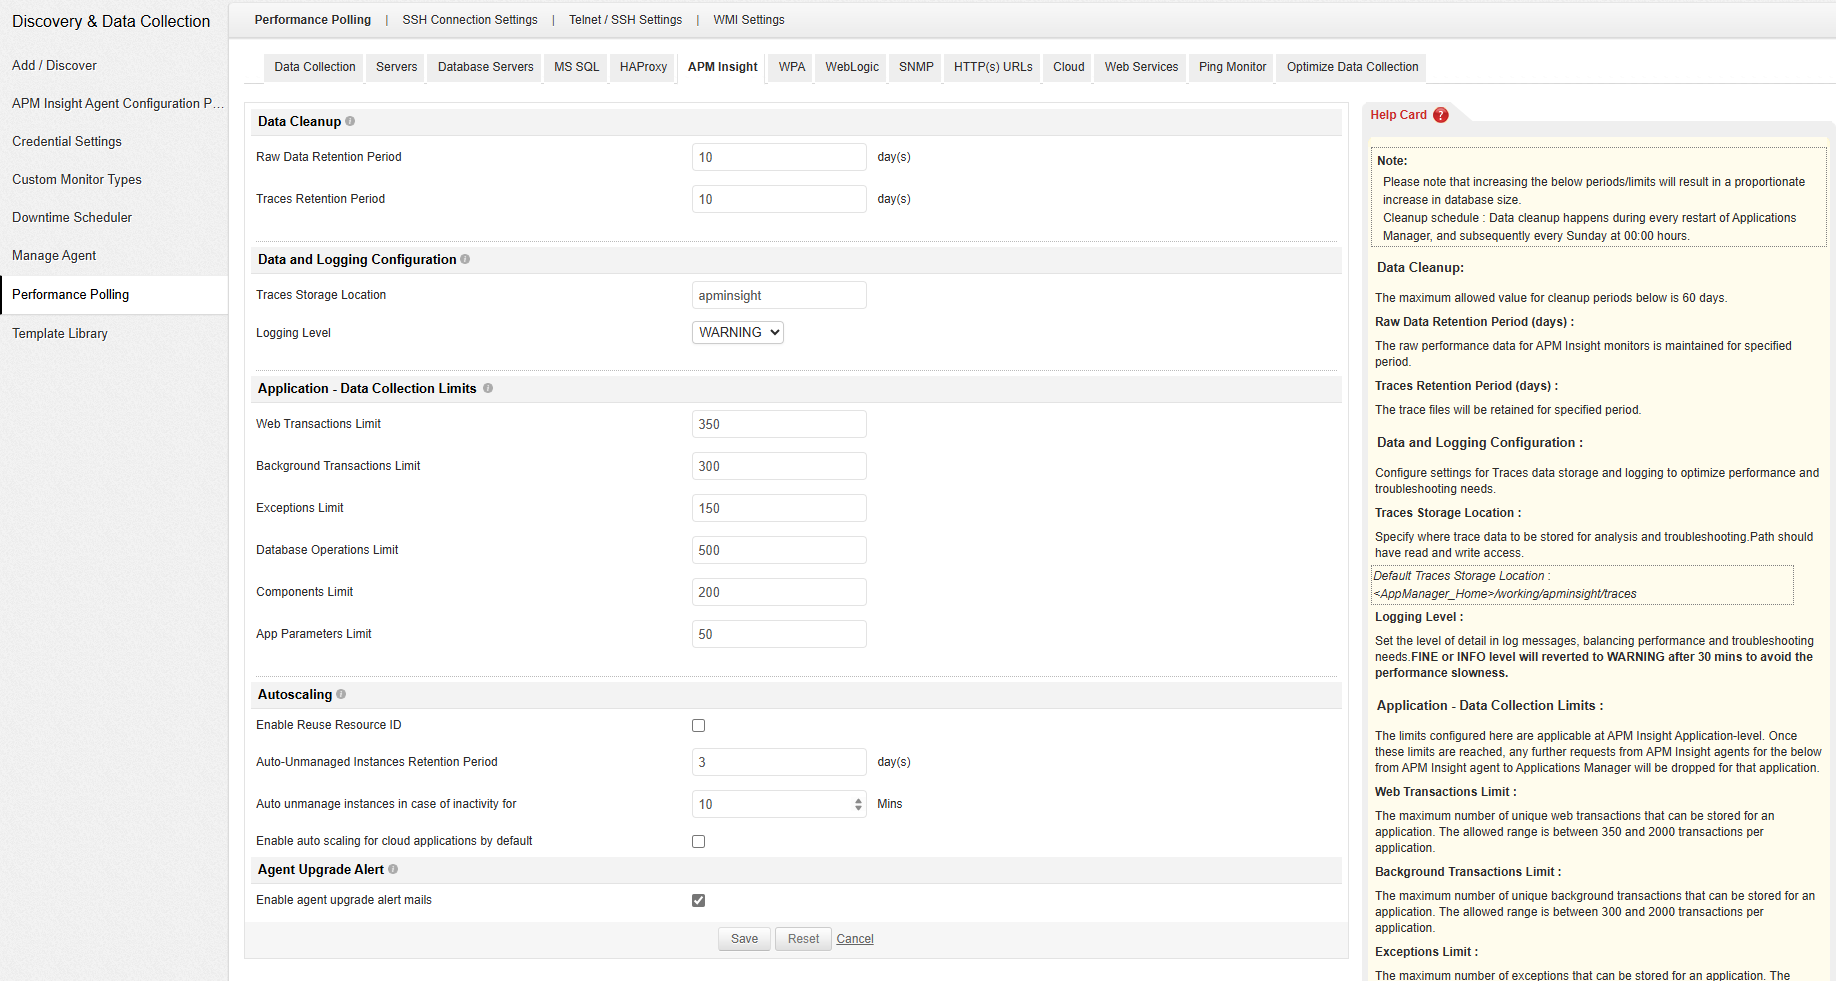
Note: Please note that increasing the above periods/limits will result in a proportionate increase in database size.
