Creating a New Web Application Group
A Web Application Group lets you organize and monitor all the components of a web application, from URLs and transactions to infrastructure and code-level performance, in a single unified view. Instead of creating individual monitors separately, you can provide a primary URL and let Applications Manager automatically discover and associate related monitors.
Once you create a web application group, you can view the health of the sub groups and know how each individual sub group is performing. Using Applications Manager's web application monitoring tool, you can drill down to identify and troubleshoot issues across all tiers of your application.
Creating a web application group
To create a new web application group, follow the steps given below:
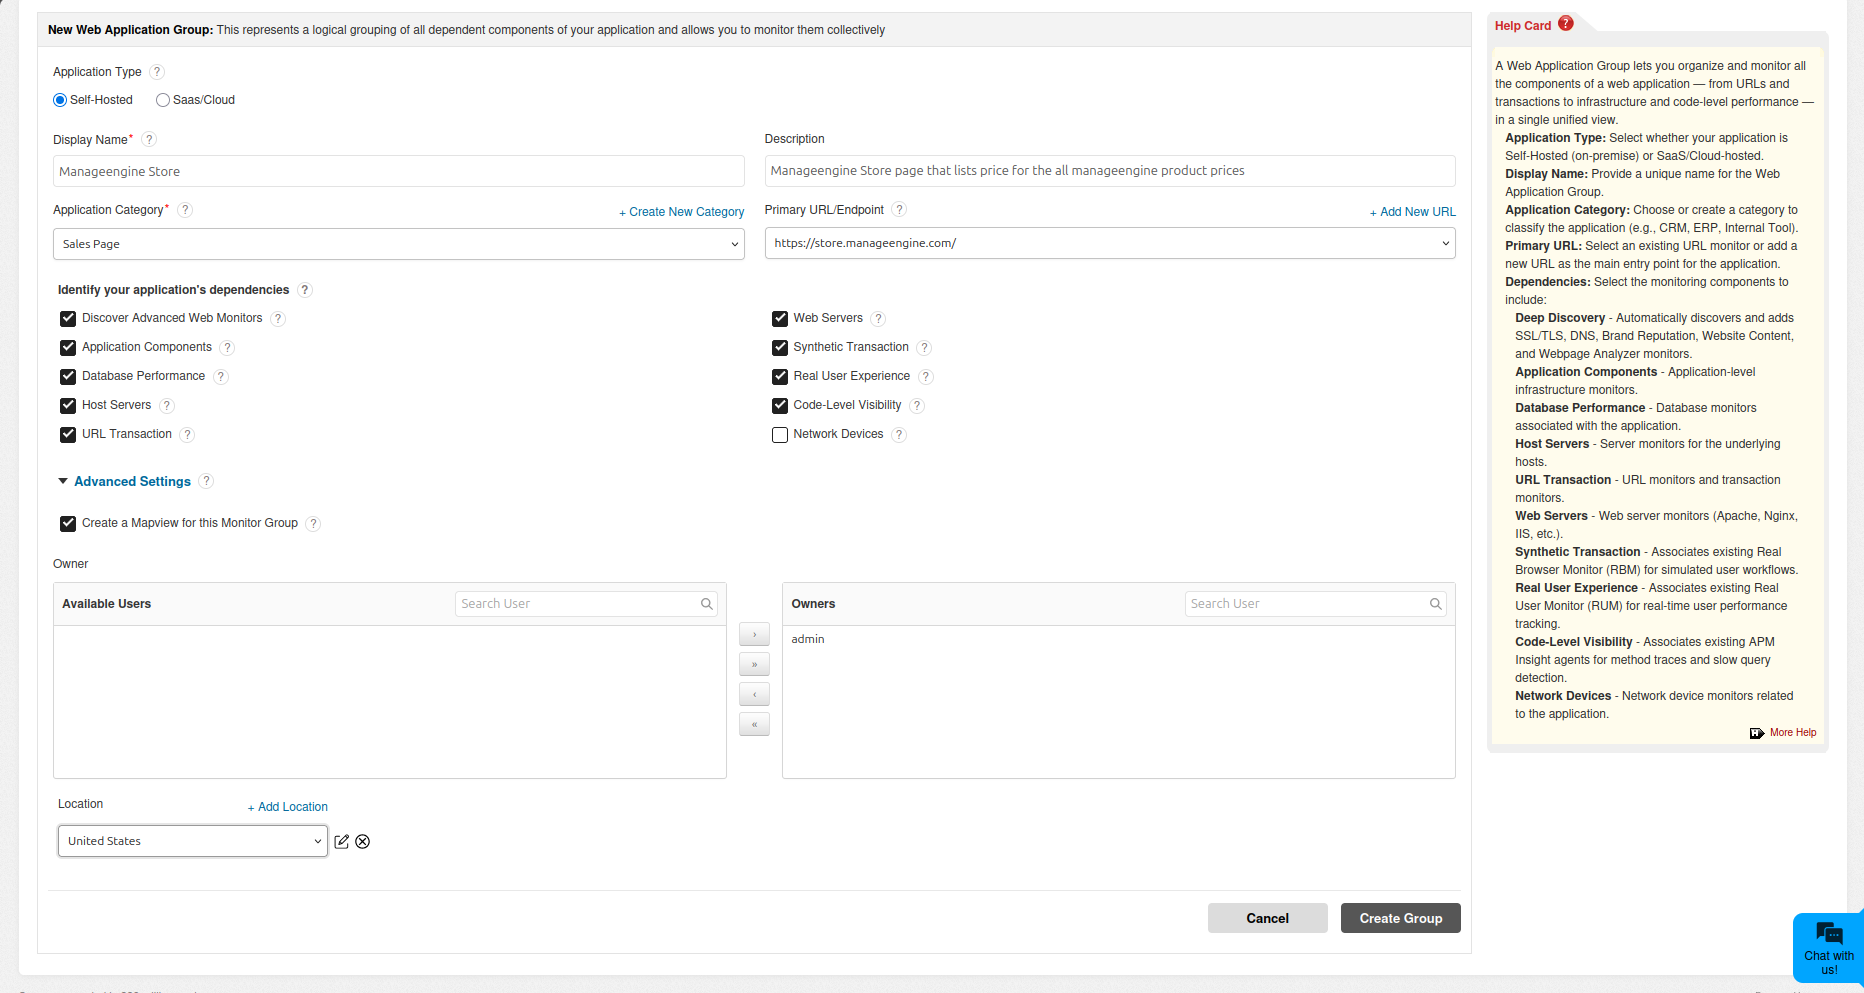
- Click New Monitor Group and select Web Application Group from the drop-down menu.
- Select the Application Type:
- Self-Hosted - Select this if your application is deployed on-premise.
- SaaS/Cloud - Select this if your application is hosted on a cloud or SaaS platform.
- Enter a Display Name for the Web Application Group. This is mandatory and only alphanumeric characters, hyphens (-), underscores (_), periods (.), and spaces ( ) are allowed.
- Provide a Description, if required.
- Select an Application Category from the dropdown to classify the application (e.g., CRM, ERP, Internal Tool). Click + Create New Category to add a custom category if needed.
- Select a Primary URL/Endpoint - Choose an existing URL monitor from the dropdown, or click + Add New URL to enter a new URL. A URL monitor is automatically created from the provided URL and associated to the web application group.
Under Identify your application's dependencies, select the monitoring components to include:
Dependency Description Discover Advanced Web Monitors Automatically discovers and creates SSL/TLS Certificate, DNS, Brand Reputation, Website Content, and Web Page Analyzer monitors based on the primary URL hostname. Application Components (Tomcat, JVM, .NET, etc.) Application-level infrastructure monitors. Database Performance (MS SQL, Oracle, MySQL, etc.) Database monitors associated with the application. Host Servers (Windows, Linux, etc.) Server monitors for the underlying hosts. URL Transaction (Synthetic URL, API, Transaction monitoring) URL monitors and transaction monitors. Web Servers (Apache, Nginx, IIS, etc.) Web server monitors (Apache, Nginx, IIS, etc.). Synthetic Transaction (Method Traces, Slow Queries, etc.) Associates existing Real Browser Monitor (RBM) for simulated user workflow monitoring. If no RBM is found, a promotional banner is shown prompting you to add one. Real User Experience (Browser Metric, user interactions, etc.) Associates existing Real User Monitor (RUM) for real-time user performance tracking. If no RUM is found, a promotional banner is shown prompting you to add one. Code-Level Visibility (Method traces, slow queries, Apdex scores, Transaction tracing) Associates existing APM Insight agent for application-level code monitoring. If no APM Insight agent is found, a promotional banner is shown prompting you to add one. Network Devices (Routers, Switches, Firewalls, etc.) Network device monitors associated with the application. - Click Advanced Settings to expand additional options:
- Select the Owner from the list of users. Refer to the User Management topic for more information on user roles.
- Select the Location for associating the monitor group to World Map Business View. Click Add Location to specify custom locations from the map.
- Click Create Group to create the Web Application Group.
Note:
- When Discover Advanced Web Monitors is enabled, the hostname extracted from the primary URL is used to discover and create SSL/TLS Certificate, DNS, Brand Reputation, Website Content, and Web Page Analyzer monitors. If these monitors already exist for the URL, they are automatically associated to the group. The SSL/TLS Certificate monitor is placed under the Web Servers sub-group, while the remaining monitors are placed under Application Components.
- When Synthetic Transaction, Real User Experience, or Code-Level Visibility is enabled, Applications Manager looks for existing RBM, RUM, or APM Insight monitors matching the primary URL's hostname. If no matching monitors are found, a promotional banner appears in the Web Application Group summary page prompting you to add the corresponding monitor.
Sub groups
When you create a web application group, sub groups are automatically created based on the dependencies you selected. The following sub groups can be created:
- URL Transaction - Contains URL and transaction monitors.
- Web Servers - Contains web server monitors and SSL/TLS Certificate monitors discovered through Discover Advanced Web Monitors.
- Application Components - Contains application server monitors (Tomcat, JVM, .NET, etc.) and monitors discovered through Discover Advanced Web Monitors (DNS, Brand Reputation, Website Content, Web Page Analyzer).
- Database Performance - Contains database monitors.
- Host Servers - Contains server monitors for the underlying hosts.
- Network Devices - Contains network device monitors (Routers, Switches, Firewalls, etc.).
You can also add sub groups manually by following the steps given below:
- Click Monitor Group Actions → New Sub-Group from the Web Application Group details page.
- Provide the Sub-Group Name, Description, and select the Owner from the list of users.
- Select the Group Type from the dropdown.
- Select the Location for associating the sub group.
- Click Create Sub-Group.
- Associate the desired monitors to the sub group.
Note:
- You can create up to six levels of sub groups for a web application group, by default.
- Display name of Web Application Group with Sub-Group is trimmed to 20 characters in the dashboard view. The complete display name can be viewed by hovering over the name.
Promotional banners
When Synthetic Transaction, Real User Experience, or Code-Level Visibility monitoring is enabled for a web application group but the corresponding monitors (RBM, RUM, or APM Insight) are not yet associated, promotional banners appear at the top of the Web Application Group summary page. Each banner includes a Try Now button that redirects you to add the corresponding monitor.
- Skip Now - Dismisses the banner for one day for the current user.
- Close (X) - Dismisses the banner for one month for the current user.
The banners automatically disappear once the corresponding monitor is associated to the Web Application Group or any of its first-level sub groups.
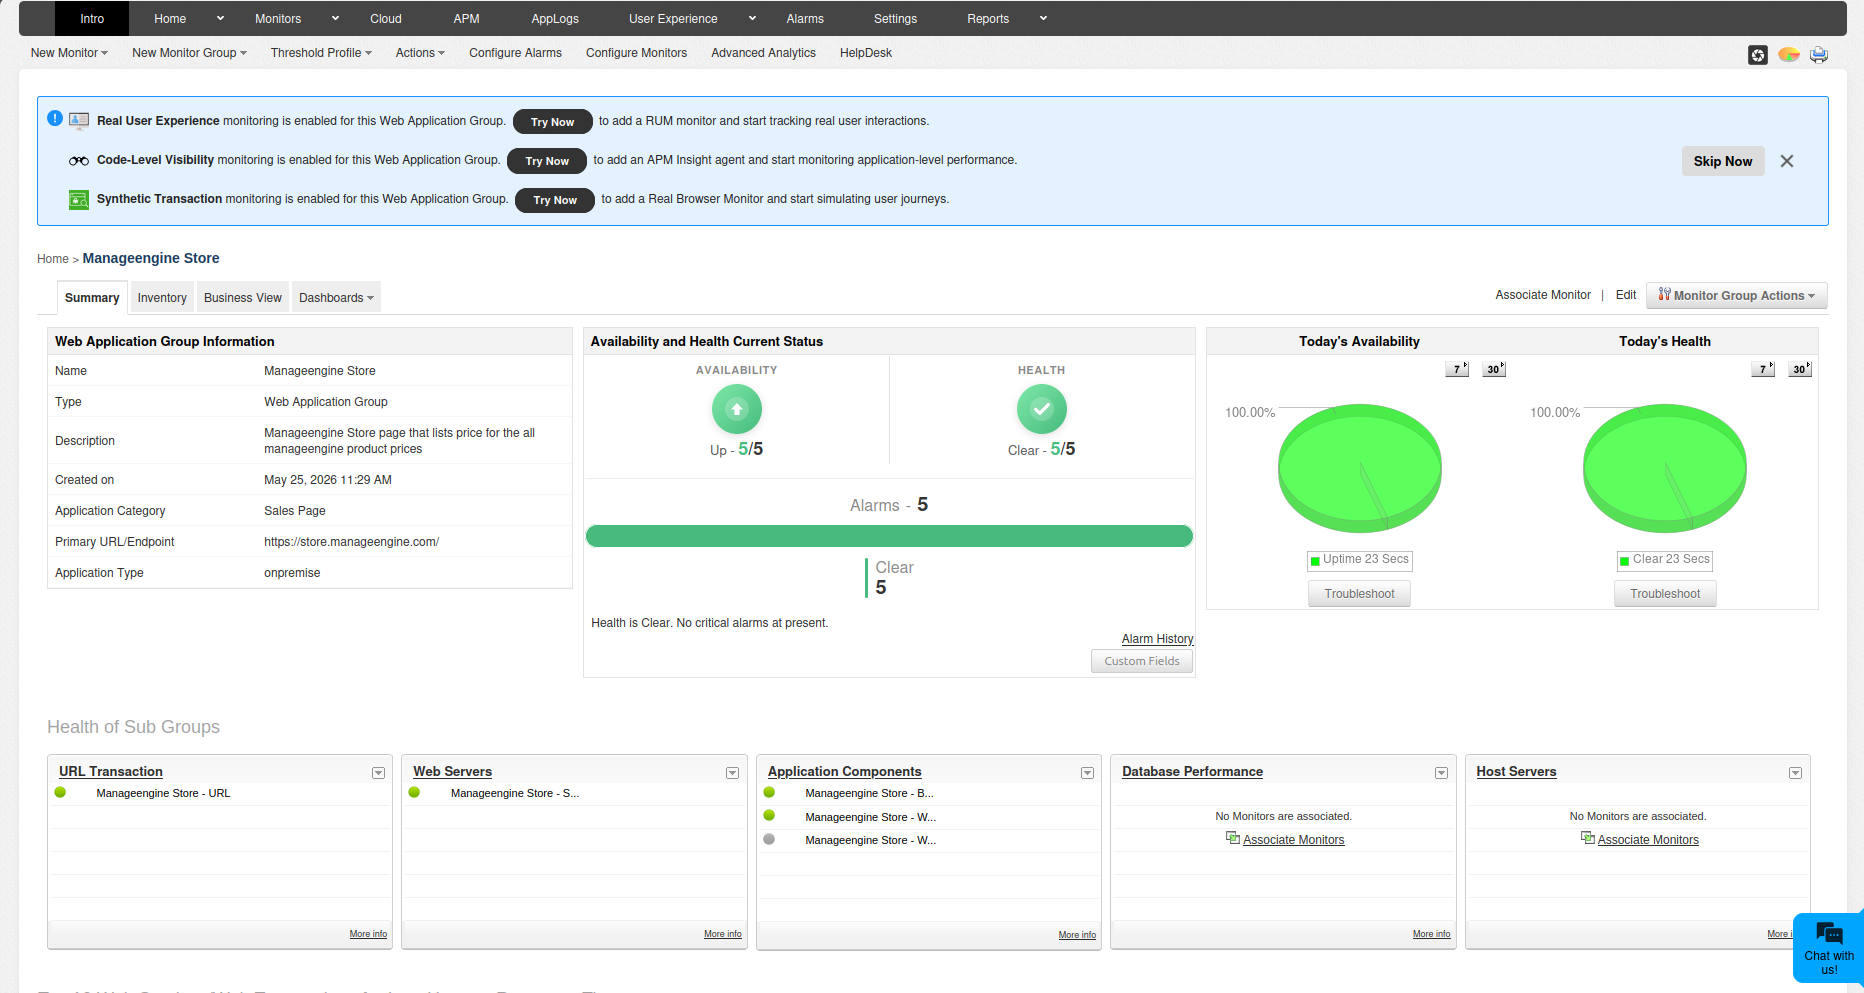
Web Application Group information
Once a web application group is created, the group details page displays a Web Application Group Information panel. This panel provides a summary of the group configuration and includes the following fields:
- Group Type - Indicates whether the group is a Web Application Group or a Monitor Group.
- Description - The description provided during group creation.
- Application Category - The category assigned to the application (e.g., CRM, ERP, Sales Page).
- Primary URL/Endpoint - The primary URL or endpoint associated with the group.
- Application Type - Whether the application is Self-Hosted (on-premise) or SaaS/Cloud.
The group summary page also displays the Availability and Health Current Status, Health of Sub Groups, and Top 10 Web Services/Web Transactions for Last Hour on Response Time charts.