Modern SIEM solutions face three big challenges.
Volume Log volumes typically grow faster than a single server can handle. When capacity runs out, the SIEM solution samples or drops logs—and attacks slip through unseen.
Velocity Logs arrive in unpredictable bursts. When the ingestion pipeline backs up, alerts get delayed and real-time detection becomes retrospective analysis.
Response timeManual response workflows cost minutes or hours per incident. Attackers use that time to move laterally, while false positives consume analyst attention.
Log360 solves these three challenges. It is a unified SIEM platform with horizontal scalability, AI-driven analysis, and a centralized detection console.
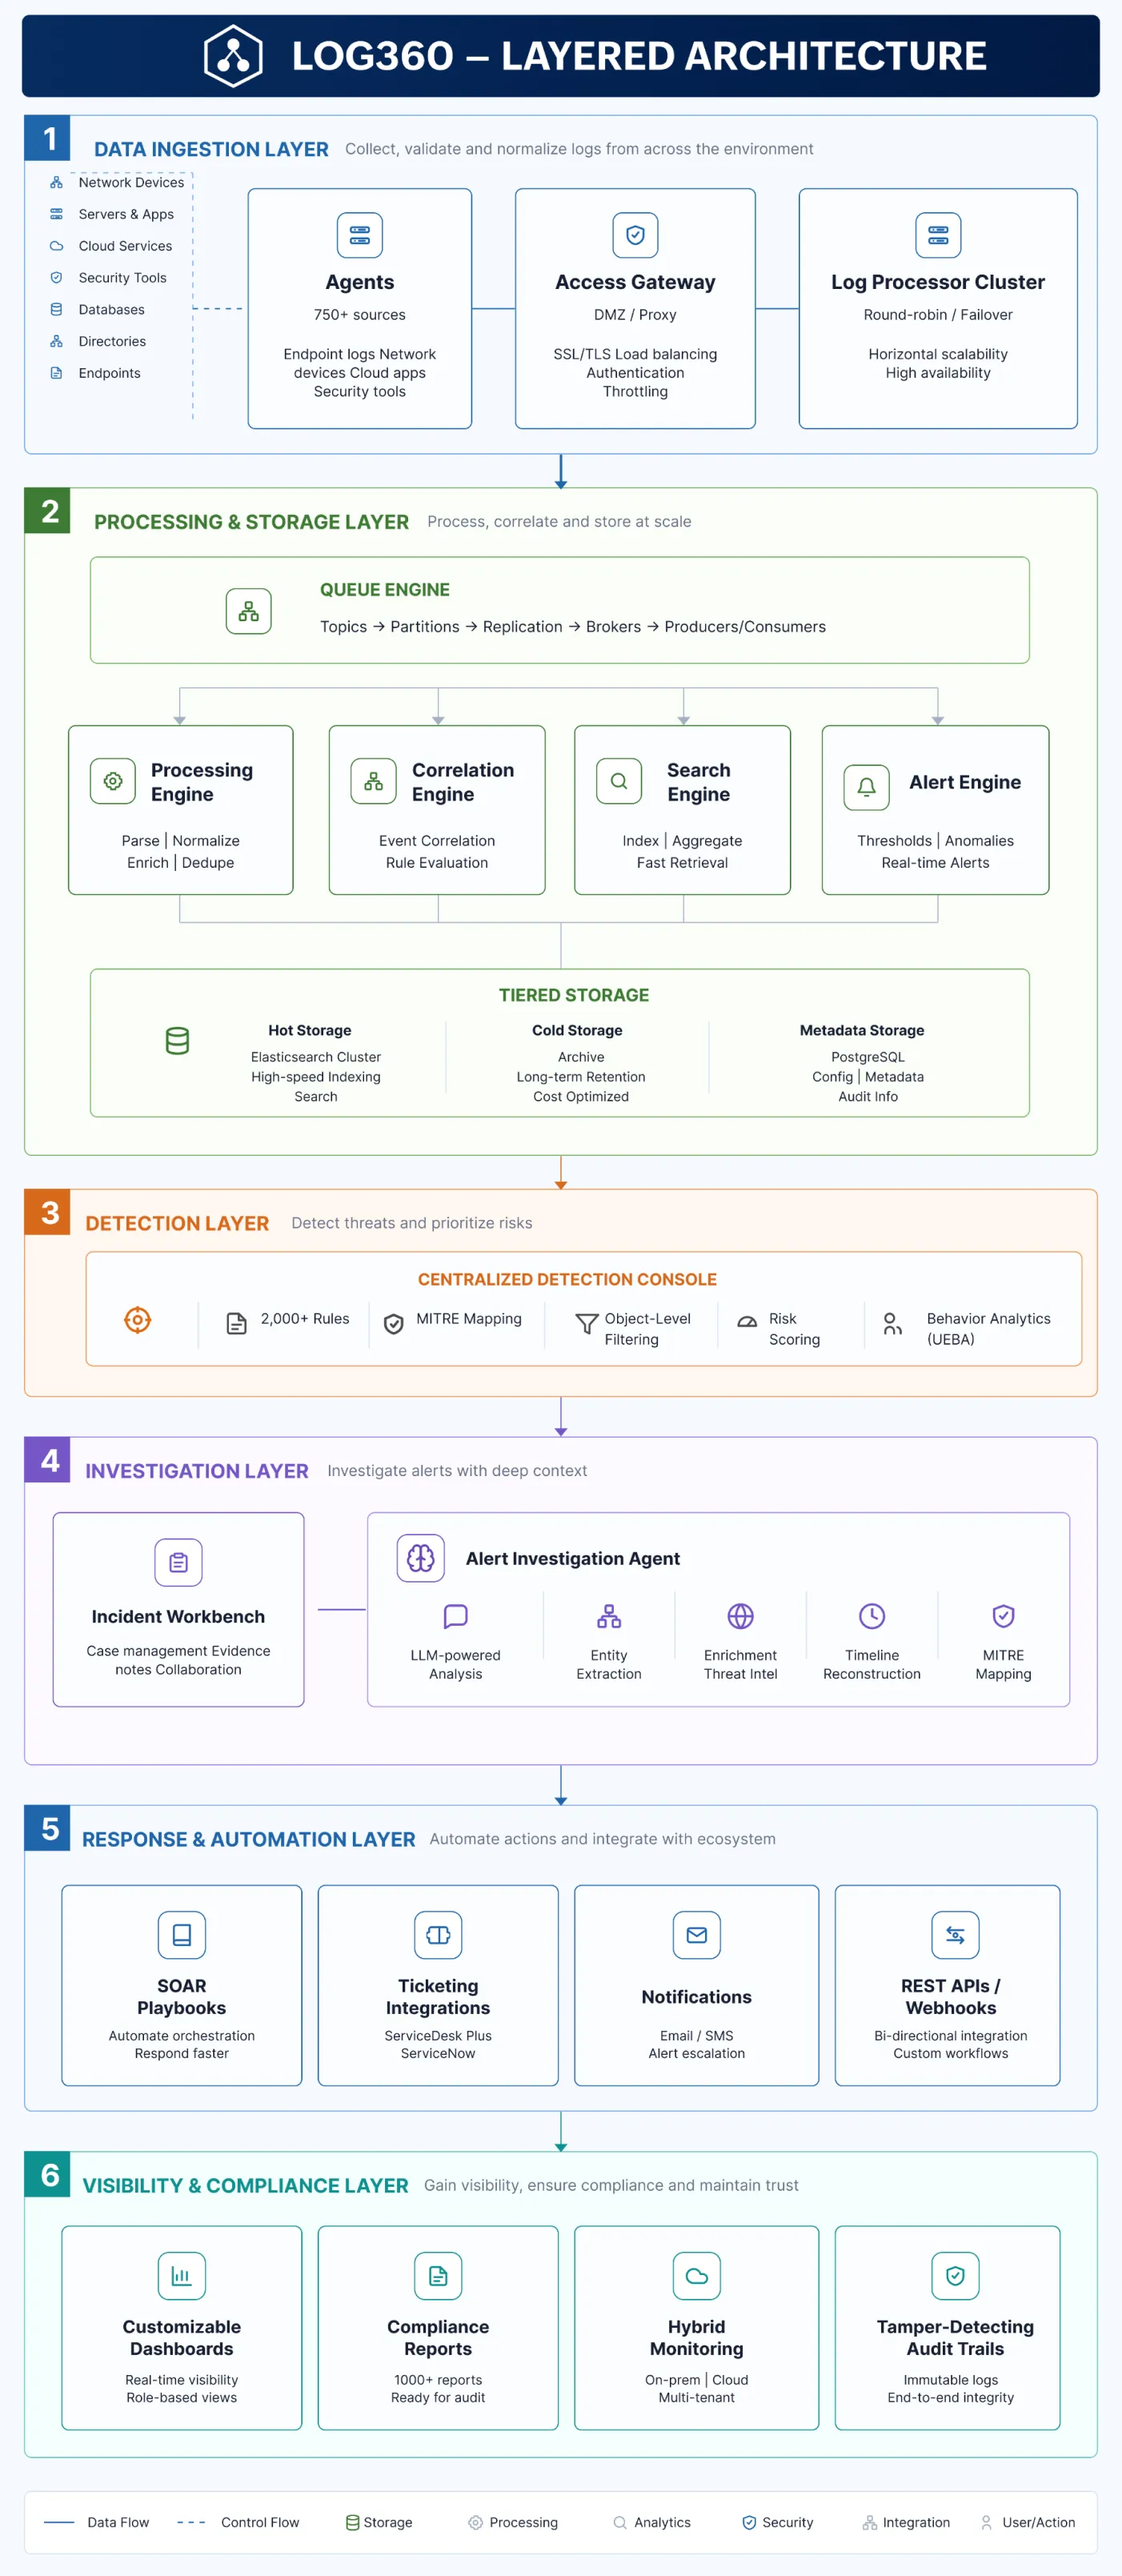
Log360 uses a layered architecture. Each layer handles one stage of the data life cycle: collection, normalization, enrichment, indexing, analysis, and response. The architecture emphasizes separation of concerns, tiered storage, real-time and batch processing, and integrated investigation workflows. This creates a continuous data-to-decision pipeline.
The ingestion layer captures every log from your hybrid infrastructure. It must never drop data or create blind spots. Log360 ingests from over 750 sources out of the box. These include firewalls, servers, databases, applications, AWS, Azure, and Microsoft 365.
At enterprise scale, ingestion needs secure transport, smart preprocessing, and horizontal scaling. Log360 delivers this with three components: intelligent agents, a DMZ gateway cluster, and a distributed processor cluster.
For remote sites, Log360 deploys lightweight agents. These agents parse logs locally. They convert raw data into structured key-value pairs before transmission. Agents can filter out unneeded events like informational heartbeats. This saves bandwidth and storage. Agents compress the structured data and encrypt it with TLS. Then they send an outbound HTTPS connection to the central Log360 deployment.
Large enterprises with many remote sites face a security risk. Exposing internal Log360 processors to the internet is dangerous even with HTTPS. Log360 solves this with the Access Gateway Cluster. You deploy this cluster in your DMZ, the buffer zone between the internet and your internal network.
The gateway acts as a reverse proxy. It receives HTTPS log uploads from remote agents. But it does not host the Log360 application. Instead, it validates the request, terminates the SSL connection, and forwards the log data to internal processors over a separate channel. To any external agent, the gateway looks like the Log360 endpoint. The internal processor IP addresses are never exposed.
The gateway cluster typically has multiple nodes. It can distribute incoming logs across internal processors in a round-robin fashion. If one gateway node fails, others take over. There is no single point of failure for log ingestion.
After logs pass through the gateway, they reach the Log Processor Cluster. This cluster replaces the old single-server bottleneck with a distributed framework that scales horizontally. Agents are configured with a list of all available processor nodes. They distribute connections using a round-robin or load-aware algorithm. No single processor gets overwhelmed.
As the log volume grows, you simply add more processor nodes. The system immediately starts distributing logs to the new nodes. Ingestion capacity increases linearly. This is how Log360 solves the volume challenge.
Agents upload logs to available processors, and traffic reroutes to healthy nodes during component failures. This failover capability ensures service continuity. Ingested logs go immediately to the distributed Queue Engine, a Kafka-like persistent queue. Even if a downstream component like the Correlation Engine gets delayed, ingestion keeps accepting new logs. The queue buffers them safely. This decoupling solves the velocity challenge.
For devices that cannot host an agent, Log360 supports agentless collection. It uses syslogs, Windows Event Log (WMI), and REST APIs. For unsupported log formats, security teams can build custom parsers using a Grok-based pattern editor.
This layer converts raw logs into structured, analysis-ready data. It handles normalization, enrichment, indexing, and tiered storage.
Within the Log Processor Cluster, specific roles handle different functions. The Processing Engine enriches parsed logs. It also handles log forwarding, alerts, and archiving by default. The Search Engine indexes data into Elasticsearch and handles user queries. The Log Queue Engine manages event flow between components and prevents data loss.
Role-based specialization lets you assign these functions to dedicated nodes. This isolates resource-intensive tasks. If search performance degrades, you can add a dedicated Search Engine node without touching ingestion nodes.
Logs from different sources use different field names. Log360 normalizes them into a unified schema. This enables cross-source correlation without custom parsing. Enrichment adds geolocation, threat intelligence, and identity context from Active Directory or Entra ID.
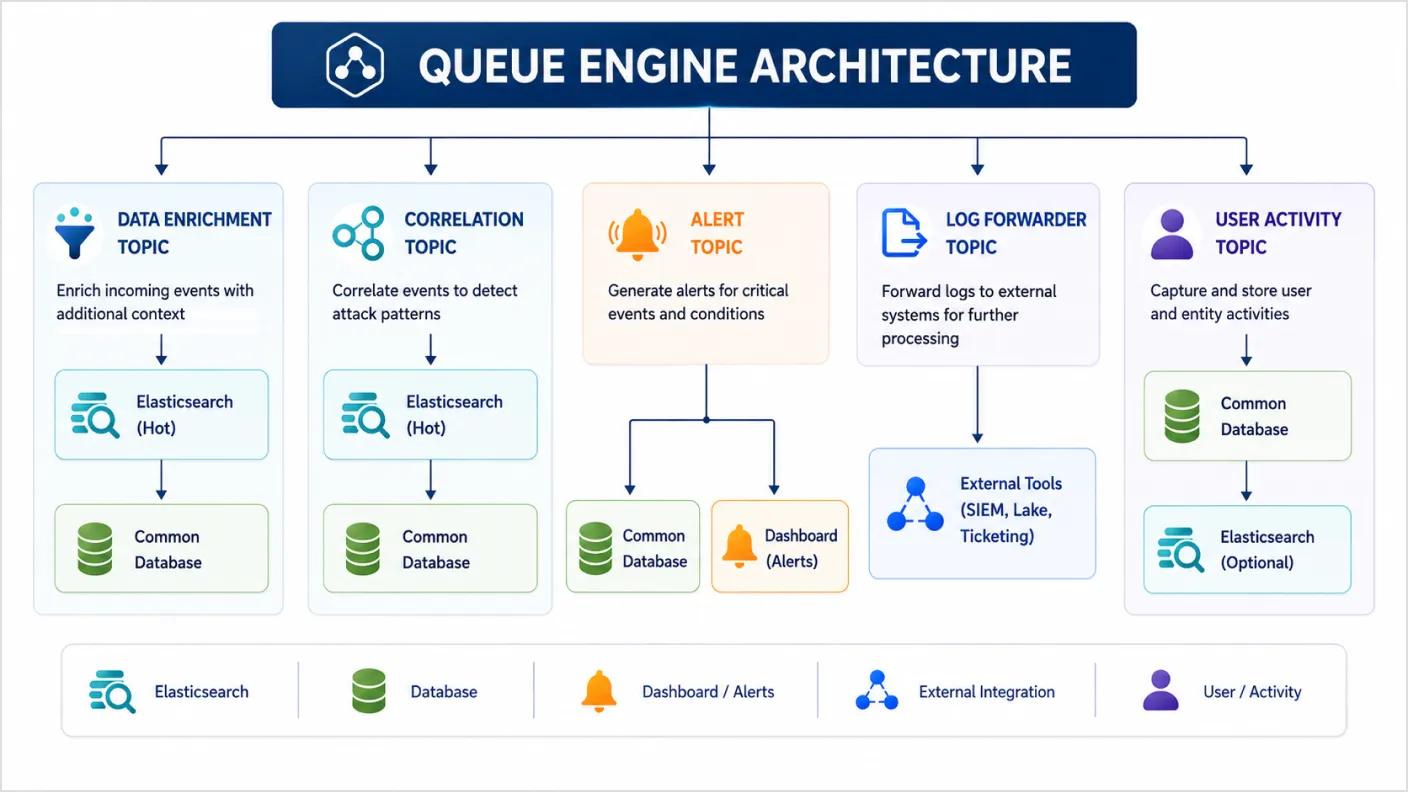
The Queue Engine is a distributed streaming mechanism that buffers logs between ingestion and processing. It collects logs at high speed and processes them asynchronously. This directly solves the velocity challenge.
| Concept | What it does |
|---|---|
| Topics | Folders for related messages, e.g., data enrichment, correlation, alert, log forwarder, user activity, incident. |
| Partitions | Split a topic into chunks. Allow multiple functions to work simultaneously. This increases speed and scalability. |
| Replication | Copies every partition across multiple processors: If one fails, another takes over. This guarantees high availability. |
| Broker | A single node that stores data and handles requests: Multiple brokers share topics and partitions for load balancing. |
| Producer | Sends data into the queue, e.g., the Processing Engine. |
| Consumer | Reads data from the queue, e.g., the Correlation Engine, the Alert Engine. |
| Controller node | A special broker that assigns partitions and manages cluster health in multi-node setups. |
The queue stores all messages for a set time. Nodes that go down can catch up later.
Tiered storage Log360 uses four storage types, each with a specific purpose.
| Storage type | Technology | What it stores | Access pattern |
|---|---|---|---|
| Hot storage | Elasticsearch indexes | Frequently queried logs for real-time search | Fast, low-latency queries |
| Cold storage | Compressed, encrypted files | Older logs moved from hot storage for compliance | Slower, batch retrieval |
| Common database | PostgreSQL or Microsoft SQL | System metadata, alert configs, enrichment data | Transactional, moderate speed |
| Shared storage | NFS mount | Inter-processor coordination, sync, state sharing | Critical for multi-node consistency |
Hot storage is updated by the Search, Correlation, and Alerting Engines. Cold storage is updated by the Log Archive or Processing Engine. The common database is updated and accessed by all processor nodes.
The detection layer continuously analyzes data to find suspicious activity. Log360 integrates multiple detection engines into a Centralized Detection Console. This replaces the fragmented rule management of traditional SIEM solutions.
Before centralization, teams configured correlation rules in one module, UEBA policies in another, and threat feeds in a third. This led to inconsistent coverage, missed rules, and alert fatigue.
The Centralized Detection Console provides one interface for all detection logic. You can create correlation rules, define UEBA policies, map detections to MITRE ATT&CK®, and subscribe to threat feeds without toggling screens. No rule gets accidentally disabled or misconfigured.
The console also introduces object-level filtering. Every detection rule can be scoped to specific users, groups, or organizational units. A privilege escalation rule that would generate thousands of false positives globally can be scoped only to IT admin OUs. A data exfiltration rule can target only finance users. This precision filtering reduces alert fatigue. Analysts focus on genuine threats. This solves the response time challenge by making every alert worth attention.
Log360 includes over 2,000 prebuilt detection rules. They are delivered and updated automatically via the cloud. Rules cover privilege escalation, lateral movement, brute-force attacks, ransomware indicators, and data exfiltration. The cloud delivery model ensures protection against the latest threats without manual updates.
The correlation engine evaluates events against rules in real time. It connects related events across different log sources. This uncovers attack patterns that are invisible when viewing logs in isolation.
A single failed login is unremarkable. But ten failed logins from the same IP to ten different accounts within five seconds, followed by a successful login, triggers a brute-force correlation rule. Rules can be built with a drag-and-drop builder or SQL-like syntax.
User and entity behavior analytics (UEBA) builds behavioral baselines using machine learning. It learns normal behavior for users, devices, and service accounts. Then it flags anomalies.
Examples include a user downloading 500 documents in an hour when their baseline is five per day. Or a server communicating with a rare country when its baseline is only the local region. Or a service account logging in at 3am when its baseline is nine to five. UEBA excels at detecting insider threats and compromised accounts.
Log360 enriches detection with cloud-delivered threat feeds. These provide malicious IPs, known C2 domains, phishing URLs, and malware hashes. Threat intelligence works in two ways. In pre-detection, incoming logs are checked against feeds during ingestion. A match generates an immediate alert. In post-detection, analysts can manually enrich entities with threat data during investigation.
Not all alerts are equal. Log360 applies a risk scoring algorithm. It considers rule severity, asset criticality (domain controller vs. print server), user role (privileged user vs. standard user), and historical context (repeat offender). Alerts are prioritized as Critical, High, Medium, or Low. The SOC dashboard shows the most impactful threats at the top.
Once a threat is detected, the investigation layer enables fast, contextual analysis. Traditional SIEMs just present a list of logs. Log360 provides an incident workbench as a single pane of glass for investigations. This solves the response time challenge.
The incident workbench displays all active alerts in a unified queue, sorted by risk score. From here, analysts can drill into any alert. They see the triggering rule, the entities involved, the event timeline, and any related alerts. Analysts can track incident status, assign incidents, add comments, and attach forensic evidence.
Log360's search engine is built on Elasticsearch. It supports real-time search across hot storage and historical search across cold storage. Queries use structured field-value pairs. Analysts can save frequent searches and schedule them for regular forensic sweeps.
Zia Insights delivers AI-powered summaries for individual logs, alerts, and incidents. It is designed for speed. Analysts click an icon, and within seconds, Zia provides a structured analysis. The output includes a contextual summary of what happened, a reconstructed attack timeline, identification of key entities involved, MITRE ATT&CK technique mappings, and suggested mitigation steps. Zia Insights focuses on single-event analysis and requires no user interaction beyond the initial click. It is available in the Logs, Alerts, and Incidents modules. Zia Insights works with a bring-your-own-key model using Azure OpenAI or OpenAI.
Log360 includes an Alert Investigation Agent. This LLM-driven agent reasons across multiple data sources. When an alert triggers, the agent starts working immediately.
The agent supports interactive investigation. Analysts can ask follow-up questions, pause and resume sessions, and guide the investigation direction. The agent produces a comprehensive, export-ready report that can be attached to an incident. The Alert Investigation Agent is available in the Alerts module and is invoked by starting an investigation on a selected alert.
The agent cuts deep investigation time from hours to minutes by autonomously gathering related alerts, correlating entities, and evaluating risk across multiple sources.
Zia Insights is ideal for quick understanding. An analyst sees an alert, clicks for insights, and gets an immediate summary with MITRE mappings and suggested next steps. Total time: seconds.
The Investigation Agent is ideal for high-severity or complex alerts. The agent autonomously gathers related alerts, correlates entities, evaluates risk across multiple sources, and builds a complete attack narrative. Total time: minutes instead of hours.
The response layer enables quick, consistent actions to contain threats and remediate incidents. With native SOAR capabilities, Log360 bridges the gap between detection and response. Teams can move from alert to remediation without leaving the platform. This directly solves the response time challenge.
Traditional SOAR solutions stitch together disparate products through fragile API integrations. Log360's SOAR features are built on the same data model as its detection engine. Alerts, entities, and context flow seamlessly into playbooks without custom parsing. A playbook can access the same normalized fields (user name, source IP, file hash) that the detection engine already extracted.
Log360 provides a low-code automation engine for common SOC tasks. Notification profiles can be configured with specific recipients, subject lines, and message templates using dynamic macros. Alerts can be sent to multiple email addresses and phone numbers for SMS delivery.
Log360 includes pre-built playbooks that execute automatically when an alert triggers. Playbook actions include disabling compromised user accounts, blocking malicious IP addresses, and killing suspicious processes.
A single playbook can perform cross-domain actions. In a ransomware scenario: isolate the endpoint, revoke user sessions, block the file hash, query threat intel, create a ticket, and notify the SOC. All steps execute automatically within seconds.
Log360 provides a library of prebuilt playbooks covering ransomware, privilege escalation, data exfiltration, brute-force attacks, and compromised cloud accounts. Custom playbooks can also be created.
The integration layer is a first-class architectural component. Log360 exposes REST APIs that follow OpenAPI specifications. External systems can query logs, create alerts, fetch incident data, and trigger responses. APIs include authentication, rate limiting, and audit logging.
For inbound integration, Log360 can receive alerts from vulnerability scanners, cloud security posture management (CSPM) tools, and custom applications. These external events are normalized into the same schema as native logs.
For outbound integration, Log360 can send logs, alerts, and incidents to SIEM solutions, ticketing platforms, SOAR platforms, data lakes, and compliance archives. The Log Forwarder role can be dedicated to its own processor node for scalability.
Log360 integrates with major ticketing platforms for incident tracking. Supported platforms include ManageEngine ServiceDesk Plus, ServiceNow, and Jira Service Desk. When an alert triggers, Log360 can automatically create a ticket with all relevant evidence attached. Two-way synchronization allows ticket updates in ServiceDesk Plus to reflect back in Log360.
Log360 can automatically assign tickets to security administrators based on preconfigured assignment rules. When an alert triggers, the system can route incidents to specific analysts or teams as defined in the workflow, ensuring no critical incident goes unassigned.
The ManageEngine Marketplace provides prebuilt SOAR extensions for CrowdStrike, Bitdefender, Okta, and Microsoft Defender for Endpoint, with more than 15 integrations available. Log360 also integrates with ticketing platforms including ServiceNow, ManageEngine ServiceDesk Plus, and Jira Service Desk for incident tracking. For log ingestion, Log360 supports over 750 sources including AWS, Azure, Microsoft 365, Palo Alto, Fortinet, and Cisco devices.
Marketplace extensions are introduced and supported by ManageEngine. Log360 provides connection settings and system diagnostics from the central admin console, allowing administrators to test connections and verify integration health.
Log360 delivers alert notifications through email and SMS. Email notifications support customizable templates with dynamic macros. SMS notifications can be sent via GSM modem or custom HTTP/SMTP/SMPP gateway.
For custom integrations, Log360 provides REST APIs that follow OpenAPI specifications. External systems can query logs, create alerts, fetch incident data, and trigger responses.
For systems not covered by pre-built connectors, Log360 supports webhook-based integrations. Custom playbooks can be created to extend response actions beyond the pre-built library.
Log360 tracks key SOC metrics including mean time to respond (MTTR) on the incident dashboard. The dashboard also provides insights into active and unresolved incidents, recent and critical incidents, and security analyst workload.
Deliver insights for security operations and audits
This layer provides a unified view through real-time dashboards, scheduled reporting, and centralized hybrid monitoring. It surfaces all the processing, detection, investigation, and response activity for human consumption and regulatory accountability.
Log360 dashboards are fully customizable. Users can add, remove, resize, and rearrange widgets to focus on the data most relevant to their monitoring needs.
Log360 provides prebuilt compliance reports for major regulations including the GDPR, the PCI DSS, HIPAA, SOX, ISO 27001, and more. Reports can be scheduled, exported, and customized to meet organizational requirements.
Log360 provides centralized visibility across cloud platforms, identity systems, and on-prem infrastructure from one console. Security teams no longer need to pivot between the AWS Console, Azure Portal, Microsoft 365 Compliance Center, and on-premises AD tools.
CloudTrail, VPC Flow Logs, Config, GuardDutyFor Azure: Activity Logs, Entra ID sign-ins and audits, Key Vault, Sentinel.
Entra ID, Exchange Online, SharePoint, OneDrive, Teams.
Active Directory on-premises (logons, group changes, privilege escalations) and Entra ID cloud (conditional access, risky sign-ins, role assignments).
Correlation rules can span identity stores, detecting scenarios like an on-premises privilege escalation followed by a suspicious cloud sign-in from a rare location.
Every action within Log360 is audited, including user logins, configuration changes, report generation, and incident actions. Log360 maintains tamper-detecting audit trails with configurable retention periods.
Log360 combines six capabilities that traditional SIEM solutions scatter across separate products.
One codebase handles log management, UEBA, correlation, SOAR, and compliance reporting. No integration costs. No data schema mismatches. No vendor finger-pointing during incidents.
The Log Processor Cluster with role-based specialization lets you scale specific functions independently. Add nodes as the log volume grows. Add dedicated Search Engine nodes if search slows down. No downtime required.
The Access Gateway Cluster sits in your DMZ as a reverse proxy. External agents never see your internal processor IPs. All agent communication uses outbound HTTPS. Archived logs are compressed, encrypted, and write-once.
The Queue Engine uses topics, partitions, and replication. Messages persist for a configurable retention period. Failed nodes catch up after recovery. Producers and consumers are decoupled, so downstream delays never block ingestion.
The Alert Investigation Agent autonomously investigates alerts, enriching entities across multiple data sources, reconstructing attack timelines, mapping to MITRE ATT&CK, and producing export-ready reports.
REST APIs follow OpenAPI standards. The Marketplace offers prebuilt connectors for AWS, Azure, Microsoft 365, ServiceNow, Slack, Palo Alto, CrowdStrike, and more. A low-code builder handles custom integrations. Python full-code support handles complex requirements.
Role-based dashboards serve analysts, managers, and executives. SOC metrics track mean time to detect (MTTD), mean time to acknowledge (MTTA), and MTTR. Tamper-proof audit trails satisfy compliance requirements for separation of duties and non-repudiation.