NGINX Plus monitoring
NGINX Plus, a best-in-class web server, also acts as a reverse proxy server, providing an additional layer of abstraction, and ensuring a smooth transmission between client and server. To maintain fluid operation of websites and other applications built on web servers, monitoring NGINX Plus servers along with web applications is imperative.
The best way to ensure your NGINX Plus servers are healthy and stable is to set up a robust monitor tool, which can provide thorough NGINX Plus monitoring and swift alerting services. Applications Manager's NGINX Plus monitoring tool collects important metric data and interprets it in visual and tabular formats for easy understanding. Its monitoring capability is not limited only to web servers and websites; it can monitor your entire IT infrastructure.
With our NGINX Plus monitor, you can:
- Monitor key performance indicators
- Troubleshoot faster
- Perform automatic actions
- Analyze performance trends
Track and monitor NGINX Plus metrics
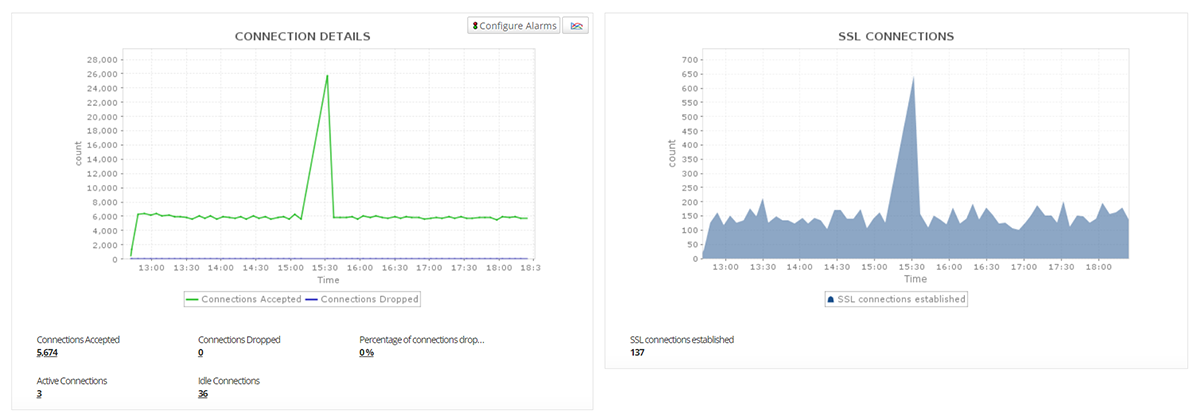
Applications Manager monitors a variety of metrics including zones, upstreams, Transmission Control Protocol (TCP) and User Datagram Protocol (UDP), caches, and servers for thorough NGINX Plus performance monitoring. You can see how traffic gets distributed between NGINX Plus servers, zones, and individual upstream servers with the stats of connections, HTTP requests, and SSL sessions shown on the NGINX Plus dashboard.
Visualize Server zones and upstreams:
Make educated decisions regarding your servers with the help of information provided by Applications Manager like:
- Requests in Process, Requests received, Requests discarded
- Bytes received and sent
- Response code counts, categorized by status code
- Response Time and Failed Health Checks
- HTTP requests received and discarded

Monitor TCP/UDP zones and Upstreams:
Applications Manager's NGINX Plus monitoring system collects and tracks the following TCP and UDP metrics:
- Current Connections, Connections accepted and Requests discarded
- Bytes sent and received by each server zone
- Number of health checks failed
- Response code counts, categorized by status code

Track cache hits and misses.
Two most important metrics for any caching system are cache hits and misses; monitoring these NGINX Plus performance metrics will help you understand your caching system's performance. Applications Manager's NGINX Plus monitoring system gives an overview about the caching process with details like Valid Responses Read, Responses written, Responses missing in cache,Expired Responses present in cache not read and many more. It also provides a graphical represention of important parameters like Hit Ratio, Responses Read Breakup and Responses Not Read Breakup for easy understanding.

Metrics to watch out for:
- Response codes: NGINX Plus error codes display the rate of errors returned with respect to the requests sent. Client errors are represented by 4xx status codes, and server errors by 5xx status codes.
- Response Time(ms): The response times of various upstream servers tell you the time taken for that request to process. With this information, you can choose to end the process if it takes a considerable amount of time.
- Number of requests and connections: These numbers can reveal a lot about your NGINX Plus server's health. You can deduce the request acceptance rate, and if it's found to be low, it could be an indication of a problem or traffic spikes.

See how Applications Manager caters to your NGINX Plus web server monitoring needs. Schedule a personalized demo today.
Request DemoQuickly resolve issues with the fault management system.
Perceptive NGINX Plus monitoring tools like Applications Manager can generate notifications based on the applied alerting rules on key metric data and escalate issues through email or SMS. Thresholds can be designated for various parameters, and alerts can be configured to trigger in the event of a threshold violation. With Applications Manager's NGINX Plus server monitoring tool, you can establish dynamic baselines to detect anomalies and identify performance degradation in time to prevent major business catastrophes.

Associate actions to thresholds.
With our NGINX Plus monitoring tool, you can also set up automated actions, such as email actions, SMS actions, etc., and associate them with attribute thresholds and anomaly profiles to be performed without manual intervention when they are violated.
Gain insights into various trends with comprehensive reports.
In addition to comprehensive NGINX Plus monitoring, Applications Manager provides extensive reports on various NGINX Plus performance parameters. With trend analysis reports, utilize historical data, heat charts, and statistical reports for various attributes to efficiently analyze performance trends. Unlike most monitoring tools, Applications Manager uses machine learning techniques to predict NGINX Plus server's growth and utilization trends. With these forecasts, you can accurately anticipate its future needs to make decisions accordingly.

