Amazon EKS Monitoring
Overview
Amazon Elastic Kubernetes Service (EKS) is a managed Kubernetes service that facilitates smooth running of Kubernetes on both AWS and on-premises. EKS is integrated with many AWS services to provide scalability and security and helps guarantee high availability of your clusters and its resources across numerous availability zones. There is no need to install, operate and maintain our own Kubernetes control plane or node.
Creating a new monitor
Prerequisites for monitoring Amazon EKS metrics: Click here
To learn how to create a new Amazon EKS monitor, refer here.
Monitored Parameters
Go to the Monitors Category View by clicking the Monitors tab. Click on the EKS instance available under Amazon in the Cloud Apps section. Displayed is the Amazon EKS bulk configuration view distributed into three tabs:
- Availability tab gives the availability history for the past 24 hours or 30 days.
- Performance tab gives the health status and events for the past 24 hours or 30 days.
- List view tab enables you to perform bulk admin configurations.
By clicking a monitor from the list, you'll be taken to the Amazon EKS monitor dashboard. It has 6 tabs:
- If a node is not in the 'Ready' state, the availability of the node will be automatically affected. Also, the health of the node in the monitor is dependent on the following parameters by default and alerts can be configured for the same under Settings → Performance Polling → Optimize Data Collection → Elastic Kubernetes Service:
- EKS Node Memory Pressure
- EKS Node Disk Pressure
- EKS Node PID Pressure
- EKS Node Out of Disk
- EKS Node Network Unavailable
Mode of Monitoring
- REST API
- Metadata/Service API (DescribeCluster)
- CloudWatch API (Container Insights)
- Kubectl
- Cluster Information is collected from Metadata API.
- Metrics marked with * are collected from AWS CloudWatch.
- Rest of the metrics are collected from kubectl utility.
Overview
| Parameter | Description |
|---|---|
| CLUSTER INFORMATION | |
| Cluster Status | Current status of the cluster. (CREATING, ACTIVE, DELETING, FAILED, UPDATING) |
| Cluster ARN | The Amazon Resource Name (ARN) of the cluster. |
| Cluster Endpoint | The endpoint for your Kubernetes API server. |
| NAMESPACE DETAILS | |
| Namespace Name | Name of the namespace |
| Running pods in namespace * | Number of running pods under the namespace. |
| Resource Version | The version number of the namespace. |
| Namespace Availability | Availability of the Namespace |
| Namespace Created Time | Timestamp at which the Namespace was created |
| PODS | |
| Used Pods % | Percentage of the number of pods used. |
| Used Pods | Number of pods used. |
| Maximum Pods | Maximum number of pods available. |
| Top 5 Nodes by Used Pods - Displays a graphical representation of top 5 nodes with respect to the number of pods used. | |
| CLUSTER USAGE DETAILS | |
| Avg Cluster CPU Usage | Average amount of CPU used by the cluster (in percentage). |
| Avg Cluster Memory Usage | Average amount of memory used by the cluster (in percentage). |
| API SERVER COMPONENT ERROR RATES | |
| API Server - 5xx Requests | Total number of server-side HTTP 5xx error responses from the Kubernetes API server components aggregated between the poll interval. |
| API Server - 4xx Requests | Total number of client-side HTTP 4xx error responses from the Kubernetes API server components aggregated between the poll interval. |
| API Server - 429 Requests | Total number of throttled API requests (HTTP 429) from the Kubernetes API server components aggregated between the poll interval. |
| API SERVER COMPONENTS INFLIGHT REQUESTS | |
| API Server - Read Only Inflight Requests | Average number of ongoing read-only requests processed by the API server between the poll interval. |
| API Server - Mutating Inflight Requests | Average number of ongoing mutating requests processed by the API server between the poll interval. |
| NODE DETAILS | |
| Master Nodes | Number of master nodes available. |
| Worker Nodess | Number of worker nodes available. |
| Failed Nodes * | Number of nodes that have failed. |
| CLUSTER DETAILS | |
| Git Version | Git version of the cluster. |
| Build Date | Build date of the cluster. |
| Compiler | Name of the compiler used. |
| Platform | OS Platform of the cluster. |
| COMPONENT DETAILS | |
Note: Component Details monitoring is not supported from Applications Manager version 17.86, as the | |
| Component Name | Name of the component. |
| Availability | Availability status of the component. |
| NODE GROUP DETAILS | |
| Node group Name | The name associated with an Amazon EKS managed node group. |
| Node group Status | The current status of the managed node group. (CREATING, ACTIVE, UPDATING, DELETING, CREATE_FAILED, DELETE_FAILED, DEGRADED) |
| Kubernetes Version | The Kubernetes version of the managed node group. |
| Release Version | AMI ID in launch template (OR) EKS version of the optimized AMI. |
| Minimum Node Size | The minimum number of nodes that the managed node group can scale into. |
| Maximum Node Size | The maximum number of nodes that the managed node group can scale out to. |
| Desired Node Size | The desired number of nodes that the managed node group should maintain. |
| Instance Types | If the node group wasn't deployed with a launch template, then this is the instance type that is associated with the node group. If the node group was deployed with a launch template, then this is null. |
| Created At | The timestamp when the node group was created. |
| FARGATE PROFILE DETAILS | |
| Fargate Profile Name | The name of the Fargate profile. |
| Fargate Profile Status | The current status of the Fargate profile. (CREATING, ACTIVE, DELETING, CREATE_FAILED, DELETE_FAILED) |
| Created At | The timestamp when fargate profile was created. |
| Subnets | The IDs of subnets to launch pods into. |
Node
| Parameter | Description |
|---|---|
| Node CPU Utilization | |
| Node CPU Utilization | The average percentage of CPU utilized by each node at the time of polling. |
| Node Memory Utilization | |
| Node Memory Utilization | The average percentage of memory used by each node at the time of polling. |
| Top 5 Nodes by Memory Details - Displays a graphical representation of top 5 nodes with respect to their corresponding memory details (in percentage). | |
| Top 5 Nodes by CPU Details - Displays a graphical representation of top 5 nodes with respect to their corresponding CPU details (in percentage). | |
| Node Usage Details | |
| Node Name | Name of the node |
| Allocatable Memory | The CPU resources of a node that are available for scheduling (in GiB). |
| Memory Limit | The maximum limit of memory resource which can be used (in percentage). |
| Memory Request | Number of memory requests (in percentage). |
| Allocatable CPU | The number of CPU processes that are available. |
| CPU Limit | The maximum limit of CPU resource which can be used (in percentage). |
| CPU Request | Number of CPU requests (in percentage). |
| Network Total Usage * | The total number of data transmitted and received over the network per node in a cluster (in kB/s). |
| File System Usage * | The total amount of file system capacity being used on nodes in the cluster (in percentage). |
| Running containers in node * | The number of running containers per node in a cluster. |
| Node Pod Details | |
| Node Name | Name of the pod |
| Pod Usage | Displays a graphical representation of the total number of pods available with used and free pods split-up. |
| kube-system Pods | Number of Kube state pods. |
| Non kube-system Pods | Number of non-Kube state pods. |
| Images | Number of images present in the node. |
| Used Pods | Total num of pods present in Kubernetes. |
| Allocatable Pods | Number of pods that are available. |
| NODE DETAILS | |
| Node Name | Name of the node |
| Instance ID | EC2 Instance ID of the node. |
| OS Image | OS Image name of the node. |
| OS | Name of the OS in which the container is deployed. |
| Architecture | Architecture details of the node. |
| Type | Type of node used. |
| Kubelet Version | The version of Kubelet used. |
| Allocatable Ephemeral Storage | Size of temporary memory available (in GiB). |
| Created Time | Timestamp at which the node was created. |
Pods
| Parameter | Description | ||||||||
|---|---|---|---|---|---|---|---|---|---|
| Pod CPU Utilization | The average CPU usage percentage of individual pods at the time of polling. | ||||||||
| Pod Memory Utilization | The average memory usage percentage of individual pods at the time of polling. | ||||||||
| Top 10 Pods by CPU Usage (%) - Displays a graphical representation of top 10 pods with respect to their corresponding CPU details (in percentage). | |||||||||
| Top 10 Pods by Memory Usage (%) - Displays a graphical representation of the top 10 pods based on their memory utilization percentage. | |||||||||
| POD CPU AND MEMORY USAGE | |||||||||
| Pod UUID | Universal unique ID of the pod. | ||||||||
| Pod Name | Name of the pod. | ||||||||
| Pod Namespace | Namespace of the pod. | ||||||||
| Pod CPU Used (millicores) | The amount of CPU consumed by the pod (in millicores). | ||||||||
| Pod CPU Usage (%) | The percentage of CPU utilized by the pod. | ||||||||
| Pod Memory Used (MiB) | The amount of memory used by the pod (in MiB). | ||||||||
| Pod Memory Usage (%) | The percentage of memory utilized by the pod. | ||||||||
| POD PERFORMANCE STATISTICS | |||||||||
| Pod UUID | Universal unique ID of the pod. | ||||||||
| Pod Name | Name of the pod | ||||||||
| Pod Namespace | Namespace of the pod. | ||||||||
| Pod Containers Count | The number of containers run by the pod. | ||||||||
| Pod CPU Limit(millicores) | The maximum amount of CPU resources that all containers in a Pod are allowed to use collectively (in millicores). If 0, no limit is set, then pod can use CPU upto the node capacity. | ||||||||
| Pod CPU Limit(%) | The maximum amount of CPU resources that all containers in a Pod are allowed to use collectively (in %). It is the sum of the CPU limits set on each container within the Pod. The Kubernetes kubelet enforces this limit to ensure the Pod does not exceed the specified CPU usage on the node. If a container tries to use more CPU than its limit, it will be throttled. | ||||||||
| Pod CPU Request (millicores) | The guaranteed minimum amount of CPU resources that all containers in a Pod collectively request (in millicores). If 0, no CPU is guaranteed and it can use CPU only if the node has free capacity. | ||||||||
| Pod CPU Request(%) | The guaranteed minimum amount of CPU resources that all containers in a Pod collectively request (in %). It is the sum of the CPU requests of all containers in the Pod. Kubernetes uses this value to schedule the Pod onto a node that has enough CPU capacity to meet the request. | ||||||||
| Pod Memory Limit(in MiB) | The maximum amount of memory (RAM) that all containers in a Pod can use collectively (in MiB).If 0, no limit is set, then pod can use memory upto the node capacity. | ||||||||
| Pod Memory Limit(in %) | The maximum amount of memory (RAM) that all containers in a Pod can use collectively (in %). It is the sum of the memory limits of all containers in the Pod. The kubelet enforces this limit; if a container exceeds its memory limit, it may be terminated. | ||||||||
| Pod Memory Request (in MiB) | The minimum amount of memory that all containers in a Pod request collectively (in MiB). If 0, no CPU is guaranteed and it can use memory only if the node has free capacity. | ||||||||
| Pod Memory Request (in %) | The minimum amount of memory that all containers in a Pod request collectively (in %). It is the sum of the memory requests of all containers in the Pod. Kubernetes uses this value to schedule the Pod onto a node that has enough available memory to satisfy the request. | ||||||||
| Network Transmitted Bytes * | Amount of data transmitted over the network by the pod (in kB/s). | ||||||||
| Network Received Bytes * | Amount of data received over the network by the pod (in kB/s). | ||||||||
| POD DETAILS | |||||||||
| Pod Node Name | Name of the node on which the pod is running. | ||||||||
| Pod Application | Name of the pod application. | ||||||||
| Pod Type | Type of pod used. | ||||||||
| Pod Created | Medium by which the pod was created. | ||||||||
| Pod Status | Current status of the pod (Pending, Running, Succeeded, Failed, or Unknown). | ||||||||
| Pod Age | Amount of time elapsed since the pod was created (in days). | ||||||||
| Pod Start Time | Timestamp at which the pod was started. | ||||||||
| Pod Created Time | Timestamp at which the pod was created. | ||||||||
| Top 10 Pods by CPU Details - Displays a graphical representation of the top 10 pods based on their CPU usage (in %). | |||||||||
| Top 10 Pods by Memory Details - Displays a graphical representation of the top 10 pods based on their memory usage (in %). | |||||||||
| CONTAINER DETAILS | |||||||||
| Container ID | ID of the container. | ||||||||
| Container Name | Name of the container. | ||||||||
| Container Image | Name of the container image. | ||||||||
| Container Pod Name | Name of the container pod. | ||||||||
| Container Restarts | The number of times the container has restarted. | ||||||||
| Container Status | Status of the container. Following are the list of possible values that are shown for each status:
| ||||||||
| Container Start Time | Timestamp at which the container was started. | ||||||||
Services
| Parameter | Description |
|---|---|
| SERVICE DETAILS | |
| Service UUID | Universal unique ID of the service. |
| Service Name | Name of the service. |
| Service Namespace | Name of the Namespace in which the service resides. |
| Application | Name of the service application. |
| Service Type | Type of the service. |
| Service Protocol | Name of the service protocol. |
| Host IP Address | IP address of the service host. |
| Service Target Port | Name of the port that connects with the service. |
| Running pods in service * | The number of pods running the service or services in the cluster. |
| Created Time | Timestamp at which the service was created. |
| DEPLOYMENT DETAILS | |
| Deployment UUID | Universal unique ID of the deployment. |
| Deployment Name | Name of the deployment. |
| Deployment Namespace | Namespace where the deployment exists. |
| Deployment Replicas | The number of replicas in a deployment. |
| Deployment Available Replicas | Number of available replicas in a deployment. |
| Deployment Availability | Availability of the deployment. |
Persistent Volumes
| Parameter | Description |
|---|---|
| PERSISTENT VOLUMES (PV) DETAILS | |
| PV Name | Name of the Persistent Volume. |
| PV Status | Status of the Persistent Volume. (Available, Bound, Released, Failed, or Pending) |
| PV Claim | Name of the Persistent Volume Claim. |
| PV Access Mode | The mode through which you can access the Persistent Volume. |
| PV Storage Class | Name of the Persistent Volume storage class. |
| PV Capacity | The capacity of the Persistent Volume (in GiB). |
| PV Created Time | Timestamp at which the Persistent Volume was created. |
| PERSISTENT VOLUMES CLAIM (PVC) DETAILS | |
| PVC UUID | Universal unique ID of the persistent volume. |
| PVC Name | Name of the Persistent Volume Claim. |
| PVC Namespace | Name of the Namespace in which the Claim exists. |
| PVC Status | Status of the Persistent Volume Claim. (Available, Bound, Released, Failed, or Pending) |
| PV Name | Name of the Persistent Volume. |
| PVC Access Mode | The mode through which you can access the Persistent Volume Claim. |
| PVC Storage Class | Name of the Persistent Volume storage class. |
| PVC Requests | Number of Persistent Volume Claim requests (in GiB). |
| PVC Created Time | Timestamp at which the Persistent Volume Claim was created. |
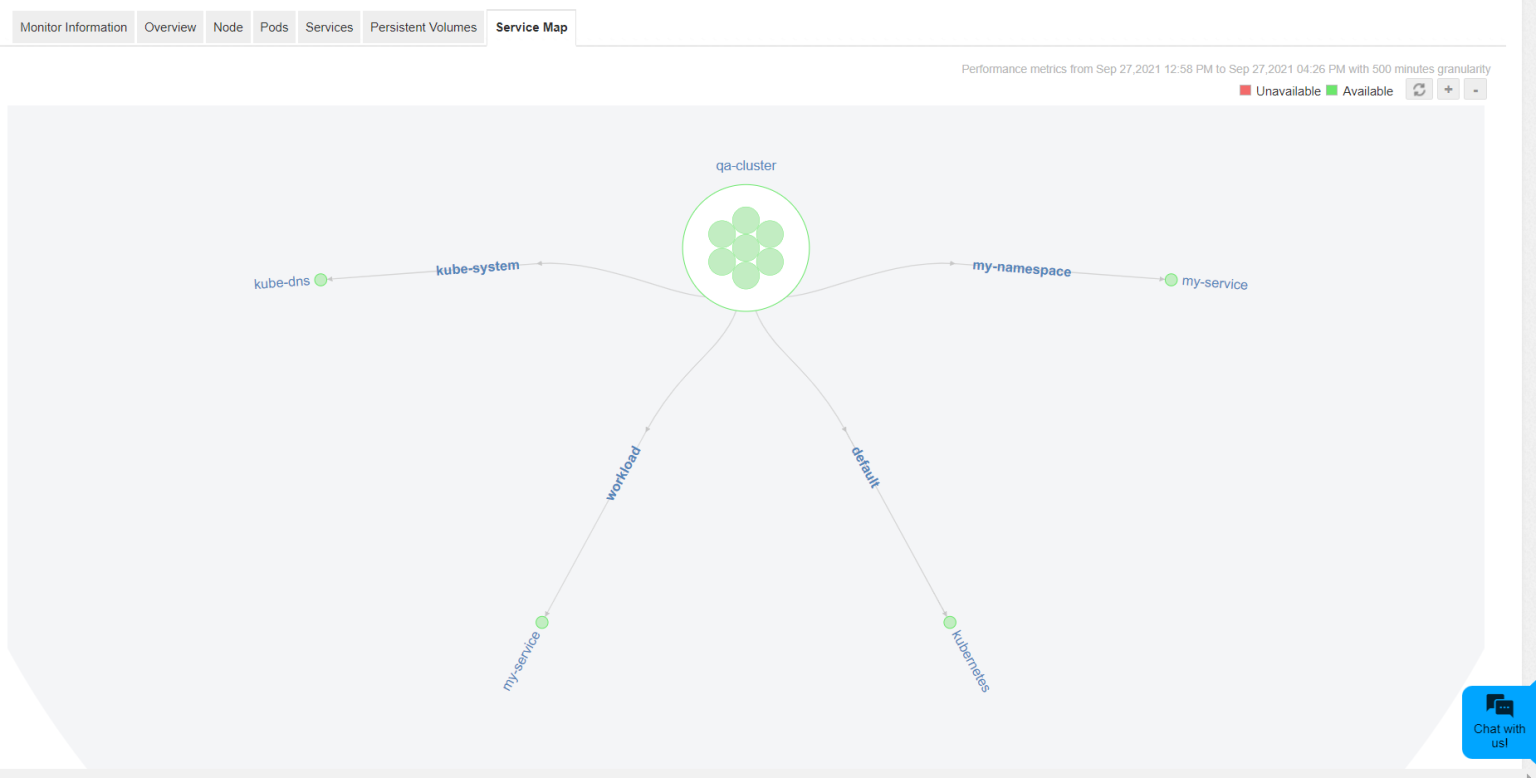
Service Map
- Displays a graphical map view containing namespace and service details.
- All the namespace with its status and running pods count will be seen inside cluster circle.
- Green color indicates that the namespace is UP and red color indicates it is DOWN.
- Under the cluster services under a namespace can be seen as tree.
- Each service contains, its host IP, port and number of running pods.