Amazon Virtual Private Cloud (VPC) Monitoring
Amazon VPC - Overview
Amazon VPC (Virtual Private Cloud) is a networking service that enables you to provision a logically isolated virtual network within the AWS cloud. It allows you to securely connect your cloud resources to on-premises environments while offering fine-grained control over network configuration, security, and traffic management.
Applications Manager’s Amazon VPC monitoring capability leverages VPC Flow Logs along with Amazon S3 (for storing flow log records), Amazon Athena, and AWS Glue to analyze network traffic patterns and performance metrics within your VPC. It provides deep visibility into network activity across Elastic Network Interfaces (ENIs), helping you monitor traffic volume, detect anomalies, and troubleshoot connectivity issues. By continuously analyzing traffic behavior and performance trends, Applications Manager enables improved network security, optimized resource utilization, and consistent application performance across your VPC environment.
Creating a new Amazon Virtual Private Cloud (VPC) monitor
To learn how to create a new Amazon Virtual Private Cloud (VPC) monitor, refer here.
Monitored Parameters
Go to the Monitors Category View by clicking the Monitors tab. Click on the Amazon Virtual Private Cloud (VPC) instance available under Amazon in the Cloud Apps section. Displayed is the Amazon Virtual Private Cloud (VPC) bulk configuration view, distributed into three tabs:
- Availability tab shows the availability history for the past 24 hours or 30 days.
- Performance tab shows health status and events for the past 24 hours or 30 days.
- List view tab enables you to perform bulk admin configurations.
By clicking a monitor from the list, you'll be taken to the Amazon Virtual Private Cloud (VPC) dashboard, which includes the following tabs:
Performance Overview
| Parameter | Description |
|---|---|
| SUBNETS & ENIS | |
| Number of ENIs | The total number of Elastic Network Interfaces (ENIs) present in the VPC at the time of polling. |
| Number of Subnets | The total number of subnets available within the VPC at the time of polling. |
| TOTAL AVAILABLE IP ADDRESSES | |
| Total Available IP Addresses | The total number of unused private IP addresses available across all subnets in the VPC. This indicates the remaining IP capacity for launching new resources. |
| DATA THROUGHPUT | |
| Data In | The total amount of incoming data across all ENIs in the VPC between the poll interval (in MB/s). |
| Data Out | The total amount of outgoing data across all ENIs from the VPC between the poll interval (in MB/s). |
| Total Data Throughput | The combined amount of incoming and outgoing data across all ENIs in the VPC between the poll interval (in MB/s). |
| PACKETS THROUGHPUT | |
| Packets In | The total number of network packets received across all ENIs in the VPC between the poll interval (in packets/s). |
| Packets Out | The total number of network packets transmitted from all ENIs in the VPC between the poll interval (in packets/s). |
| Total Packets Throughput | The total number of network packets sent and received across all ENIs in the VPC between the poll interval (in packets/s). |
| REQUEST METRICS | |
| Rejected Requests | The total number of rejected flow requests across all ENIs between the poll intervals. |
| Accepted Requests | The total number of network requests successfully allowed across all ENIs between the poll intervals. |
| RECORD METRICS | |
| Skipped Records | The total number of network traffic records skipped across all ENIs between the poll interval. |
| No Data Records | The total number of network traffic records with no data available across all ENIs between the poll interval. This may occur due to no network activity, delayed traffic logs, or missing flow log records. |
| AVERAGE PACKET SIZE | |
| Average Packet Sent Size | The average size of network packets transmitted across all ENIs between the poll interval (in MB). |
| Average Packet Received Size | The average size of network packets received across all ENIs between the poll interval (in MB). |
| AVERAGE REQUEST DURATION | |
| Average Request Duration | The average time taken to process network requests across all ENIs between the poll interval, indicating overall network request latency (in seconds). |
| NETWORK ADDRESS USAGE | |
| Network Address Usage | The maximum number of Network Address Usage (NAU) units consumed by this VPC. This helps determine whether workloads should be distributed across multiple VPCs to avoid capacity limits. |
| Peered Network Address Usage | The maximum number of Network Address Usage (NAU) units consumed by this VPC and its peered VPCs within the same region. |
Subnet
| Parameter | Description |
|---|---|
| SUBNET DETAILS | |
| Subnet ID | The unique identifier assigned to the subnet. |
| Subnet Name | The name assigned to the subnet within the VPC. |
| Availability Zone | The Availability Zone in which the subnet is deployed. |
| CIDR Range | The IPv4 CIDR block assigned to the subnet. |
| Number of Available IP Addresses | The total number of unused private IP addresses available in the subnet indicates the remaining IP capacity for launching resources. |
| Number of ENIs | The total number of Elastic Network Interfaces (ENIs) attached to the subnet. |
| State | The current state of the subnet. Possible values: pending, available, unavailable, failed, failed-insufficient-capacity. |
| SUBNET TRAFFIC DETAILS | |
| Subnet ID | The unique identifier assigned to the subnet. |
| Data In | The total amount of incoming data across all ENIs in the subnet between the poll interval (in MB/s). |
| Data Out | The total amount of outgoing data across all ENIs from the subnet between the poll interval (in MB/s). |
| Packets In | The total number of network packets received across all ENIs in the subnet between the poll interval (in packets/s). |
| Packets Out | The total number of network packets transmitted from all ENIs in the subnet between the poll interval (in packets/s). |
| Average Packet Received Size | The average size of network packets received across all ENIs in the subnet between the poll interval, indicating the typical inbound packet payload (in MB). |
| Average Packet Sent Size | The average size of network packets transmitted across all ENIs in the subnet between the poll interval, indicating the typical outbound packet payload (in MB). |
| SUBNET REQUEST DETAILS | |
| Subnet ID | The unique identifier assigned to the subnet. |
| Rejected Requests | The total number of rejected flow requests across all ENIs in the subnet between the poll interval. |
| Accepted Requests | The total number of network requests successfully allowed across all ENIs in the subnet between the poll interval. |
| Skipped Records | The total number of network traffic records skipped across all ENIs in the subnet between the poll interval. |
| No Data Records | The total number of network traffic records with no data available across all ENIs in the subnet between the poll interval. This may occur due to no network activity, delayed traffic data, or missing flow log records. |
| Average Request Duration | The average time taken to process network requests across all ENIs in the subnet between the poll interval, indicating overall network request latency (in seconds). |
ENI
| Parameter | Description |
|---|---|
| ENI DETAILS | |
| ENI ID | The unique identifier assigned to the Elastic Network Interface (ENI). |
| ENI Name | The name assigned to the Elastic Network Interface (ENI) within the VPC. |
| Subnet ID | The identifier of the subnet in which the ENI is located. |
| Availability Zone | The Availability Zone (AZ) where the Elastic Network Interface is deployed. |
| Public IP Address | The public IPv4 address assigned to the ENI, if available. This allows internet access when associated. |
| Private IP Address | The primary private IPv4 address assigned to the ENI is used for internal communication within the VPC. |
| Instance ID | The EC2 instance ID to which the ENI is attached. |
| Attachment Status | The attachment status of the network interface to the instance. Possible values: attaching, attached, detaching, detached. |
| Status | The current operational status of the ENI. Possible values: available, associated, attaching, in-use, detaching. |
| ENI TRAFFIC DETAILS | |
| ENI ID | The unique identifier assigned to the Elastic Network Interface (ENI). |
| Data In | The total amount of incoming data received by the ENI between the poll interval (in MB/s). |
| Data Out | The total amount of outgoing data transmitted from the ENI between the poll interval (in MB/s). |
| Packets In | The total number of network packets received by the ENI between the poll interval (in packets/s). |
| Packets Out | The total number of network packets transmitted from the ENI between the poll interval (in packets/s). |
| Average Packet Received Size | The average size of network packets received by the ENI between the poll interval, representing the typical inbound packet payload (in MB). |
| Average Packet Sent Size | The average size of network packets transmitted from the ENI between the poll interval, representing the typical outbound packet payload (in MB). |
| ENI REQUEST DETAILS | |
| ENI ID | The unique identifier assigned to the Elastic Network Interface (ENI). |
| Rejected Requests | The total number of rejected flow requests observed on the ENI between the poll interval. |
| Accepted Requests | The total number of network requests successfully allowed by the ENI between the poll interval. |
| Skipped Records | The total number of network traffic records skipped for the ENI between the poll interval. |
| No Data Records | The total number of network traffic records with no data available for the ENI during the selected poll interval. This may occur due to no network activity, delayed traffic logs, or missing flow log records. |
| Average Request Duration | The average time taken to process network requests on the ENI between the poll interval, indicating request-level network latency (in seconds). |
Configuration
| Parameter | Description |
|---|---|
| State | Indicates the current operational status of the VPC. For example, Available means the VPC is active, and resources can be deployed within it. |
| Default VPC | Specifies whether the VPC is the default VPC created automatically by AWS for the account in the selected region. |
| CIDR Range | The IPv4 CIDR block assigned to the VPC. This range defines the private IP address space available for resources launched within the VPC. |
| DHCP Options ID | The identifier of the DHCP options set associated with the VPC. DHCP options control network configuration settings, such as domain name servers and domain names for instances launched in the VPC. |
| VPC Internet Gateway Block Mode | Indicates whether internet access through an attached Internet Gateway is restricted or blocked for the VPC. |
| Network Address Usage Settings | Shows whether network address usage tracking is enabled for the VPC. When enabled, it provides insights into IP address utilization within the VPC. |
| Flow Log Configuration | Indicates whether VPC Flow Logs are enabled for the VPC. Flow Logs capture information about the IP traffic going to and from network interfaces in the VPC. |
| Flow Log Configuration | |
| Flow Log Format Valid | Indicates whether the configured flow log format matches the expected format required for this VPC. |
| Flow Log Format | Displays the format configured for the VPC flow logs. |
| Flow Log S3 Bucket Name | Shows the Amazon S3 bucket name where the VPC flow logs are stored. |
| Athena Database Name | Displays the Amazon Athena database used for querying the VPC flow logs. |
| Athena Table Name | Displays the Amazon Athena table used for querying the VPC flow logs. |
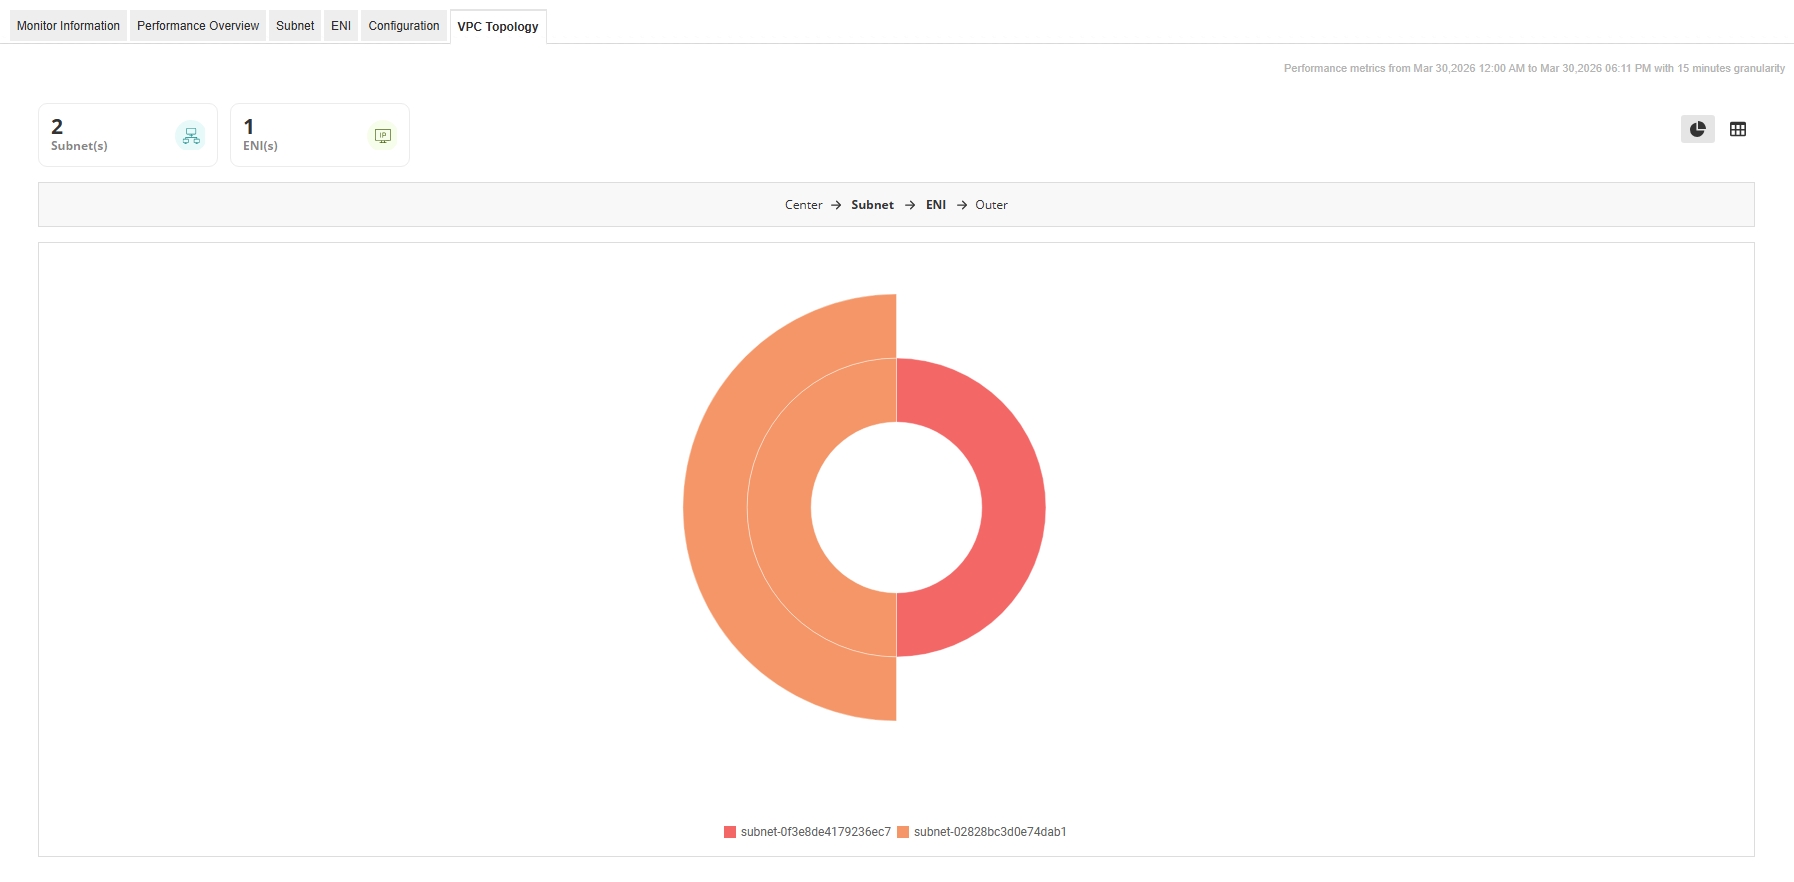
VPC Topology
- Displays a graphical topology view of the Amazon VPC, illustrating the relationship between the VPC, its subnets, and the associated Elastic Network Interfaces (ENIs).
- The topology is organized in layers, where the VPC appears at the center, subnets form the intermediate layer, and ENIs appear as outer nodes connected to their respective subnets.
- This visualization helps you quickly understand the distribution of ENIs across different subnets and identify subnet-level resource placement.
- You can switch between Chart View for a visual topology representation and Table View to see a structured list of subnets and their associated ENIs.
- The table view also allows you to search for specific subnets or ENIs and view their relationships within the VPC.