RUM Dashboard
Applications Manager's RUM dashboards help you understand your user interactions in your web applications at a single glance. You can obtain a holistic view of the status of your Real User Monitoring applications using our customizable dashboard. RUM dashboard lists all your active, inactive applications, along with those that are in Critical, Warning, or Clear state. Details of every aspect of your web applications can be assessed using various tabs on the page.
Monitored Parameters
Go to the Monitors Category View by clicking the Monitors tab. Click on Real User Monitor under the Web Server/Services table. The Real User Monitor bulk configuration view is displayed, distributed into three tabs:
- Availability tab gives the Availability history for the past 24 hours or 30 days.
- Performance tab gives the Health Status and events for the past 24 hours or 30 days.
- List view enables you to perform bulk admin configurations.
The following is the list of metrics shown in the Real User Monitor in their corresponding tabs:
Note: Real User Monitor does not show ISP and Region details by default. A third-party geolocation API needs to be purchased and configured in DEM Collector to obtain the data. Learn more
Summary
| Parameter | Description |
|---|---|
| Summary Report - World View - Displays a real-time graphical representation of the overall Apdex score, average response time, page views, and global error count. Users can select a country from the dropdown menu to view summary reports for that specific location. | |
| Apdex Score | Apdex is a measure of response time against a set threshold. It measures the ratio of satisfactory response times to unsatisfactory response times. The Apdex Score is calculated using the following formula: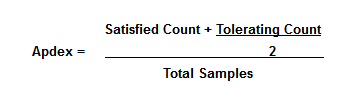 |
| Avg. Response Time | The average response time is defined as the time between issuing a web page request to the system and the page becoming visible to the user (in ms). |
| Page Views | Number of times users have visited the web page. |
| Throughput | The number of requests served per minute for the chosen time frame (in cpm). |
| Error Count | Total number of errors that occurred on the webpage. |
| Response Time | |
| Redirection Time | The measurement of how long it takes the site to redirect from one URL to another before the page is fetched. |
| DNS Time | The time taken to resolve the URL domain name to the IP address. |
| Connection Time | Server Connection Time is the interval between the time that a user initiates a request and the start of fetching the response document from the server. This includes time spent on redirects, domain lookups, TCP connections, and SSL handshakes. |
| First byte Time | The total time between establishing a connection to the server and the first response starting to come in for the page (in milliseconds). |
| Server Time | The server request processing time. |
| Document Download Time | The time for the browser to download the complete HTML document content. |
| Page Rendering Time | The total time between opening a page (opening a new URL, clicking a link, opening a new workflow, or refreshing a page) and the availability of a page in the browser. |
| Document Rendering Time | The time for the browser to build the Document Object Model (DOM). |
| Overall Response Time | The total response time is defined as the time between issuing a web page request to the system and the page becoming visible to the user (or the time taken for an application to complete an activity) |
Geographic
| Parameter | Description |
|---|---|
| Summary Report - World View - Displays a real-time graphical representation of the overall Apdex score, average response time, page views, and global error count. Users can select a country from the dropdown menu to view summary reports for that specific location. | |
| Geographic Summary | |
| Country | The country where the End User/Client is located. |
| Apdex Score | Apdex is a measure of response time against a set threshold. It calculates the ratio of satisfactory response times to unsatisfactory response times. |
| Avg. Response Time | Average time taken by the application to respond to the request from the location (in ms). |
| Page Views | Number of times users have visited the web page from the specified location. |
| Throughput | The number of requests served per minute for the chosen time frame (in cpm). |
Note: Click on the name of a Country to view a graphical representation of its response time and throughput, and delve into the statistics of its regions with the Country Summary.
| Country Summary | |
| Region Name | The region where the End User/Client is located. |
| Apdex Score | Apdex is a measure of response time against a set threshold. It calculates the ratio of satisfactory response times to unsatisfactory response times. |
| Avg. Response Time | Average time taken by the application to respond to the request from the location (in ms). |
| Page Views | Number of times users have visited the web page from the specified region. |
| Throughput | The number of requests served per minute for the chosen time frame (in cpm). |
ISP
| Parameter | Description |
|---|---|
| Response Time By ISP - Displays a graphical representation of the list of ISPs with respect to their response times. | |
| ISP Summary | |
| ISP Name | The name of the Internet service provider. |
| Avg. Response Time | Average time taken by the application to respond to the request from the ISP (in ms). |
| Total Count | Number of times users have visited the web page from the ISP. |
| Throughput | The number of requests served per minute for the chosen time frame (in cpm). |
Browser
| Parameter | Description |
|---|---|
| Response Time By Browser - Displays a graphical representation of the list of browsers with respect to their response times. | |
| Browser Usage Split Up - Displays a graphical representation of the list of browsers with respect to their usage. | |
| Browser Summary | |
| Browser Name | The name of the browser. |
| Avg. Response Time | Average time taken by the application to respond to the request from the browser (in ms). |
| Total Count | Number of times users have visited the web page from the browser. |
| Throughput | The number of requests served per minute for the chosen time frame (in cpm). |
Click on the browser name to view the graphical representation of the response time and the throughput for that browser along with its version details.
Device Type
| Parameter | Description |
|---|---|
| Response time by Device - Displays a graphical representation of the list of devices with respect to their response times. | |
| Device Usage Split Up - Displays a graphical representation of the list of devices with respect to their usage. | |
| Top Viewport | Visual area of the webpage in a browser. |
| Connection Type | Type of connection used to establish a connection with the server. |
| Device Memory | Amount of memory present in the device (in GiB). |
| Device Summary | |
| Device Name | The name of the device. |
| Avg. Response Time | Average time taken by the application to respond to the request from the device (in ms). |
| Total Count | Number of times users have visited the web page from the device. |
| Throughput | The number of requests served per minute for the chosen time frame (in cpm). |
Click on the device name to view the graphical representation of the response time and the throughput for that device.
Web Pages
| Parameter | Description |
|---|---|
| Web Transactions | |
| Transaction Name | The name of the transaction. |
| Avg. Response Time | Average time taken by the application to respond to the request (in ms). |
| Total Count | Number of times users have visited the web page. |
| Throughput | The number of requests served per minute for the chosen time frame (in cpm). |
| Avg. Page Size | Average size of the webpage (in kB). |
Click on the transaction name to view the summary of the key performance metrics (like Apdex score, Response Time, Page Views, and Throughput) for that transaction along with the details of its corresponding Ajax calls.
User Sessions
| Parameter | Description |
|---|---|
| Avg. Pages Navigated | Average number of pages that were navigated during the session. |
| Avg. Viewing Time | Average amount of time for which the pages were viewed during the session (in ms). |
| Total Users | Total number of unique users who visited the web page. |
| Active Sessions | Total number of Active sessions |
| Live Sessions | Total number of Live sessions |
| Total Sessions | Total number of sessions that are established. |
| User Sessions | |
| Start Time | Timestamp at which the session was started. |
| User ID | Unique Identifier used to identify the user. |
| User Name | Name of the user establishing the session. Refer here to know more about how to capture the user name using API support in Real User Monitor. |
| IP Address | The IP Address of the device from which the session was established. |
| Browser Name | Name of the browser from which the session was established. |
| Device Name | Name of the device from which the session was established. |
| Country | Name of the country from which the session was established. |
| Pages Navigated | Number of pages that were navigated during the session. |
| Viewing Time | Amount of time for which the pages were viewed during the session (in ms). |
Click on the session to view the summary of the session details and the list of transactions present in that session along with their corresponding response time split-ups.
Session Details
| Parameter | Description |
|---|---|
| User ID | The User ID associated with the transaction. |
| User ID | Timestamp at which the transaction started. |
| User Experience | Indicates the overall quality of the end user's experience during the session. |
| Session Details | |
| Transaction Time | Timestamp at which the transaction occurred. |
| Transaction Name | Name of the transaction associated with the page request. |
| Page Type | The type of page associated with the transaction. Possible types include:
|
| Avg. Response Time | Average time taken to complete the transaction (in ms). |
| Redirection Time | Time taken to complete the redirection associated with the transaction (in ms). |
| DNS Time | Time taken to resolve the domain name through DNS (in ms). |
| Connection Time | Time taken to establish a connection with the server (in ms). |
| Server Time | Time taken by the server to process the request and generate a response (in ms). |
| First Byte Time | Time taken to receive the first byte of the response from the server (in ms). |
| Document Download Time | Time taken to download the document from the server (in ms). |
| Page Rendering Time | Time taken to render the page (in ms). |
| Document Rendering Time | Time taken to render the document (in ms). |
Resources
| Parameter | Description |
|---|---|
| First Party / Third Party / CDN Resources | |
| Domain Name | Name of the domain for which the request has been sent. |
| Avg. Resource Size | Average size of the resource (in kB). |
| Avg. Response Time | Average time taken for the domain to respond (in ms). |
| Total Count | Total number of resources present in that domain. |
Click on the arrow adjacent to the domain name to view the graphical representation of the response time and the total count for the different types of resources (XHR, JS, IFRAME, IMG, CSS, etc.) available in that domain.
Ajax Calls
| Parameter | Description |
|---|---|
| Ajax Calls | |
| Transaction Name | Name of the transaction. |
| Avg. Response Time | Average time taken by the application to respond to the request (in ms). |
| Total Count | Number of times users have visited the web page. |
| Throughput | The number of requests served per minute for the chosen time frame (in cpm). |
| Avg. Resource Size | Average size of the resource (in kB). |
| 1xx | Number of Information responses. |
| 2xx | Number of Successful responses. |
| 3xx | Number of Redirection messages. |
| 4xx | Number of Client Error responses. |
| 5xx | Number of Server Error responses. |
Click on the transaction name to view the summary of the key performance metrics (like Apdex score, Response Time, Page Views, and Throughput) for that Ajax transaction.
JavaScript Errors
| Parameter | Description |
|---|---|
| Errors | Total number of errors that occurred. |
| Pages | Total number of pages in which the error has occurred. |
| Files | Total number of files in which the error has occurred. |
| Users | Total number of affected users for whom the error has occurred. |
| Errors vs Affected Users Graph - Displays a graphical representation of users and the corresponding errors with respect to their total counts. | |
| JavaScript Errors | |
| Errors | Displays complete details about the type of JavaScript errors, the URL location of the error, and the timestamp of its last occurrence, along with their count. |
| Type | Displays the list of error types that occurred along with their error count. |
| File | Displays the list of files in which the error has occurred along with their error count. |
| Page | Displays the list of pages in which the error has occurred along with their error count. |
| Browser | Displays the list of browsers in which the error has occurred along with their error count. |
| User | Displays the list of affected users for which the error has occurred along with their error count. |
| Domains | Displays the list of domains in which the error has occurred along with their error count. |
Click on the JavaScript Errors to get details about the error, like the list of files, pages, browsers, devices, and users where the error exists, along with their corresponding timestamps.