Overview
ManageEngine provides end-to-end visibility into every request, from API gateway to database, with rich code-level context and built-in correlation across traces, logs, and infrastructure metrics.
ManageEngine traces every transaction across your entire service graph with deep code-level context and correlation across traces, logs, and infrastructure metrics.
ManageEngine provides end-to-end visibility into every request, from API gateway to database, with rich code-level context and built-in correlation across traces, logs, and infrastructure metrics.
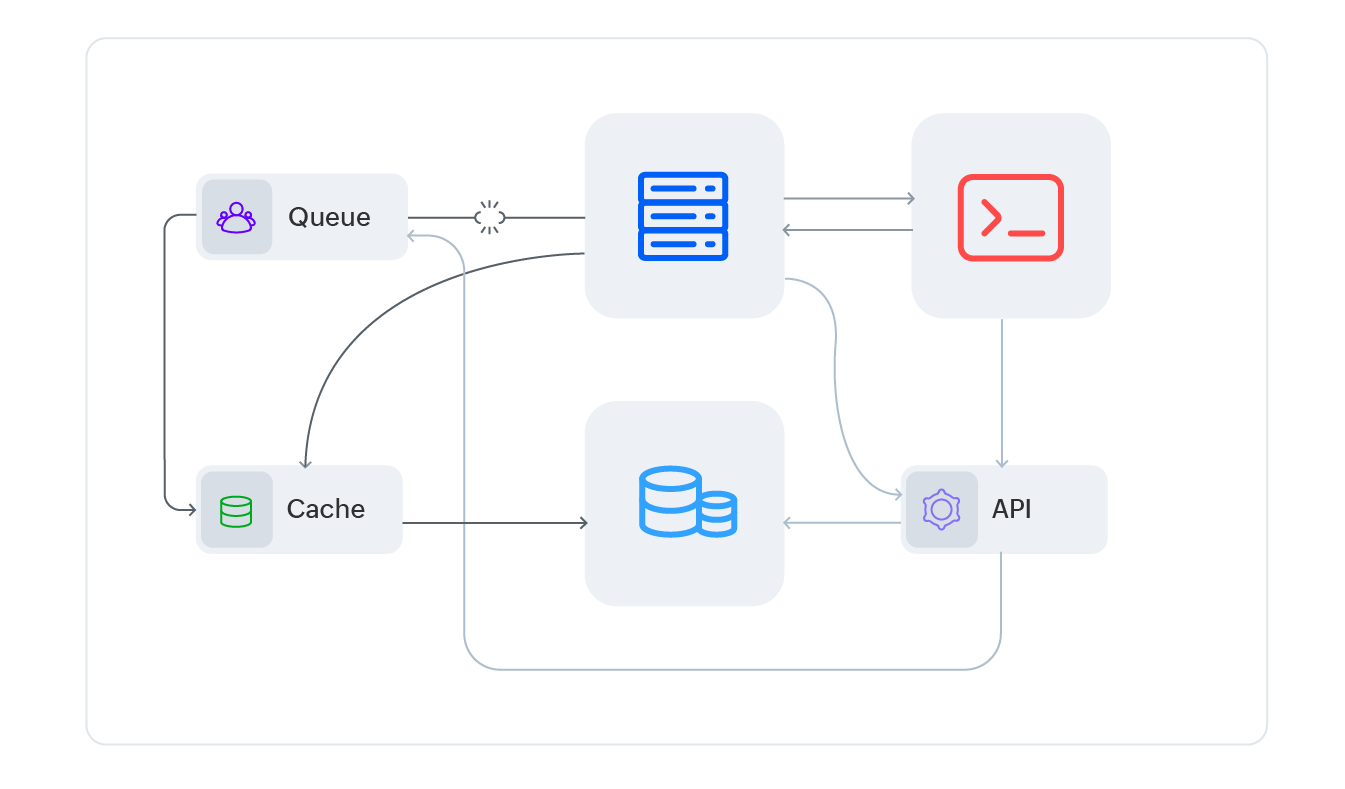
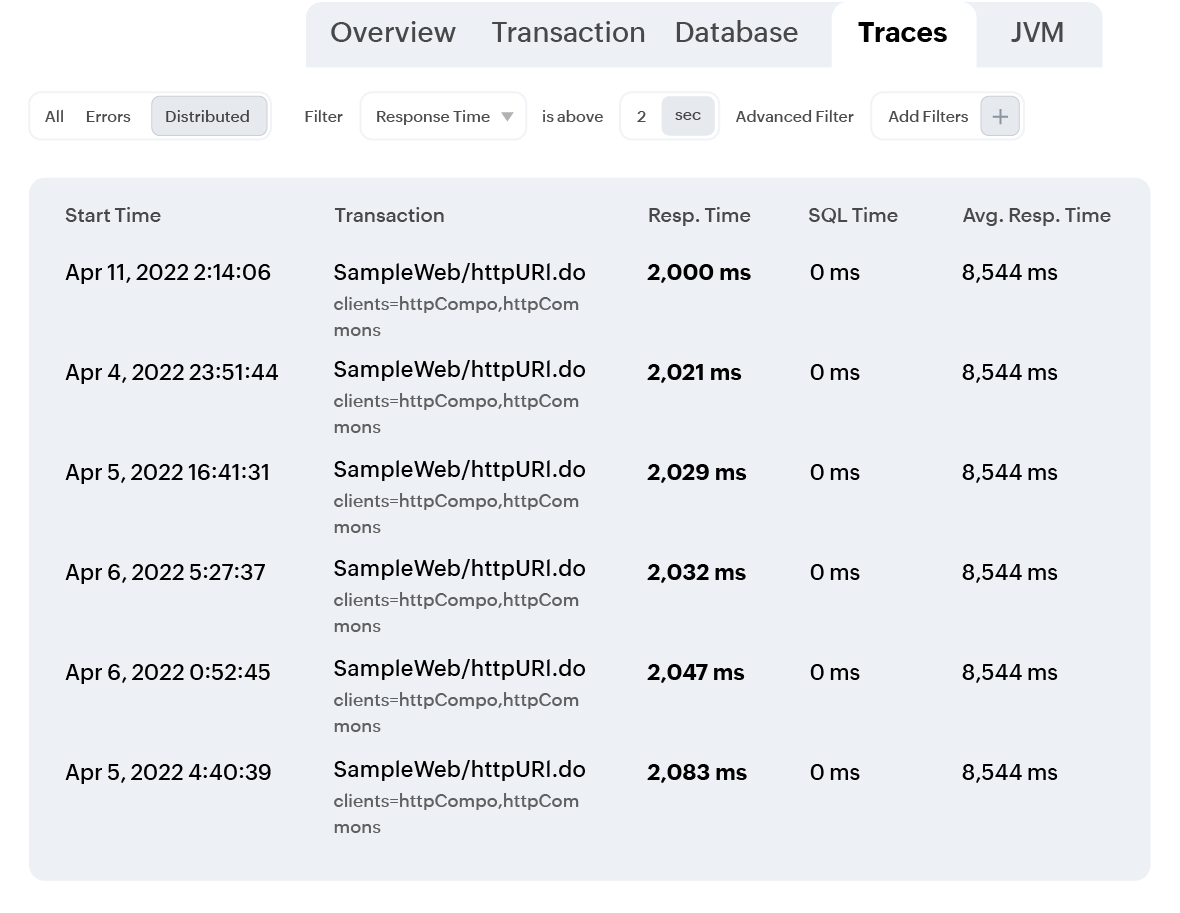
Every trace shows the complete request journey across all services, from API gateway to database, with precise span timings, parent-child relationships, and threshold breach indicators. One view replaces hours of log correlation across services.
Click into any service span and expand the call tree to view individual method executions, database queries, and exceptions. Understand which specific code block crossed your latency threshold, not just which service was responsible
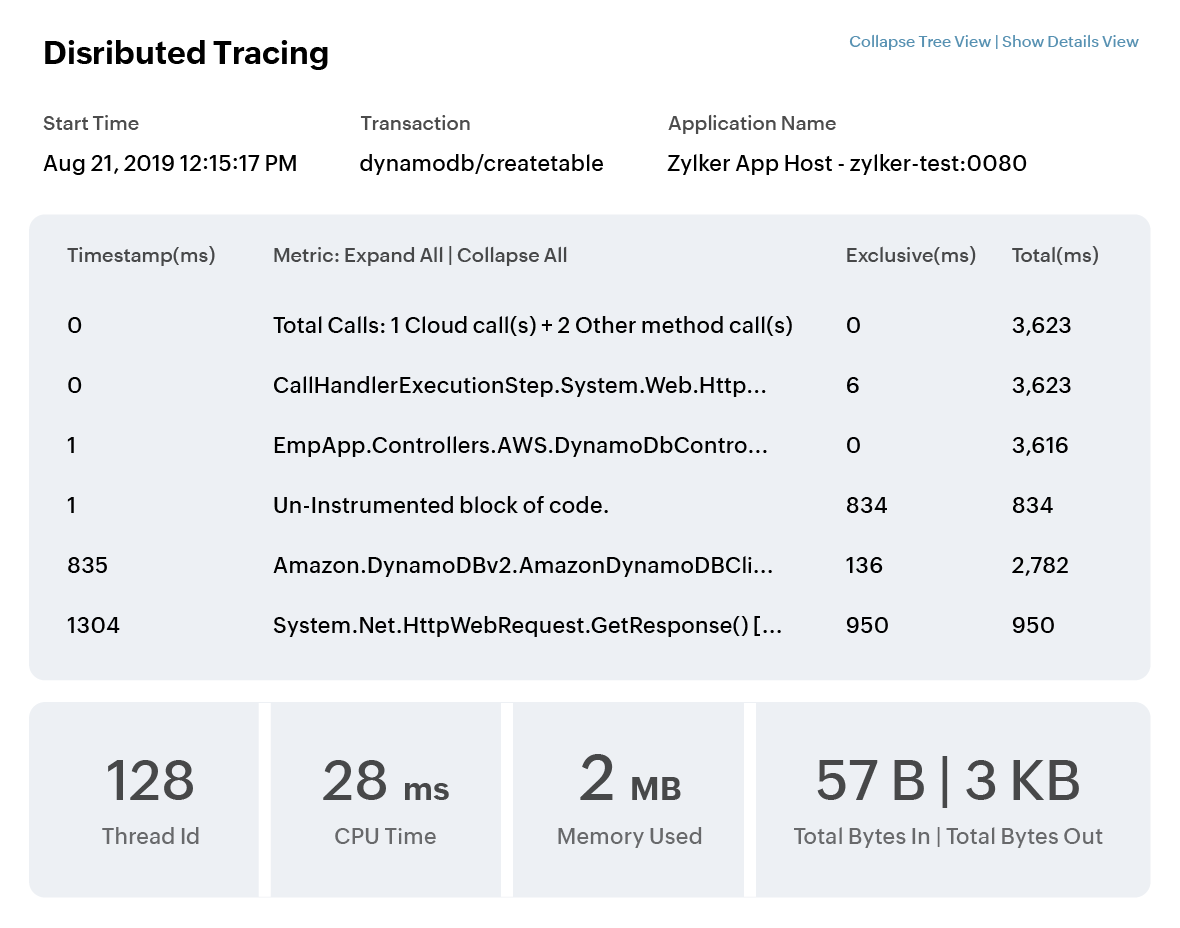
Correlate traces with logs and front-end and back-end metrics including CPU, memory, and response times in a single view to identify the root cause of infrastructure issues quickly, without switching between tools.
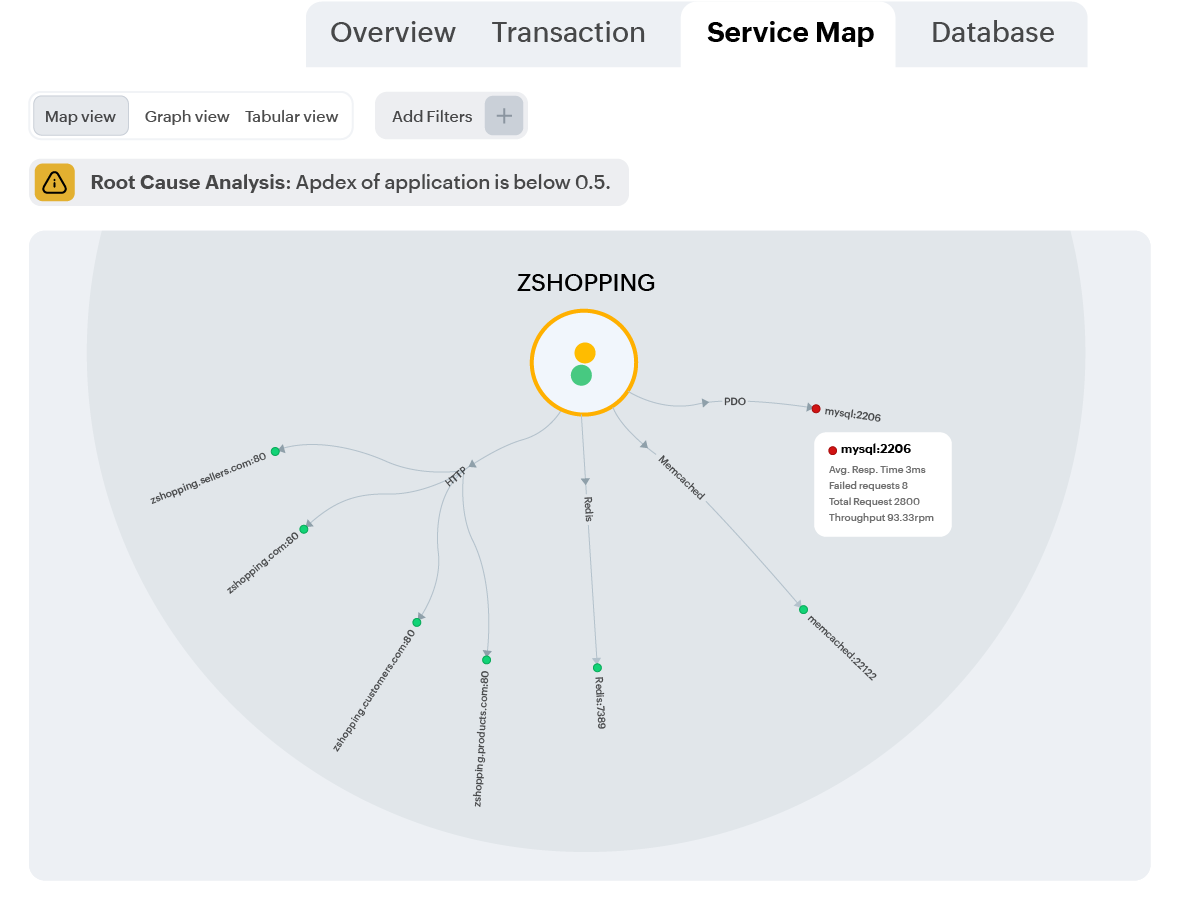
Trace data automatically feeds into application dependency maps, giving you a live view of interdependencies between services, databases, and external resources. Detect transaction failures or degraded components at a glance and isolate the source of an issue fast.
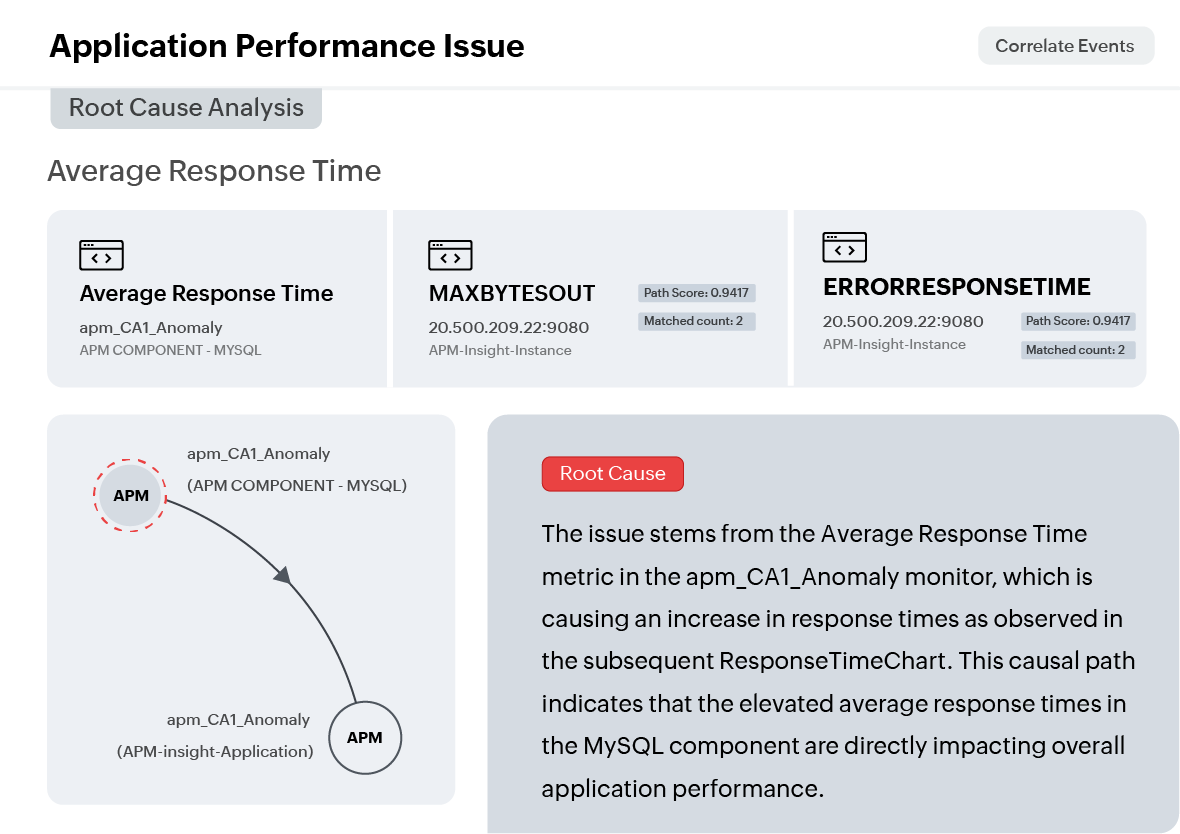
Leverage AI to detect anomalies like unusual performance patterns and deviations proactively before they impact users. Trace the root cause down to the exact line of code with AIOps, and reduce alert fatigue with intelligent alert prioritization.
Designed for engineers who need to find and fix production issues fast.
Install the full-stack agent and distributed tracing is on immediately, with no manual span creation, no YAML configuration, and automatic HTTP header propagation across all instrumented services.
Already using OpenTelemetry SDKs? Ingest traces, metrics, and logs directly into ManageEngine without forklift changes, across every supported language and framework.
Expand any span into a full method call tree to see the exact database queries, cache lookups, and code blocks that crossed your latency threshold, not just which service was slow.
Yes. ManageEngine integrates with any OpenTelemetry-supported language or framework and ingests traces, metrics, and logs. You can use OpenTelemetry SDKs for instrumentation and send data directly to the platform for unified analysis and visualization.
Most developers see their first trace within 5 minutes. Install the full-stack agent for your runtime and automatic instrumentation handles HTTP, database, and external service spans. No manual span creation needed to get started.
Traces are captured when a request exceeds the configured latency threshold in any participating service. You control the threshold per application in your APM Insight settings.
Yes. Proxy services between instrumented applications must pass through the trace headers in both request and response. Without this, the trace chain breaks at the proxy boundary.
Yes. Distributed tracing works across all 7 supported language runtimes within the same account. A Java service calling a Node.js service, which in turn calls a Python service, produces a single correlated trace timeline.
Start your free 30-day trial of OpManager Nexus and centralize observability for distributed environments.
Start your free trial