Full-stack observability: How to gain end-to-end visibility across modern IT environments
Applications are distributed across hybrid- and multi-cloud infrastructures. Services are containerized, ephemeral, and interdependent at a speed that documentation cannot keep up with. The number of components generating operational data has grown exponentially. Observability is the response: A way to see what is happening across the entire IT environment.
However, our survey tells a different story.
According to ManageEngine's 2025 State of Observability report, which surveyed 1,240 IT leaders and practitioners, gaining end-to-end visibility into distributed and hybrid IT environments is the most cited reason organizations adopt observability (reported by 67.3% of respondents). Yet when asked which metrics actually improved after adoption, visibility across the IT stack ranked among the least improved outcomes. When asked about top priorities for the next twelve months, achieving full-stack visibility came first, at 57%.
This article examines what full-stack visibility is, why visibility fails even after significant investment, what it actually requires across the telemetry infrastructure, and what practical steps organizations can take to close the gap.
What is full-stack visibility?
Full-stack visibility is the ability to monitor and understand the state, performance, and dependencies of every layer of your IT environment in real time, including: applications, infrastructure, networks, services, and the relationships between them.
What does lack of full-stack visibility look like in practice?
During high-severity incidents and outages
Major incidents starkly expose partial visibility and fragmented tooling. Heroku's June 10, 2025 outage is a good example. A subtle networking change and missing routes created widespread customer impact, while also affecting internal tools and the status page. Engineers were left without a clean, end-to-end picture of what was failing and why. They had to manually compare healthy vs. unhealthy hosts and trace the issue back to an automatic package upgrade. Public postmortems show the same pattern: A shared service (S3 or DNS) fails, and dependent teams cannot see the blast radius across services and user journeys. Teams have monitoring on isolated components but no rapid way to see which downstream services and business flows are affected.
During alert handling and on-call response
According to our State of Observability report, "actionable alerts with minimal noise" is the top-voted improvement teams wish to see in their observability tools. The problem is that alerts fire without carrying enough context to support a confident response. For example, an on-call engineer receives a notification that error rates have exceeded a threshold. The alert confirms something is wrong. It does not say which user journeys are affected, whether the issue is isolated or cascading, or what a reasonable first response looks like. Engineers begin to distrust alerts that consistently fail to provide actionable context. Alerts get muted, thresholds get raised, and the on-call rotation accumulates into burnout.
During day-to-day debugging and development workflows
Visibility gaps also show up in developers' routine work oftrying to understand how their code behaves in production. The typical debugging workflow involves navigating between disconnected systems—logs in one platform, traces in another, and infrastructure metrics in a third—each with different naming conventions and query languages. Without coherent, queryable telemetry, developers cannot ask new questions of their data.
Why do organizations struggle to achieve full-stack visibility?
Tool fragmentation and data silos
Typically, observability platforms are not intentionally built. They are accumulated by ad-hoc point tool adoptions. A metrics stack gets adopted early. A logging platform follows. Security brings its own analytics. The cumulative result is telemetry about the same system living across four or five platforms, each with its own schema, naming conventions, and query interface.
Data overload masking signals
As observability platforms have become easier to instrument, the default posture in many organizations has shifted toward collecting everything, turning the telemetry data volume itself into a visibility barrier. Observability becomes a data analytics problem at a certain scale: Telemetry is plentiful, but without good queryability, context, and summarization, teams remain data-rich but insight-poor.
Missing correlation across telemetry pillars
Collecting metrics, logs, and traces is necessary, but collection alone is not sufficient. When these pillars are stored in separate systems without shared identifiers (consistent service names, propagated trace IDs, and common tagging conventions), moving between them during an investigation requires manually transcribing values from one system into another. Each transition introduces friction and the opportunity for error. Organizations that have invested significantly in observability infrastructure frequently find that Mean Time to Resolve (MTTR) remains stubbornly high for exactly this reason.
Organizational misalignment across Dev, Sec, and Ops
Application, infrastructure, network, and security layers are typically owned by different teams making independent decisions about tooling and instrumentation standards. Development teams build dashboards oriented around their own workflows. Operations teams own the observability platform but have limited application-level visibility. Security maintains a separate analytics stack. Each group holds a partial view. When a cross-layer issue occurs, the investigation requires coordination across teams unaccustomed to working from shared data.
Economic pressure eroding critical telemetry
When teams collect more data than they can effectively analyze, organizations end up paying observability bills that outweigh the business value they are supposed to extract from that spending. Budget pressure follows, and the trade off is rarely framed clearly: Shortening log retention from ninety days to fourteen feels reasonable until a post-incident review requires data from three weeks ago that no longer exists. Aggressive trace sampling feels efficient until a rare but critical error pattern disappears from the sampled dataset entirely. The telemetry most valuable for understanding rare, high-impact events is also, unfortunately, the most expensive to retain.
What full-stack visibility actually requires
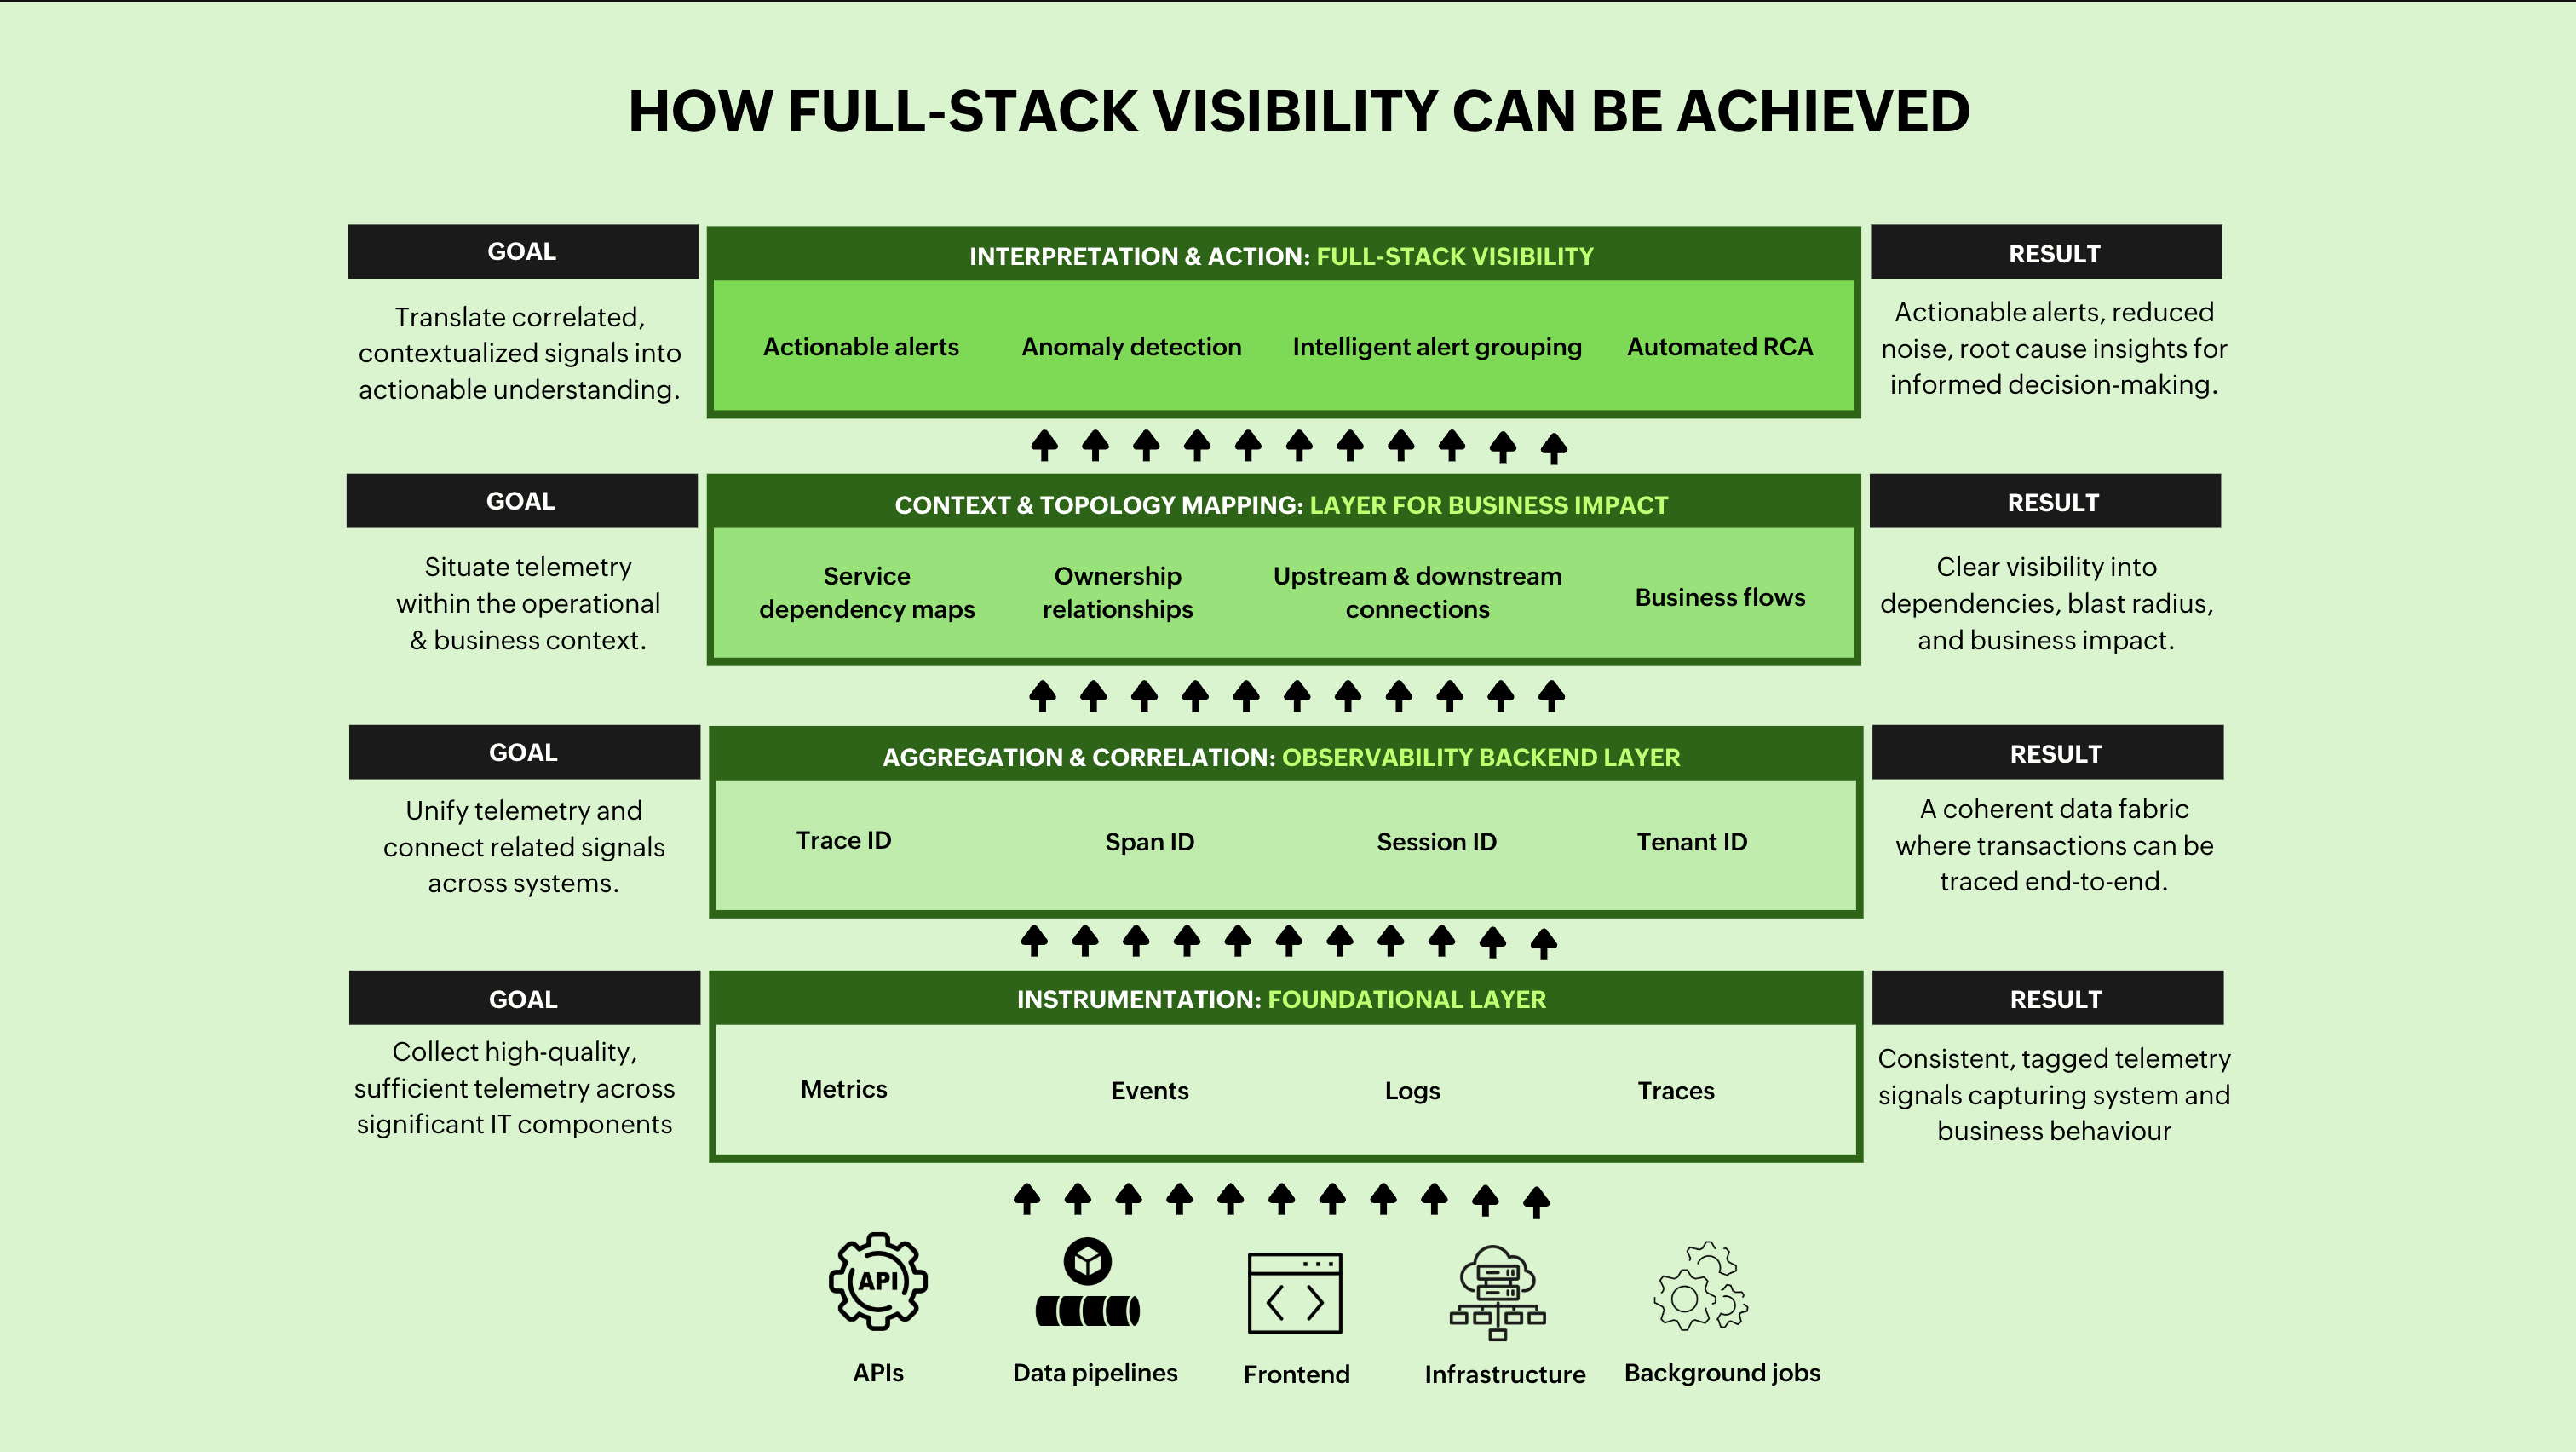
Full-stack visibility is the compound result of four distinct layers.
Instrumentation
Aggregation and correlation
Context and topology mapping
Interpretation and action
Instrumentation means the system emits sufficient, high-quality telemetry (metrics, logs, traces, events) across significant components: APIs, background jobs, data pipelines, frontends, infrastructure. High-quality means signals are consistent, tagged (service, environment, region), and capture both technical and business dimensions: latency and error rates alongside, for example, orders, logins, and failed payments. When something goes wrong, you should rarely need to add new logging to understand what happened.
Aggregation and correlation are about turning that raw telemetry into a coherent data fabric. Aggregation means ingesting and storing metrics, logs, events, and traces in a small number of logically unified backends that share an identity model for services, environments, regions, versions, teams, and tenants. Correlation sits on top of that: The deliberate use of common identifiers—primarily trace and span IDs, and secondarily user, session, or tenant IDs—so that a single transaction can be followed end-to-end across layers and telemetry types.
Context and topology mapping situates telemetry signals within a model of the environment—capturing service dependencies, ownership, and the relationships between technical components and the business flows they support. A correlated signal tells you what is happening and where. Topology mapping tells you what it means, including: which upstream and downstream services are affected, which user journeys are at risk, and what the potential business impact is. In dynamic environments with containerized workloads and microservices architectures, this layer requires dynamic discovery: Dependency maps built from live telemetry rather than manually maintained records.
Interpretation and action is the layer at which correlated, contextualized signals are translated into actionable understanding. Even well-instrumented, well-correlated telemetry fails here if it is not surfaced in a form that supports decision-making. Alert design is one dimension, with an alert carrying information about affected user journeys, contributing services, and relevant recent changes reduces the interpretive burden on the engineer receiving it. AIOps capabilities (anomaly detection, intelligent alert grouping, automated root cause analysis) operate here as force multipliers, but their reliability is directly proportional to the quality of the layers beneath them.
Five practical measures to achieve full-stack visibility
1. Adopt a unified telemetry standard
OpenTelemetry (OTel) has emerged as the industry standard for consistent instrumentation across heterogeneous environments. As a vendor-neutral framework for collecting and exporting metrics, logs, and traces, it provides a consistent instrumentation layer across languages, frameworks, and platforms, and decouples instrumentation from any specific observability backend, removing the vendor lock-in that has historically fragmented telemetry across teams. Adopting OTel means establishing it as the instrumentation baseline for new services, migrating existing services over time, and configuring the OpenTelemetry Collector to enforce tagging conventions and sampling policies as structural properties of the pipeline. The technical standard and the organizational standard—agreed naming, attribute schemas, environment tags—need to be adopted together.
2. Consolidate toward a unified observability platform
Cross-telemetry investigation is possible only when metrics, logs, and traces share a common data model, identity layer, and query interface. Consolidation does that job by reducing the number of separate platforms across which telemetry is distributed. The trade offs need honest consideration. Unified platforms introduce vendor dependency, while best-of-breed approaches offer deeper functionality at the cost of integration complexity. The evaluation criteria worth prioritizing are whether the platform provides cross-telemetry correlation, whether its data model supports tagging conventions, whether its cost structure scales manageably, and whether it ingests OTel-formatted telemetry natively. Consolidation does not require replacing every tool immediately. Starting with the telemetry types most critical to incident investigation and expanding from there is a sensible path.
3. Design correlation as an architectural decision
A common assumption is that correlation is something an observability platform provides. In practice, platforms can only correlate what the telemetry architecture makes correlatable. If signals arrive without shared identifiers, the platform has nothing to connect them by.
The foundational requirement is a shared identity model:
Service names that are consistent across metrics, logs, and traces
Trace and span identifiers propagated into log entries at the point of emission
Environment, region, and deployment identifiers applied uniformly across all telemetry types
Pipeline-level enrichment extends this further. The OTel Collector can be configured to add business context (tenant identifiers, feature flags, SLO tier) before telemetry reaches the backend. The organizational complement to this technical work is standardizing investigation paths. Documented workflows that tell engineers where to start, where to go next, and what identifiers to carry between systems. These workflows build the muscle memory that makes correlation tooling effective.
4. Apply intelligent sampling and cost-aware telemetry strategies
The key here is knowing which telemetry to reduce.
Tail-based sampling applies that logic to traces. Rather than deciding upfront whether to retain a trace, the decision is deferred until the trace completes, at which point its characteristics (an error, a latency outlier, a request through a recently deployed service) determine whether it is retained at full fidelity or sampled away. Routine successful requests through stable paths can be aggressively sampled without meaningful visibility loss.
Log retention benefits from the same differentiation. Error and warning severity logs from business-critical services warrant longer retention windows than verbose debug output from stable, low-risk systems. Configuring retention at this level of granularity preserves the telemetry most likely to be needed for post-incident analysis while managing storage costs in proportion to actual risk. The broader discipline is treating observability itself as a monitored system: Tracking telemetry volume and cost by service and team, so that cost control and visibility goals are weighed against each other explicitly.
5. Build for human-centered interpretation
An alert that names affected user journeys, contributing services, and relevant recent changes gives the responding engineer a starting point. AIOps capabilities extend this: Intelligent alert grouping, anomaly detection, and automated RCA reduce noise and accelerate diagnosis. Beyond tooling, runbooks that connect observability patterns to concrete investigation steps reduce dependence on organizational memory, and post-incident reviews that examine whether observability surfaced the right signals at the right time create a feedback loop that improves every subsequent response.
Conclusion
The data points to a consistent pattern: Full-stack visibility drives observability adoption, yet remains the least improved outcome years into that investment.
Platforms have been deployed and pipelines built, but the structural conditions visibility depends on have not received the same attention. Closing the gap calls for a layered approach; understanding what is limiting visibility at a specific layer and fixing it in a way that enables what sits above it.
Frequently asked questions (FAQs)
What is the difference between full-stack visibility and full-stack observability?
Observability is the infrastructure: metrics, logs, traces, and events. Full-stack visibility is the operational outcome. You can have extensive observability infrastructure without achieving visibility if the structural conditions for correlation, context, and interpretation are not in place.
Why is full-stack visibility difficult to achieve despite observability investments?
The most common reasons are structural. Tool fragmentation distributes telemetry across platforms that cannot be correlated. Data volume grows faster than the capacity to interpret it. Metrics, logs, and traces are collected without the shared identity model required to connect them. Organizational boundaries between Dev, Sec, and Ops reproduce fragmentation at the human level. Cost-driven sampling and retention decisions reduce coverage in areas that prove critical during high-impact events. These forces compound each other, which is why addressing any one in isolation produces limited results.
What role does AIOps play in achieving full-stack visibility?
AIOps capabilities—anomaly detection, intelligent alert grouping, automated root cause analysis—operate at the interpretive layer of full-stack visibility, reducing the cognitive burden on engineering teams and accelerating the path from signal to diagnosis. Their effectiveness is directly dependent on the quality of the layers beneath them. In environments where instrumentation is inconsistent and correlation is weak, AIOps tools operate on incomplete data and produce unreliable outputs.