Fragmented Azure visibility? One Azure monitoring tool that tracks every layer
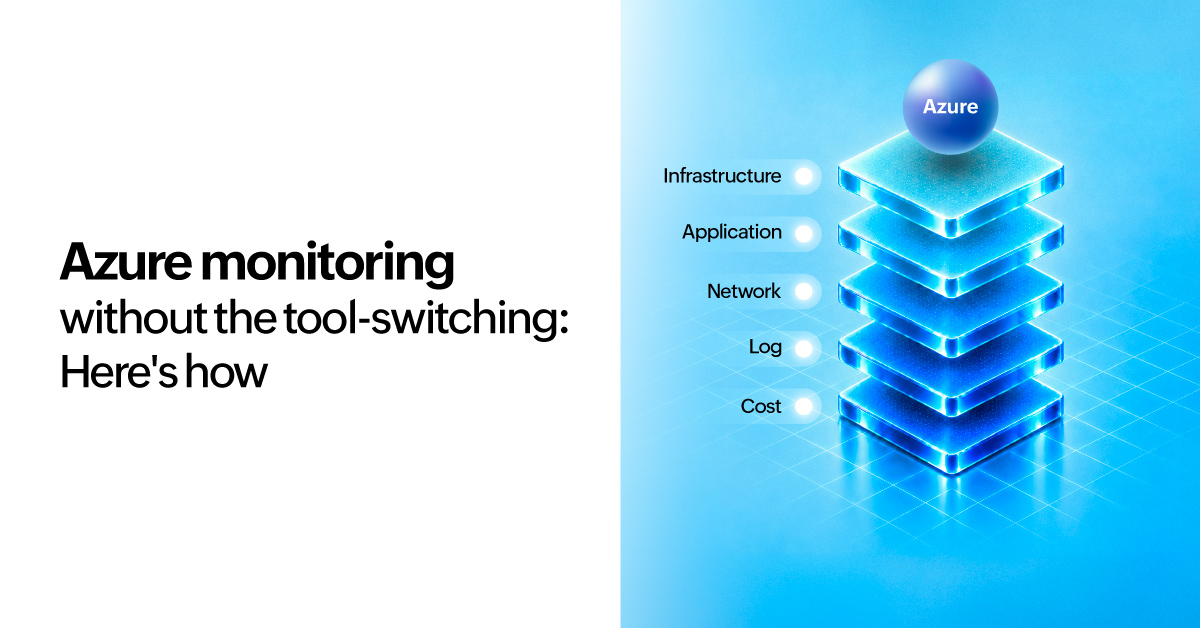
Most Azure monitoring setups look the same: Azure Monitor for metrics, Application Insights for apps, Log Analytics for logs, a separate tool for network, and another for cost. Each works in isolation. None of them talk to each other when something breaks.
The Azure monitoring tool in ManageEngine OpManager Nexus consolidates infrastructure, application, network, log, and cost visibility data into a single console. Now you can correlate a performance issue across layers without switching tools or waiting for someone else's data export.
When infrastructure and app layer incidents collide
A CloudOps team is mid-sprint when users start reporting latency on a customer-facing API. The engineer on call opens Azure Monitor. VM CPU is fine, so that's not it. Application Insights shows elevated response times, but the trace cuts off at the database call. The database logs are in Log Analytics—different workspace, different query syntax. He's now forty minutes in and still doesn't have a root cause.
That's not an edge case. That's what cross-layer investigation looks like when your monitoring is split across the native Azure stack.
OpManager Nexus keeps that chain in one place. When response times spike on the API, the application trace, the AKS pod it ran on, the VM performance at that timestamp, and the database query logs are all in the same console. Zia AI flags the anomaly at the database layer before the alert volume builds. The on-call engineer opens one dashboard instead of three.
Why Azure monitoring fragments across tools and why that's a problem
Azure's native monitoring stack is deep but siloed. Azure Monitor covers platform metrics. Application Insights handles APM traces. Log Analytics stores diagnostic data. Each tool requires its own configuration, its own dashboards, and its own alert rules. When an incident spans multiple layers, the data to investigate it lives in three separate places.
The operational cost isn't just time. Fragmented tooling delays detection, extends resolution, and creates blind spots between layers that none of the individual tools are responsible for covering.Explore why teams are replacing fragmented Azure monitoring stacks.
OpManager Nexus addresses this by collecting and correlating telemetry across every layer of your Azure environment from a single platform.
What OpManager Nexus monitors in Azure
Azure infrastructure
Auto-discover Azure resources across subscriptions and resource groups as they're provisioned. Monitor without manual configuration updates as your environment scales.
- Azure Virtual Machines: CPU utilization, disk I/O, memory usage, and network throughput across VMs to maintain consistent infrastructure performance. OS-level metrics including CPU, memory, and disk require a lightweight agent; cloud-native Azure services are monitored agentlessly.
- Azure Kubernetes Service (AKS): Cluster health, pod utilization, node performance, and container-level metrics across AKS deployments.
- Azure SQL and managed databases: Query performance, connection activity, and resource utilization across Azure SQL, Cosmos DB, and managed database services.
- Azure Storage: Availability, latency, throughput, and error rates across Blob, Queue, File, and Table storage.
- Azure App Service and serverless: Health and performance of Azure App Service plans and Azure Functions, including invocation error rates and execution performance.
- Azure networking: Monitor NSGs, virtual networks, load balancers, and ExpressRoute connections alongside application and infrastructure telemetry.
Application performance
Track how applications deployed on Azure are performing for users —not just whether the underlying infrastructure is healthy.
- Distributed tracing: Follow requests end-to-end across Azure microservices and dependencies to pinpoint latency bottlenecks and failure points.
- Error rate and response time tracking: Surface degradation at the application layer before it becomes visible to users.
- Code-level visibility: Identify the exact line of Java, .NET, or Python code triggering slow database queries or inefficient methods in Azure-hosted applications—without guessing at the infrastructure layer.
- AKS application observability: Connect container-level telemetry to application performance, so pod restarts and node pressure surface in the context of application impact.
Azure monitoring dashboards
Gain a unified view of your Azure environment without building dashboards in multiple tools.
- Prebuilt Azure dashboards: Ready-to-use views for VM performance, AKS cluster health, database utilization, and cost metrics—available without configuration.
- Custom Azure monitoring dashboards: Build environment-specific dashboards that surface the metrics, services, and thresholds relevant to your team's operational context.
- Cross-layer correlation views: View infrastructure health, application performance, and log events on a single dashboard rather than correlating across separate consoles.
- Role-based views: Create dashboards scoped to specific teams— infrastructure, application, database—without exposing unrelated telemetry.
Log monitoring
Collect and analyze logs from Azure resources and applications in one place, with context from the infrastructure and services generating them.
- Azure diagnostic logs: NSG flow logs, activity logs, and resource diagnostic logs collected and searchable alongside infrastructure metrics.
- Application logs: Log data from Azure-hosted applications correlated with traces and infrastructure telemetry for faster root cause investigation.
- Log-based alerting: Define alert conditions on log patterns and anomalies with thresholds tuned to your environment's normal behavior.
- Cross-source log search: Query logs from Azure services and non-Azure systems in the same interface without moving data between tools.
AIOps and anomaly detection
Azure environments generate continuous telemetry across interconnected services. Zia AI applies anomaly detection and event correlation to compress the gap between detection and resolution.
- Anomaly detection: Zia AI identifies deviations from baseline behavior across Azure metrics before they escalate into incidents, reducing noise from threshold-based alerts.
- Cross-layer event correlation: Correlate alerts and events across virtual machines, AKS clusters, databases, and platform services to surface the full incident chain, not individual alerts.
- Topology-aware impact analysis: Using the Azure service dependency map, automatically determine blast radius and identify which downstream services are affected when an issue occurs.
- Automated incident workflows: Trigger response workflows when incident patterns are detected—notifying on-call teams, creating ITSM tickets, and executing runbooks automatically.
Cost and capacity
Track Azure spend and resource utilization in the same platform used to monitor performance—so resource decisions are grounded in operational data rather than billing reports reviewed after the fact.
- Cost visibility alongside performance metrics: Correlate Azure spend with resource utilization to identify over-provisioned or underutilized services—so infrastructure budget conversations are grounded in evidence of what your environment is actually consuming.
- Capacity forecasting: Analyze usage trends to anticipate demand before it affects performance, giving teams lead time to scale rather than reacting to resource pressure.
- Right-sizing recommendations: Surface compute and storage resources that are oversized relative to actual workload requirements, reducing spend without reducing coverage.
How to get started with OpManager Nexus Azure monitoring tool
Step 1: Connect
OpManager Nexus connects to Azure via API and auto-discovers resources across subscriptions and resource groups as they are provisioned. New resources are added to monitoring coverage without manual configuration.
Step 2: Correlate
Infrastructure metrics, application traces, logs, and cost data are available in a unified console. When a performance issue occurs—a slow database query degrading an AKS-hosted application, surfacing as high latency for end users—the full incident chain is visible in one place without switching tools.
Step 3: Act
Zia AI surfaces anomalies and correlates alerts before they become incidents. Automated workflows notify on-call teams, create ITSM tickets, and execute runbooks. Teams move from reactive investigation to proactive resolution.
Built for the complexity your Azure environment already has
Azure monitoring is only effective if the platform can cover the environment you actually run. OpManager Nexus is built for heterogeneous infrastructure, Azure alongside on-premises servers, network devices, and workloads running on AWS and GCP, without requiring a separate tool for each environment or a rearchitecture of how monitoring is managed.
OpManager Nexus covers more than 100 Azure service types on the same console with customizable and in-built dashboards. Teams managing hybrid environments get unified visibility without maintaining parallel monitoring configurations.
More than 600 technology integrations are available out of the box. Alerts route to PagerDuty, Jira Service Management, and Slack. ITSM workflows connect to ServiceNow and Jira for automated ticket creation when incidents are detected.
Stop monitoring Azure in fragments
Azure environments are too interconnected for visibility to live in separate tools. OpManager Nexus unifies infrastructure, application, log, and cost monitoring for Azure in a single platform—so the context needed to detect and resolve issues is already assembled when something goes wrong.
Frequently asked questions
- What Azure services does OpManager Nexus monitor?
OpManager Nexus monitors more than 100 Azure service types, including Azure Virtual Machines, Azure Kubernetes Service (AKS), Azure SQL Database, Cosmos DB, Azure App Service, Azure Functions, Azure Storage, and Azure networking components including NSGs, load balancers, and virtual networks. - How is OpManager Nexus different from Azure Monitor?
Azure Monitor is a native Azure service that covers platform-level metrics and logs within the Azure ecosystem. OpManager Nexus monitors Azure alongside on-premises infrastructure, other cloud providers, and application-layer telemetry from a single console, providing correlated visibility across layers that Azure Monitor's siloed tools do not cover natively. For teams evaluating whether to complement or replace Azure Monitor, see our full Azure Monitor pricing and alternatives guide. - Does OpManager Nexus replace Azure Monitor?
Not necessarily. Many teams continue using Azure Monitor for Azure-native resource metrics while adopting OpManager Nexus to unify visibility across hybrid infrastructure, application performance, and log monitoring in a single console. The decision depends on whether the operational overhead of running both is lower than consolidating onto one platform. - Does OpManager Nexus replace Application Insights?
Not necessarily—but for most teams, it does. OpManager Nexus covers distributed tracing, error tracking, code-level performance visibility, and live metrics for Azure-hosted applications. Teams using Application Insights can consolidate that telemetry into Nexus and get infrastructure, application, and log monitoring in a single console instead. - How does auto-discovery work for Azure resources?
OpManager Nexus connects to Azure via API and automatically discovers resources across subscriptions and resource groups as they are provisioned. New resources are added to monitoring coverage without manual configuration, keeping visibility current as environments scale. - Can OpManager Nexus monitor hybrid Azure environments?
Yes. OpManager Nexus provides unified monitoring for Azure resources alongside on-premises servers, network devices, and workloads running on other cloud providers. Teams managing hybrid environments use a single console without separate monitoring configurations for each environment segment. - What Azure dashboards are available out of the box?
Prebuilt dashboards cover Azure VM performance, AKS cluster health, database utilization, network performance, and cost metrics. Custom dashboards can be configured to surface the specific services, thresholds, and views relevant to individual teams or environments. - Does OpManager Nexus support Azure log monitoring?
Yes. OpManager Nexus collects Azure diagnostic logs, NSG flow logs, activity logs, and application logs alongside infrastructure metrics. Log data is searchable and correlated with performance telemetry from the same console used for infrastructure and application monitoring. - Is OpManager Nexus cloud-hosted or on-premises?
OpManager Nexus is available as a cloud-hosted SaaS platform via ManageEngine's regional data centers. On-premises deployment is also supported for organizations with data sovereignty or air-gapped environment requirements. Contact the sales team for specific data residency requirements.