Correlating Server Health with Application Performance
In today’s digital world, the performance of customer-facing platforms like applications directly defines business success. Whether it’s a banking service processing millions of transactions or an e-commerce site that serves customers worldwide, high availability and peak performance are indispensable to ensure superior digital experience.
Applications, however, are just the front end. The underlying infrastructure powers them from behind. While there are many entities that constitute the infrastructure, like firewalls, network devices, and servers, today in this article we will focus on the role of servers, and how an impact in server can affect your application performance.
Correlating server health with application performance is the process of linking infrastructure metrics (like server CPU, memory, and disk I/O) with application KPIs (like response time, error rates, and transaction speed) to find the actual root cause of performance issues quickly.
- Why does correlation matter?
- How to correlate: Key metrics to consider
- OpManager Plus: A unified solution to monitor server and application health
Key takeaways from this article:
- Correlation solves the "Is it the app or the server?" problem, leading to faster root cause analysis (RCA).
- How correlation prevents poor user experience by identifying which layer of the IT stack negatively impacts application performance.
- The importance of a comprehensive, unified monitoring tool.
- How solutions like OpManager Plus leverage full-stack observability and aid in data correlation.
Why does correlation matter?
Correlating server metrics with application performance metrics greatly reduces the troubleshooting time helping in business continuity. Here are the key reasons why correlation matters:
- Faster root cause analysis: An application slowdown could stem from a slow database query, an overloaded server, or a network misconfiguration. By correlating data across layers, IT admins can quickly pinpoint where the issue is from, enabling faster diagnosis, which in turn reduces the mean time to repair (MTTR).
- Enhanced user experience: Long page load times or application errors can frustrate end users and force them to look for other vendors. Correlating server health with application performance ensures potential slowdowns are detected early and resolved before they impact the end-user experience.
- Reduced operational costs: Siloed troubleshooting often leads to longer down times and wasted effort. Correlation minimizes redundant investigations, streamlines troubleshooting workflows, and reduces the overall cost of maintaining IT operations.
- Lower support burden: When server issues affect applications, support teams often face a surge in tickets. By correlating metrics, IT teams can proactively address problems before they escalate, easing the load on the help desk and support team.
How to correlate: Key metrics to consider
Gaining complete visibility in a unified window simplifies the process of correlation. To achieve this, collecting data across all layers of the IT stack is crucial.
Application monitoring
Track critical application KPIs such as response times, error rates, transactions and throughput. These metrics help you understand the performance of your applications from an end user perspective. Further, monitoring these metrics enables you to narrow down the underlying root cause. For example, a spike in error rates may correlate with high server CPU usage, signaling a need for resource optimization.
| Server metrics | Impact on applications |
|---|---|
| CPU Usage | High CPU leads to increased latency and slow application response times. |
| Memory Utilization | Memory saturation causes higher error rates, crashes, or service restarts. |
| Disk I/O (Read/Write Ops) | Poor disk throughput slows down database queries and transaction processing. |
| Network Throughput | Low bandwidth or packet loss results in slow page loads and poor user experience. |
Infrastructure monitoring
Monitor the health of the underlying infrastructure, including servers, storage, and network devices that support your applications. Metrics like CPU utilization, memory usage, disk I/O, and bandwidth consumption reveal how well your infrastructure can handle workloads.
Cloud monitoring
As enterprises adopt hybrid and multi-cloud environments, monitoring cloud resources becomes essential. Relying on a full-stack observability monitoring solution will help you track the performance of your on-prem and cloud workloads from a single console.
Database monitoring
Since most applications rely on databases for transactions and data storage, monitoring resource consumption, user sessions, and query performance helps prevent bottlenecks that can cascade into application slowdowns. For instance, slow database queries may lead to increased application latency. However, by correlating app performance with the database metrics, you can pinpoint the issue and solve it.
OpManager Plus: A unified solution to monitor server and application health
ManageEngine OpManager Plus is a full stack observability solution that enables IT teams correlate server health with application performance to identify issues quickly. It helps you monitor all layers of your IT stack including servers, applications, cloud environments, and the network layer, from a single console. Here’s are some of its prominent features that help in data correlation across layers:
Unified server and application performance monitoring
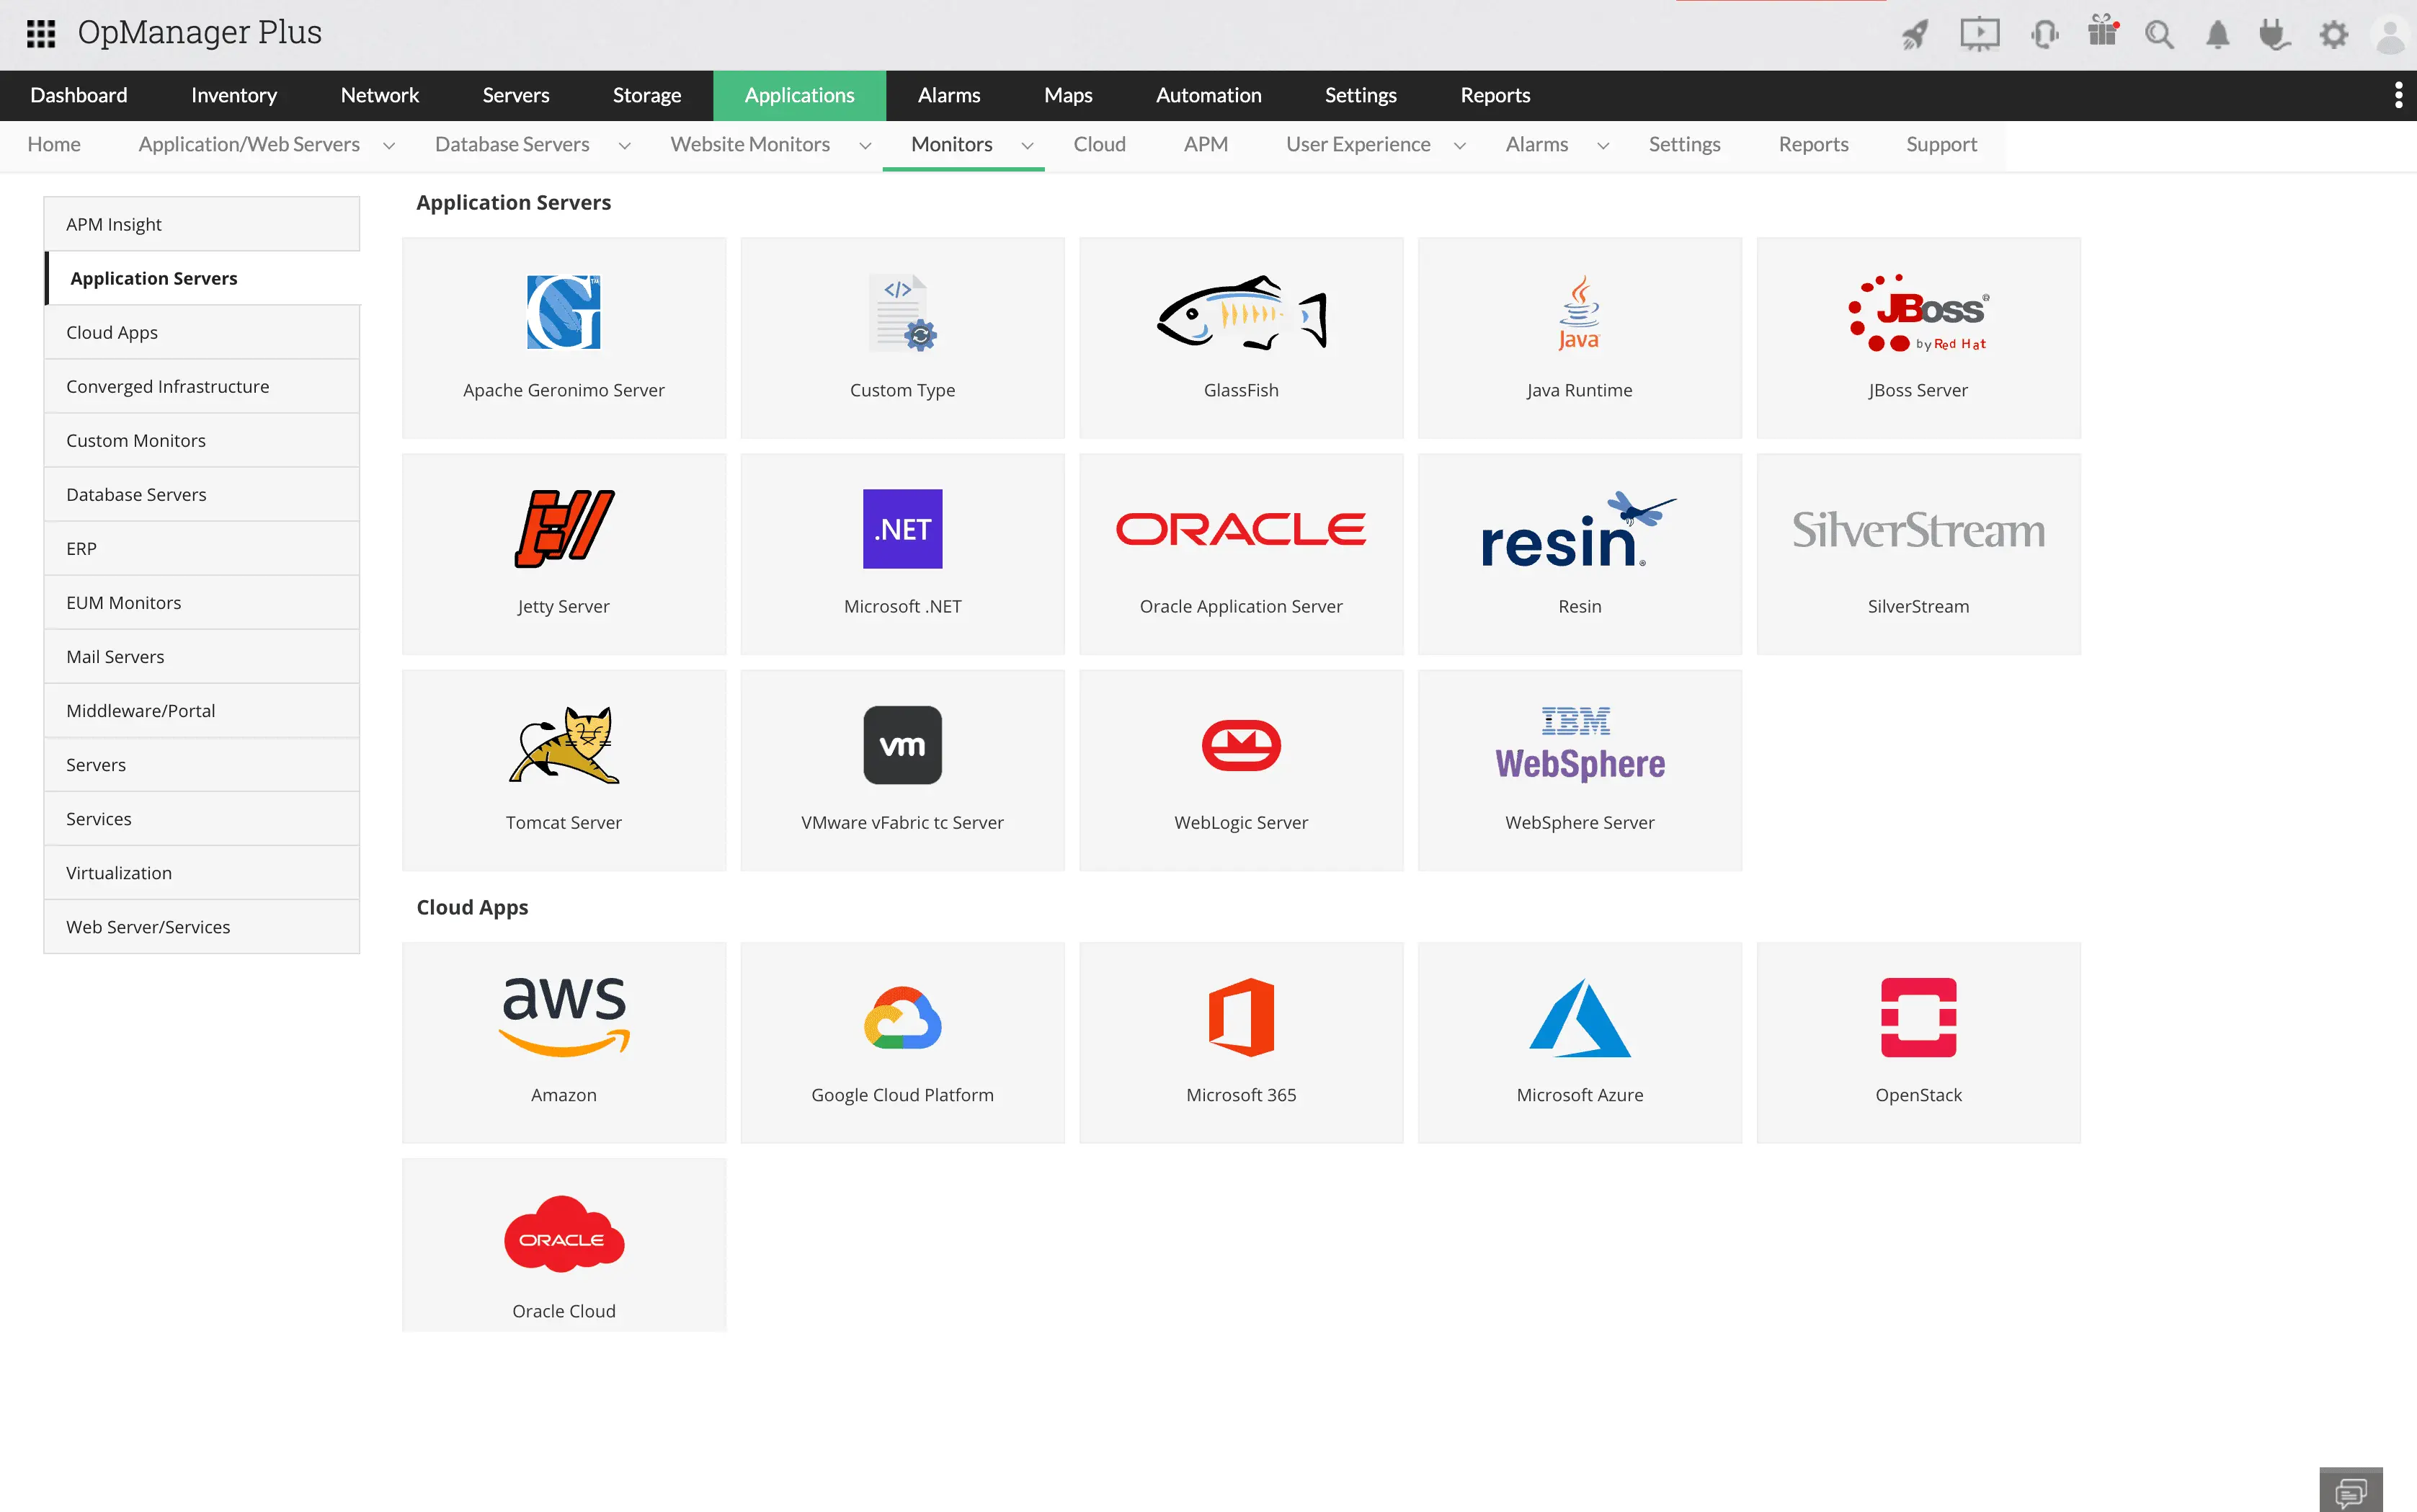
OpManager Plus delivers out-of-the-box monitoring for servers, virtualized environments like VMware, Hyper-V, Nutanix, Proxmox, and cloud platforms. It tracks critical server metrics such as CPU utilization, memory usage, disk I/O, and availability. In addition to this, IT teams can monitor application performance metrics like response times, error rates, and transaction throughput from the same window.
This allows teams to detect issues like memory leaks, hung processes, or under-provisioned resources ensuring the health of servers and the performance of the applications, contributing to a positive digital user experience.
Dependency mapping
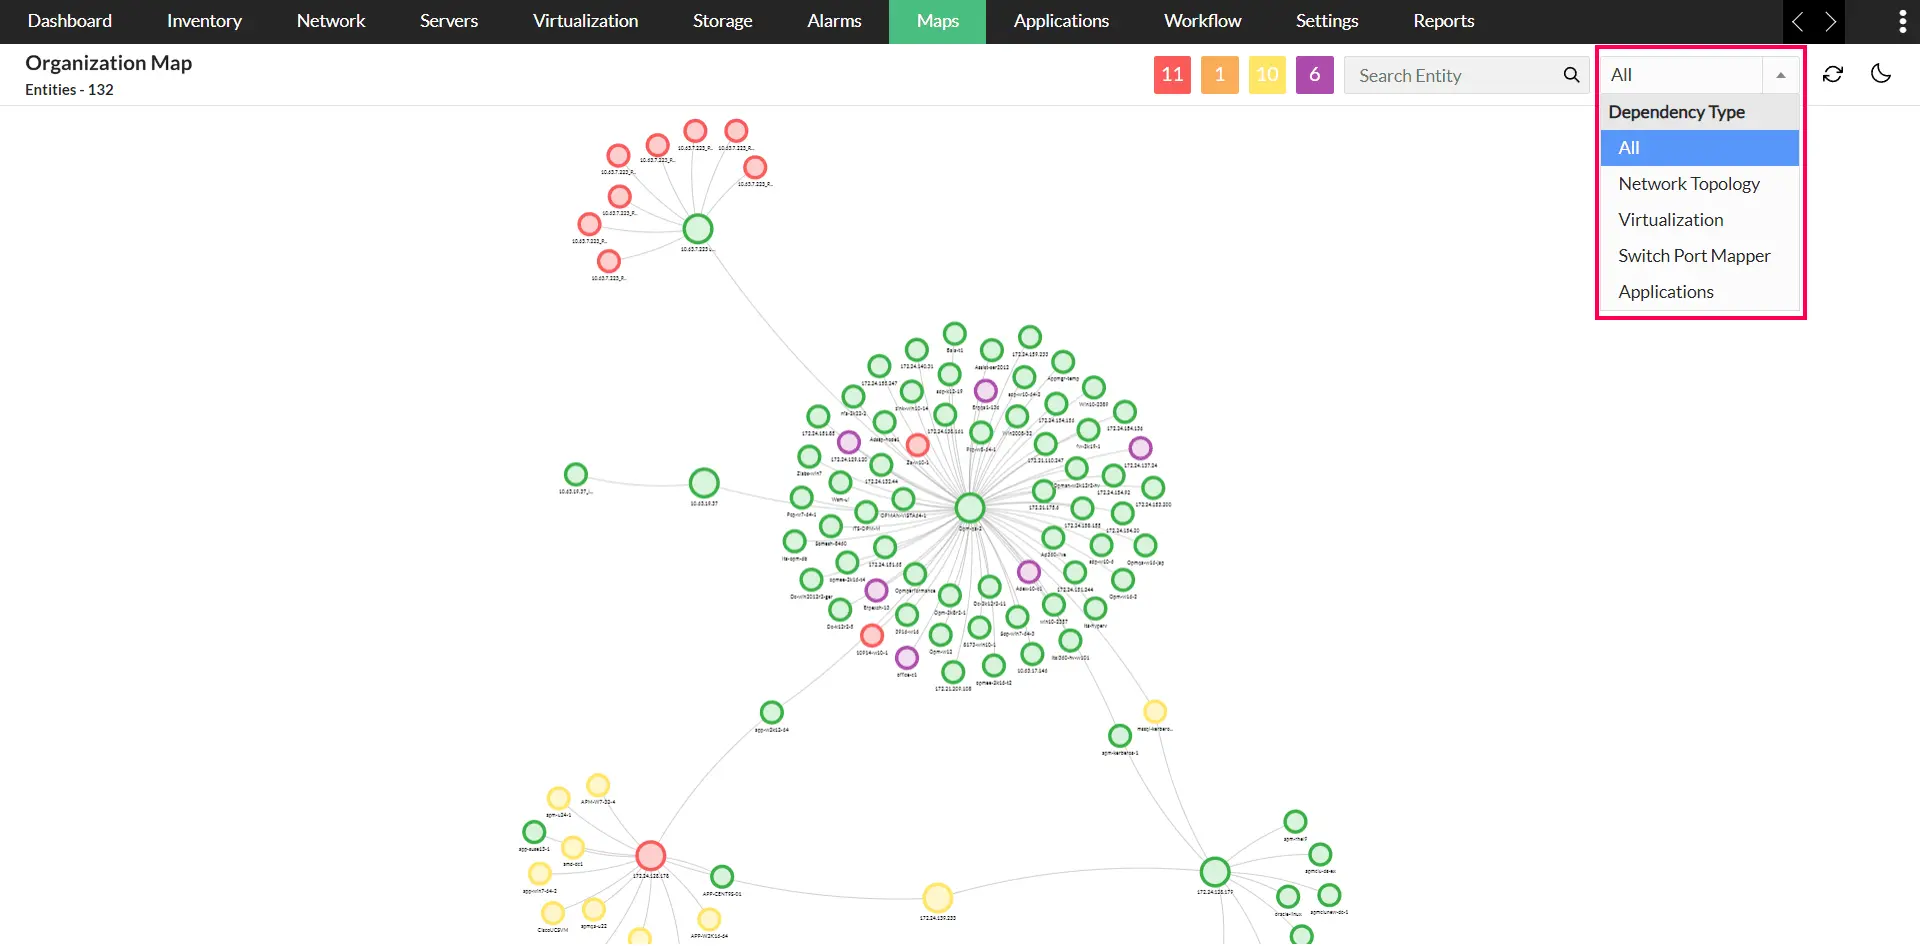
OpManager Plus utilizes its auto-application discovery capability to discover all applications running in your servers and VMs. With this data, it creates an organization map offering you a complete, intuitive, visual representation of your entire network.

This level of visualization enables you to understand the relationship between your servers and the business-critical applications. Instead of the traditional isolated view, the organization map provides a holistic view of workloads in the network infrastructure and how they interconnect, helping you pinpoint issues and understand performance from a single intuitive console.
Root Cause Analysis (RCA)
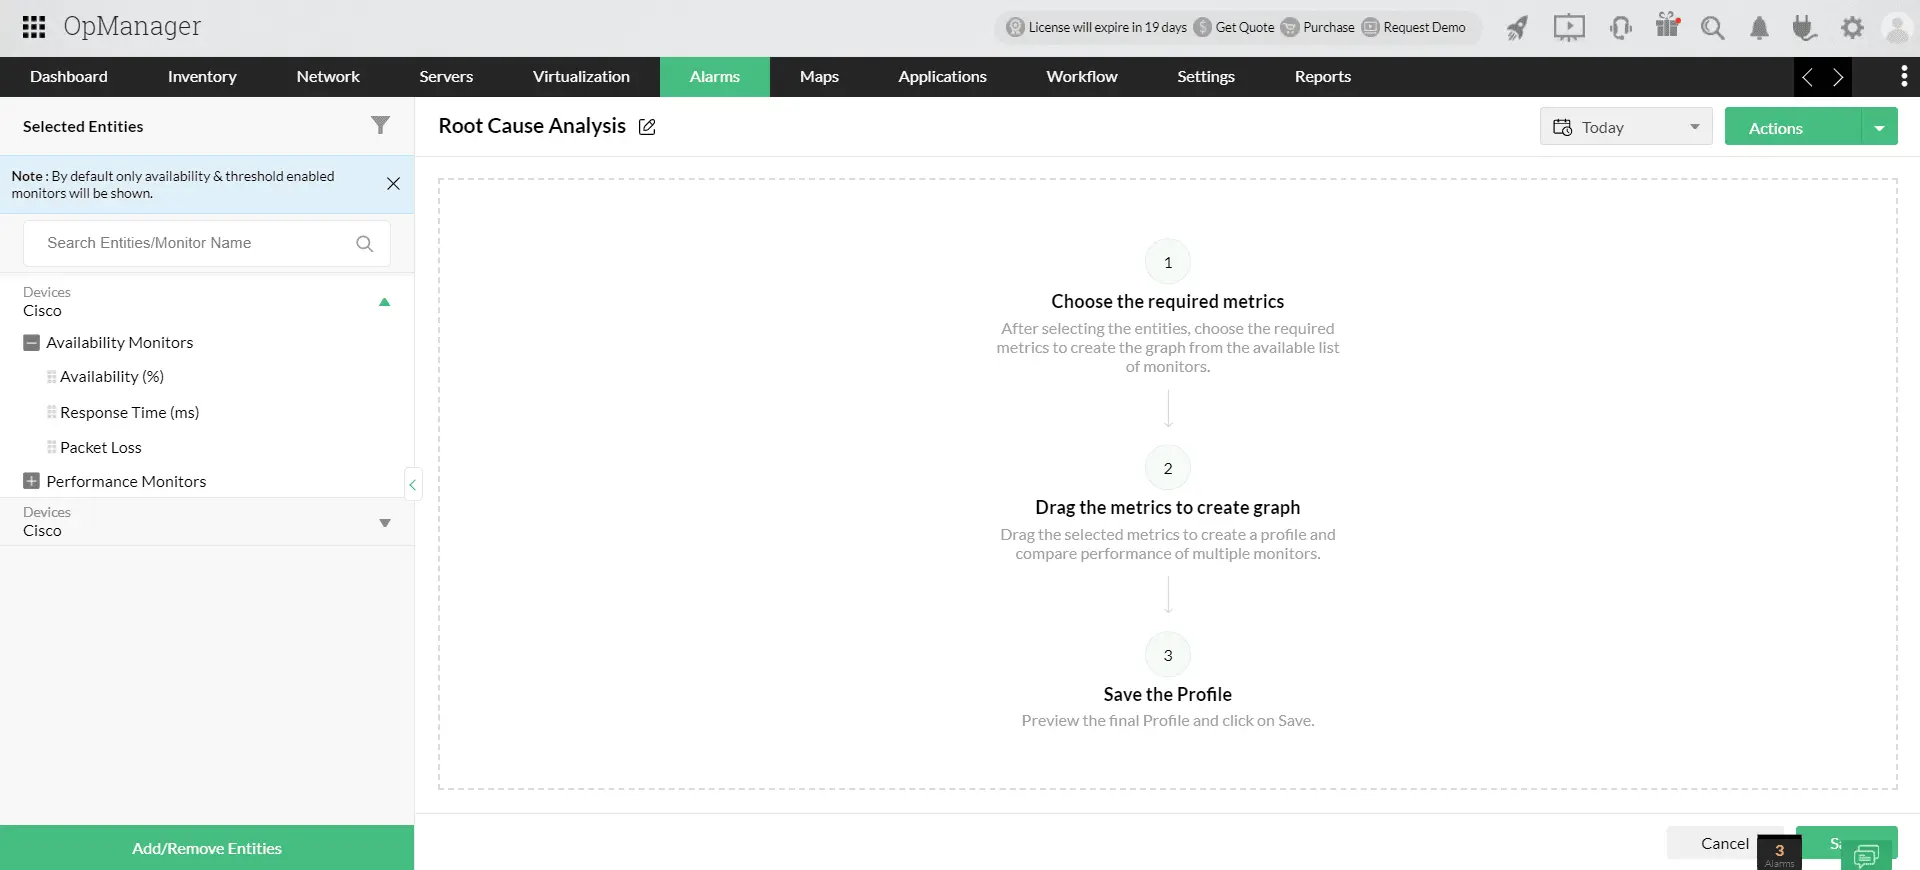
With the RCA feature in OpManager Plus, IT teams can significantly accelerate troubleshooting. Admins can view performance data, associated alerts from multiple entities such as devices and interfaces, all in a single window.
By monitoring your bandwidth and traffic, you can keep the application running 24x7, lag-free, with minimal jitter and latency.

This centralized view helps IT teams to correlate metrics, record inferences, analyze trends, and quickly narrow down the root cause, which would otherwise take a significantly higher duration.
Unified, customizable dashboards - Visualize the correlation
OpManager Plus offers customizable dashboards and network operations center (NOC) views to visualize server and application performance metrics in real-time.
IT teams can create drag-and-drop widgets to display key performance indicators (KPIs) like recent alarms raised, Heat Map, health and availability parameters of servers and applications. The dashboard give you a birds eye view of your network performance, enabling you to detect issues in real time and implement quick actions.
Cloud and container monitoring
For organizations using hybrid or multi-cloud environments, OpManager Plus provides robust cloud monitoring capabilities.
OpManager Plus is a vendor-agnostic tool and enables you track business-critical KPIs of your private, public or hybrid cloud environment. It supports all leading vendors like AWS, Azure, Google Cloud, Oracle Cloud, Kubernetes, Docker containers, Red Hat OpenShift, and OpenStack.

By correlating cloud and container metrics with application performance, OpManager Plus helps detect issues like resource contention or data transfer bottlenecks that could affect application availability.
Simplify data correlation across IT stack with OpManager Plus
Download Now!
