Root cause analysis
Any network is susceptible to problems that impact performance and output.
Fixing problems and restoring the network quickly is crucial to ensure business continuity, but it is far easier said than done. Networks are complicated structures with multiple possible causes for a performance issue.
For example, an issue like slow network speed can result from high bandwidth in the interfaces, an application problem, or protocol latency.
Without proper knowledge about the root cause, taking action will not solve the issue and might prolong the problem as well as skyrocket your network's mean time to repair (MTTR) metric.
Accelerate fault cause identification with root cause analysis
ManageEngine OpManager's network monitoring capability is further enhanced with the launch of the new Root Cause Analysis (RCA) feature. RCA is bundled with options that enable you to aggregate IT data from various network components and simplify the process of analyzing your performance.
- Centralized platform for performance analysis
- Visual representation of monitors
- Automatic aggregation of alarm details
- Record your findings and inferences using the Annotation feature
A centralized platform for analysis
OpManager enables you to create a RCA Profile for an issue that you want to troubleshoot. An RCA Profile is a centralized platform that helps you aggregate performance data of multiple monitors, compare and analyze, and draw conclusions.
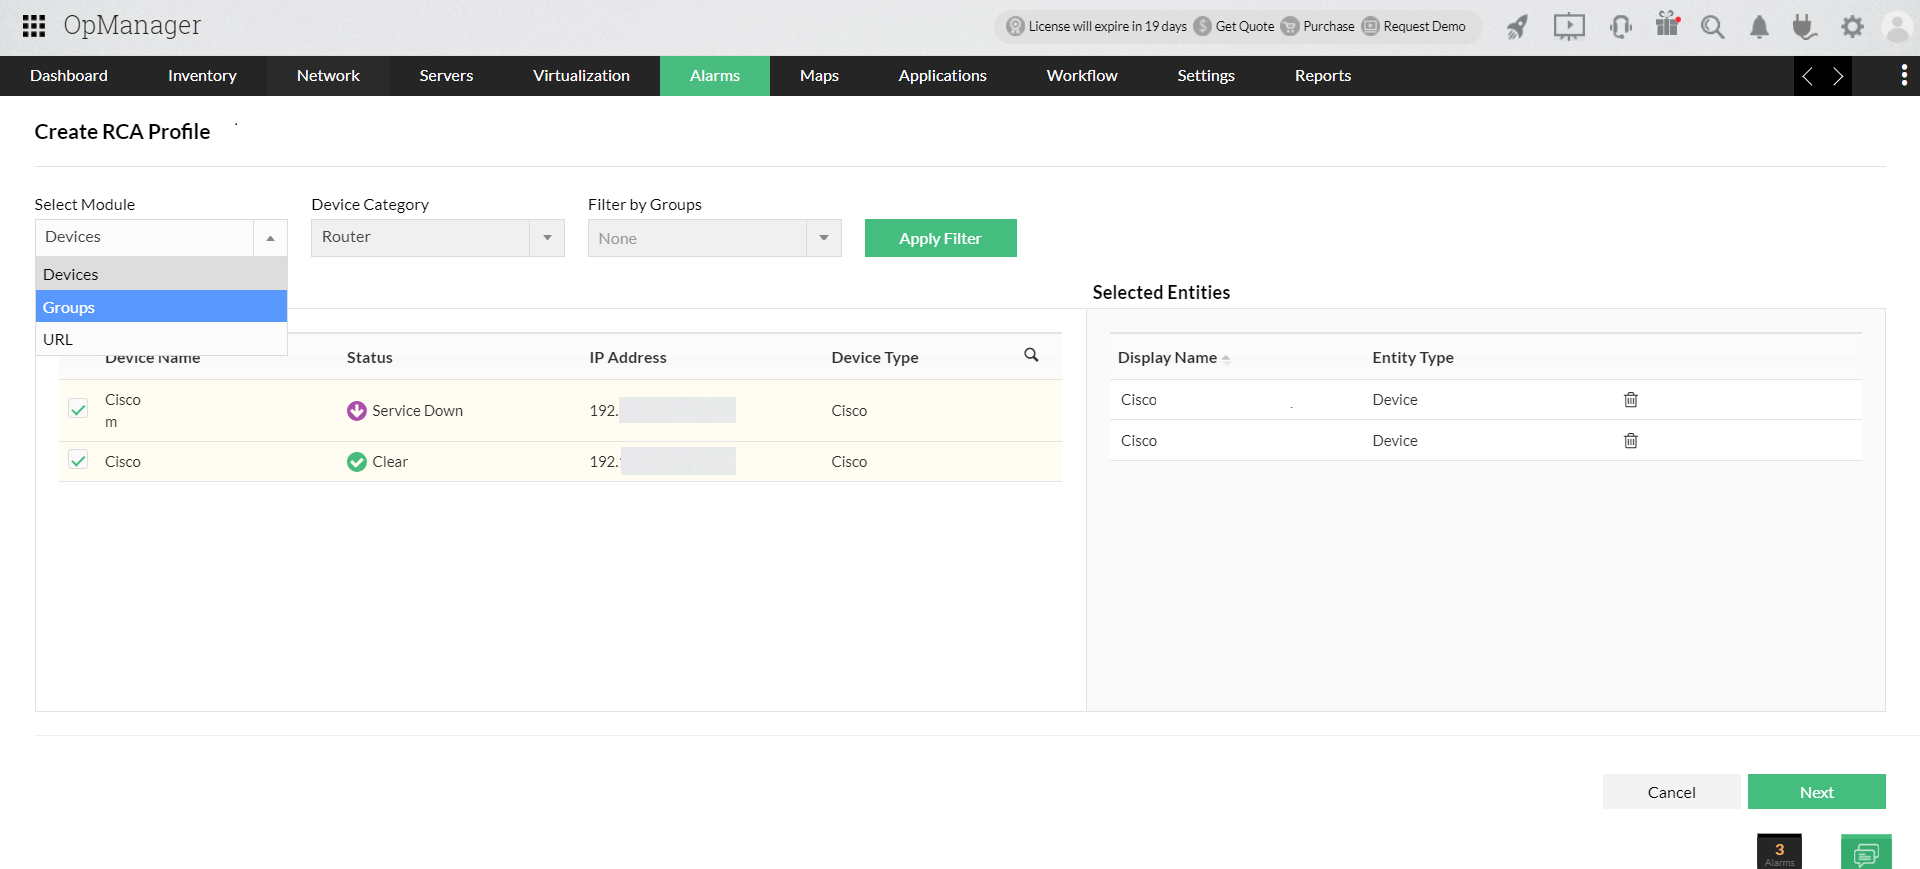
While creating a RCA Profile, the first step is to specify the module and select the entities. It supports three different modules: Devices, Interfaces and URLs.
Entities refer to the list of devices or interfaces or URLs that will be displayed for selection.
Available monitors
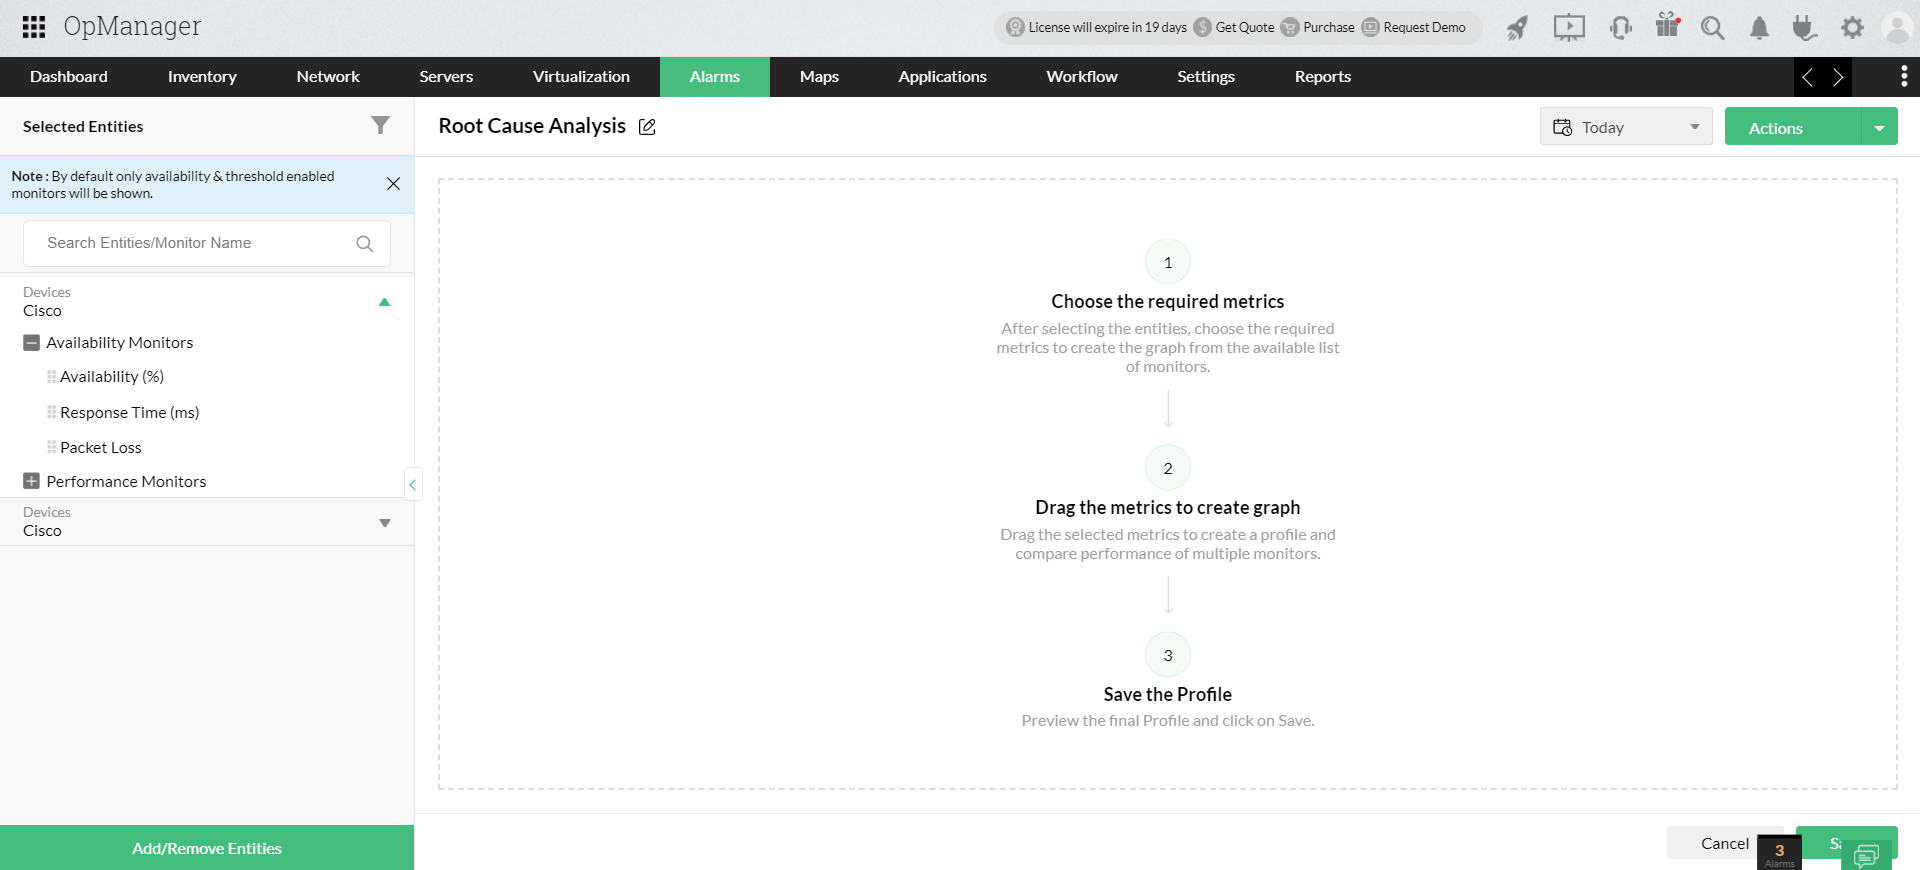
OpManager automatically pulls the list of monitors associated with selected entities and displays it. By default, only threshold-enabled and availability monitors are shown. However, you can use the filter button to display all monitors associated with the selected entities.
Graphical visualization of monitoring data
Comparing the performance of multiple monitors and identifying the correlations among them will help you narrow down the cause of an issue.
Network abnormalities can be correlated to a monitor that is tracked. For example, sluggish performance in a storage device can be correlated to high IOPS and high latency. The key is to draw the connection between the fault and a measurable metric.
In OpManager's RCA Profile, you simply have to drag and drop the relevant monitors whose performance you want to analyze. A performance curve for each monitor will be created on the graph. You can compare up to 20 monitors in a single window.
All the selected monitors are populated as performance graphs on a common time line, and this helps you correlate and analyze multiple monitor performances at any instant.
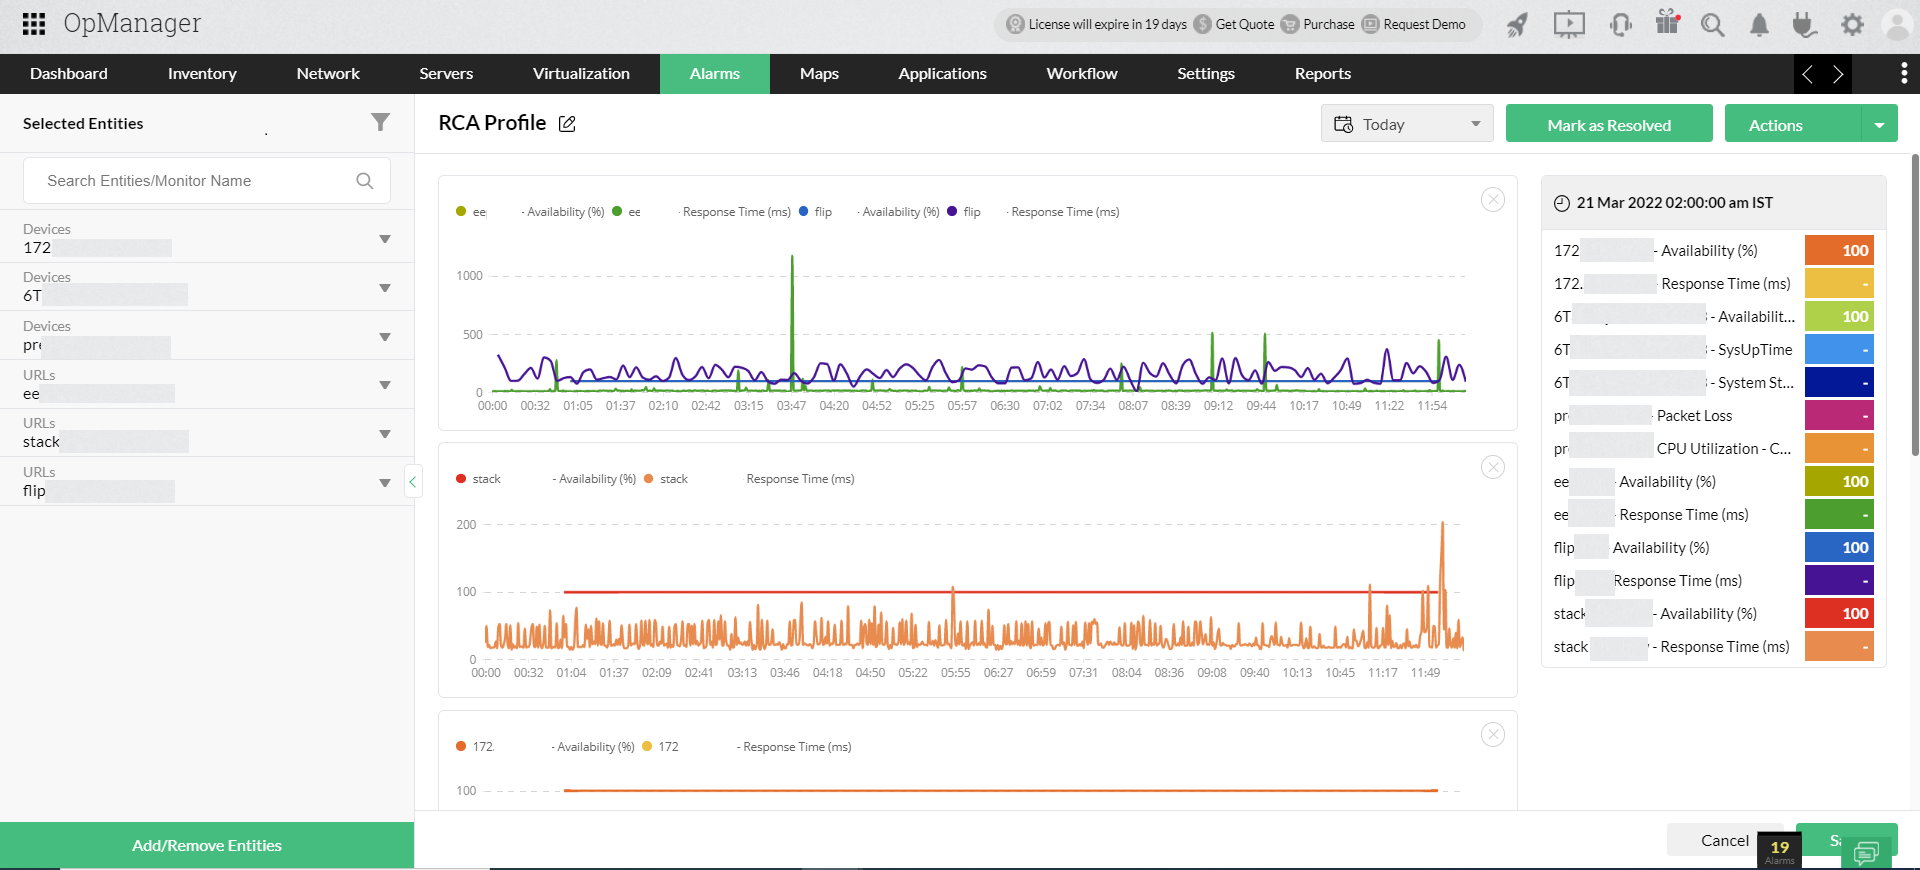
As you move the cursor over the graph, the details of the monitor's performance are displayed instantly in the right pane.
Associated alarm data
In OpManager, you can either configure thresholds or enable the adaptive threshold feature to intelligently configure threshold values for the monitors, so that whenever a specified threshold is violated, an alarm is raised.
You can get the data for alarms in the RCA Profile as well. Once you generate the performance graphs for the monitors, the RCA Profile will automatically display the data for the number of alarms for each monitor. You can specify the time period, the alarm data, and performance graphs for the specified duration that will be displayed.
Graph annotations
A performance curve represents the behavior overtime of the device in terms of the monitor selected.
For example, you can populate CPU Utilization behavior of your critical server visually in the form of a performance graph.
While analyzing the graph, you may draw inferences and may want to record them. For instance, if you see a sudden spike in the graph, you can record, with just a simple click, your inferences at that instant using the Annotation feature.
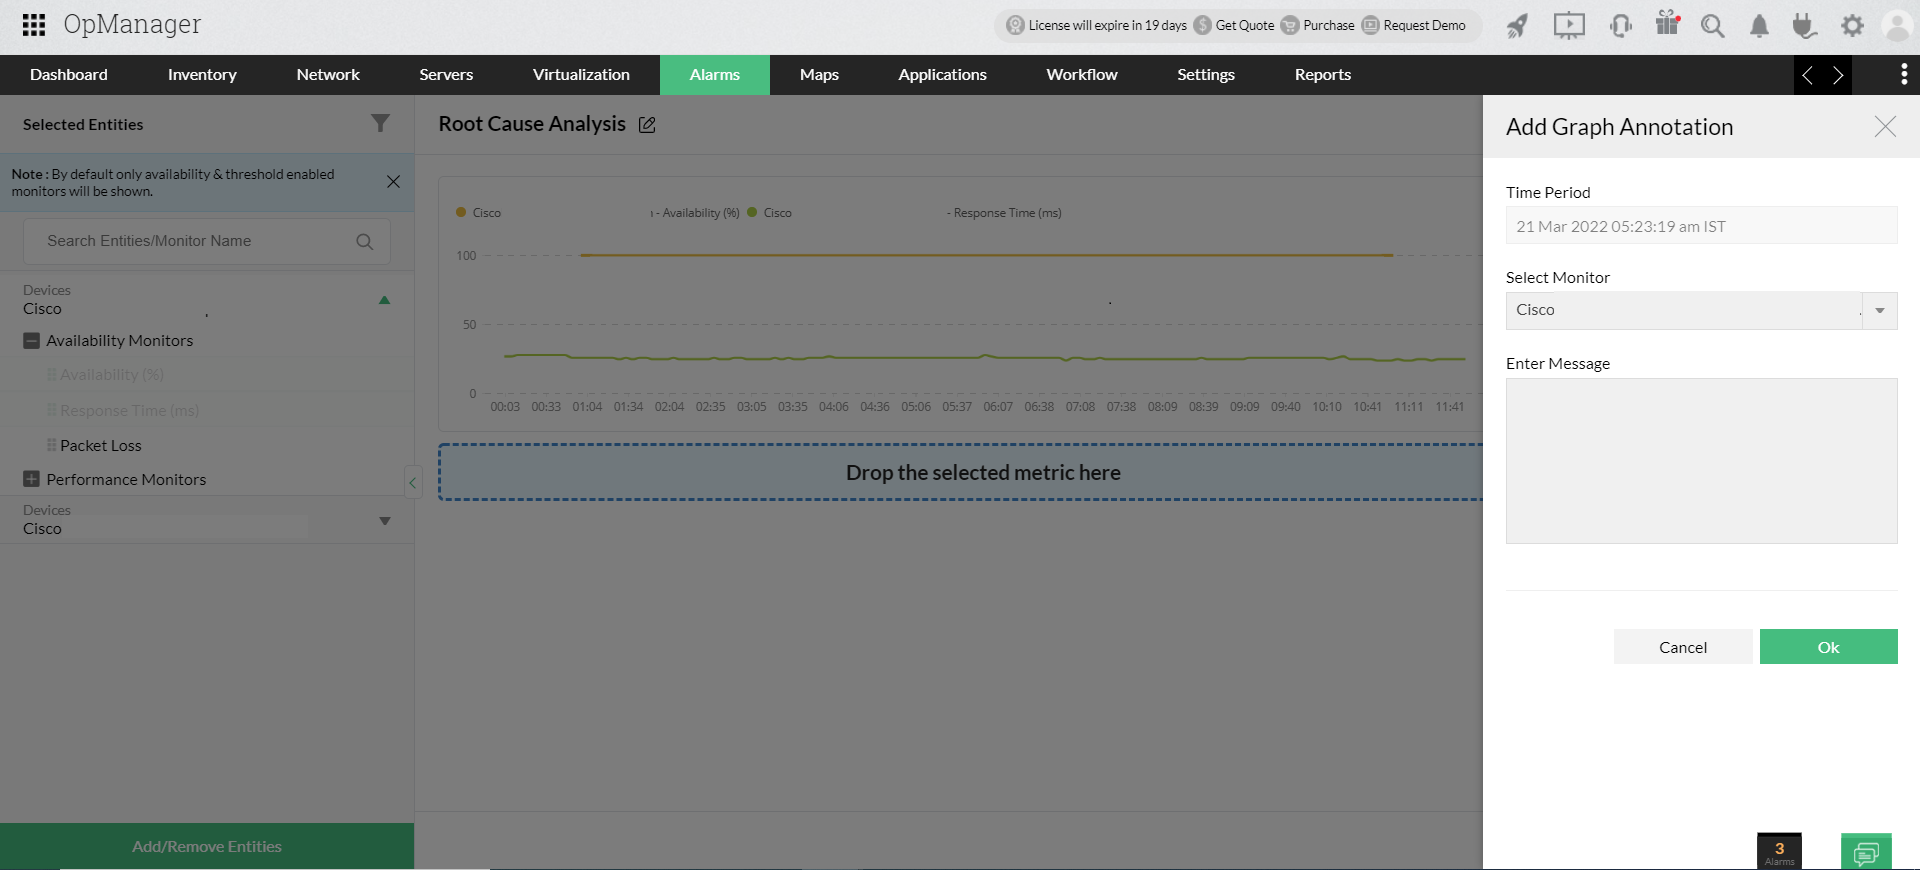
You can record multiple annotations at different points on the graph. When you read them, you will receive a complete perspective of the real issue.
Advanced options
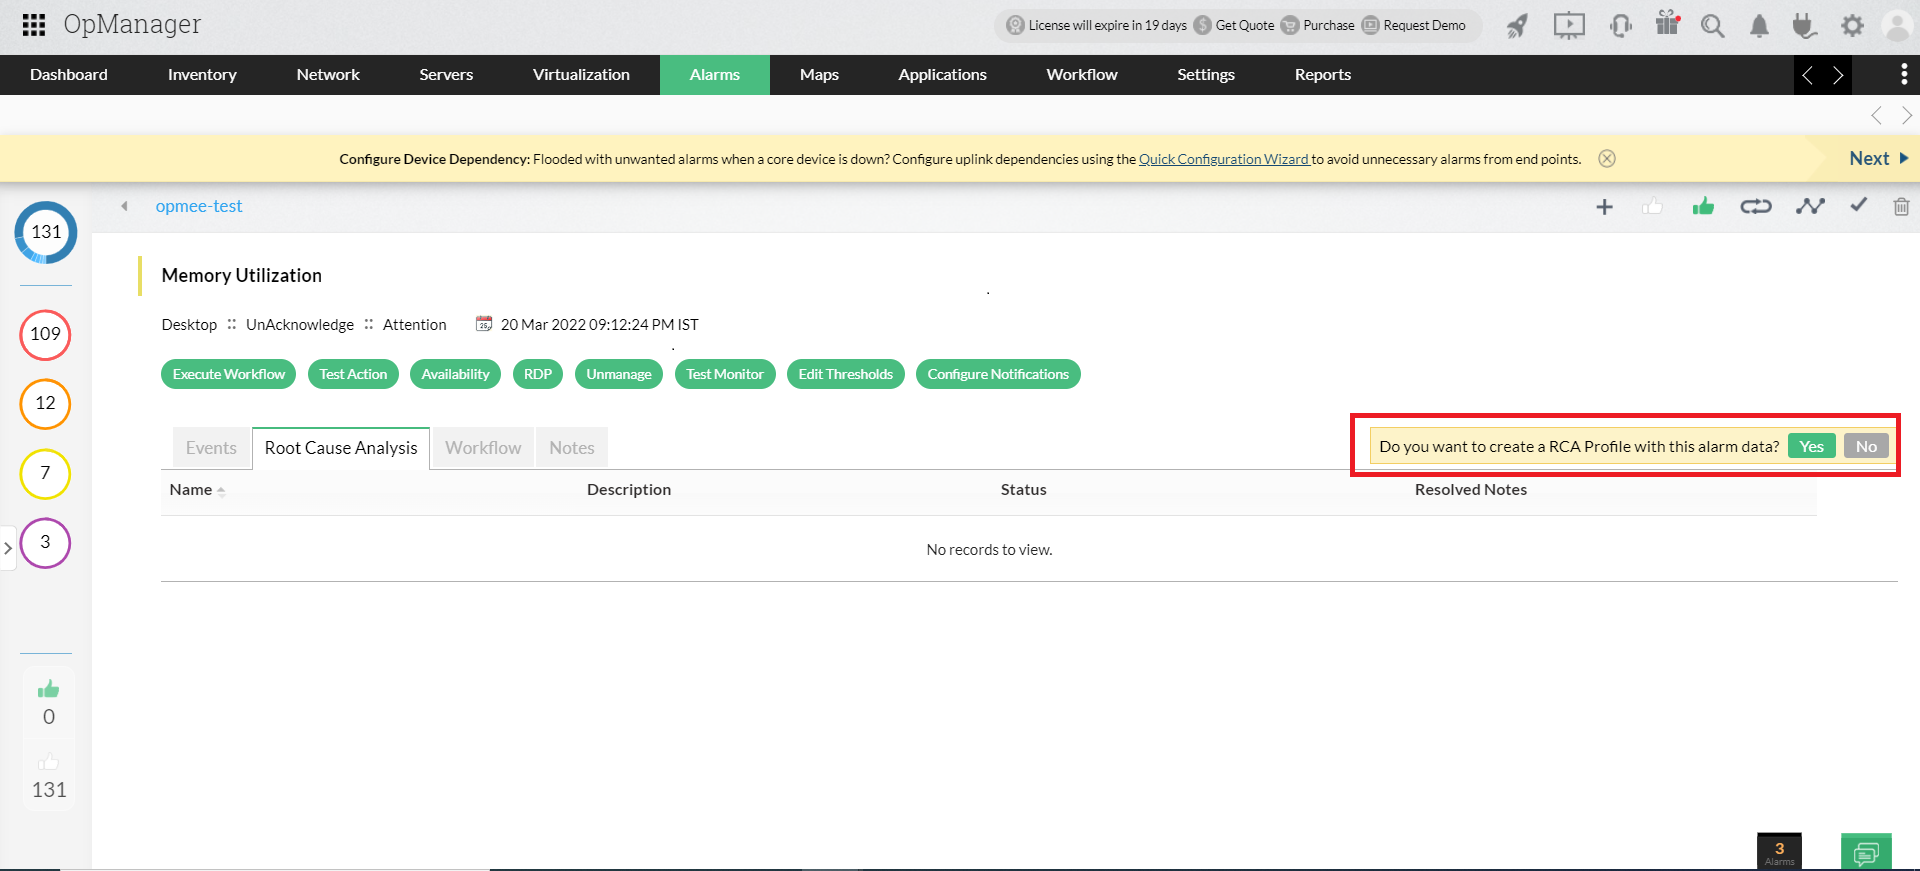
Create a RCA Profile with alarm data
You can also create a RCA Profile with alarm data to troubleshoot the threshold violation issues. OpManager enables you to easily create a new Profile from the snapshot page of an alarm.
Perform RCA for Groups
In OpManager, you can combine a set of devices or interfaces and form groups, so that you can easily push bulk configuration changes easily. Groups can be formed based on any criteria. For example, you can organize devices based on a location or category and form them as a group.
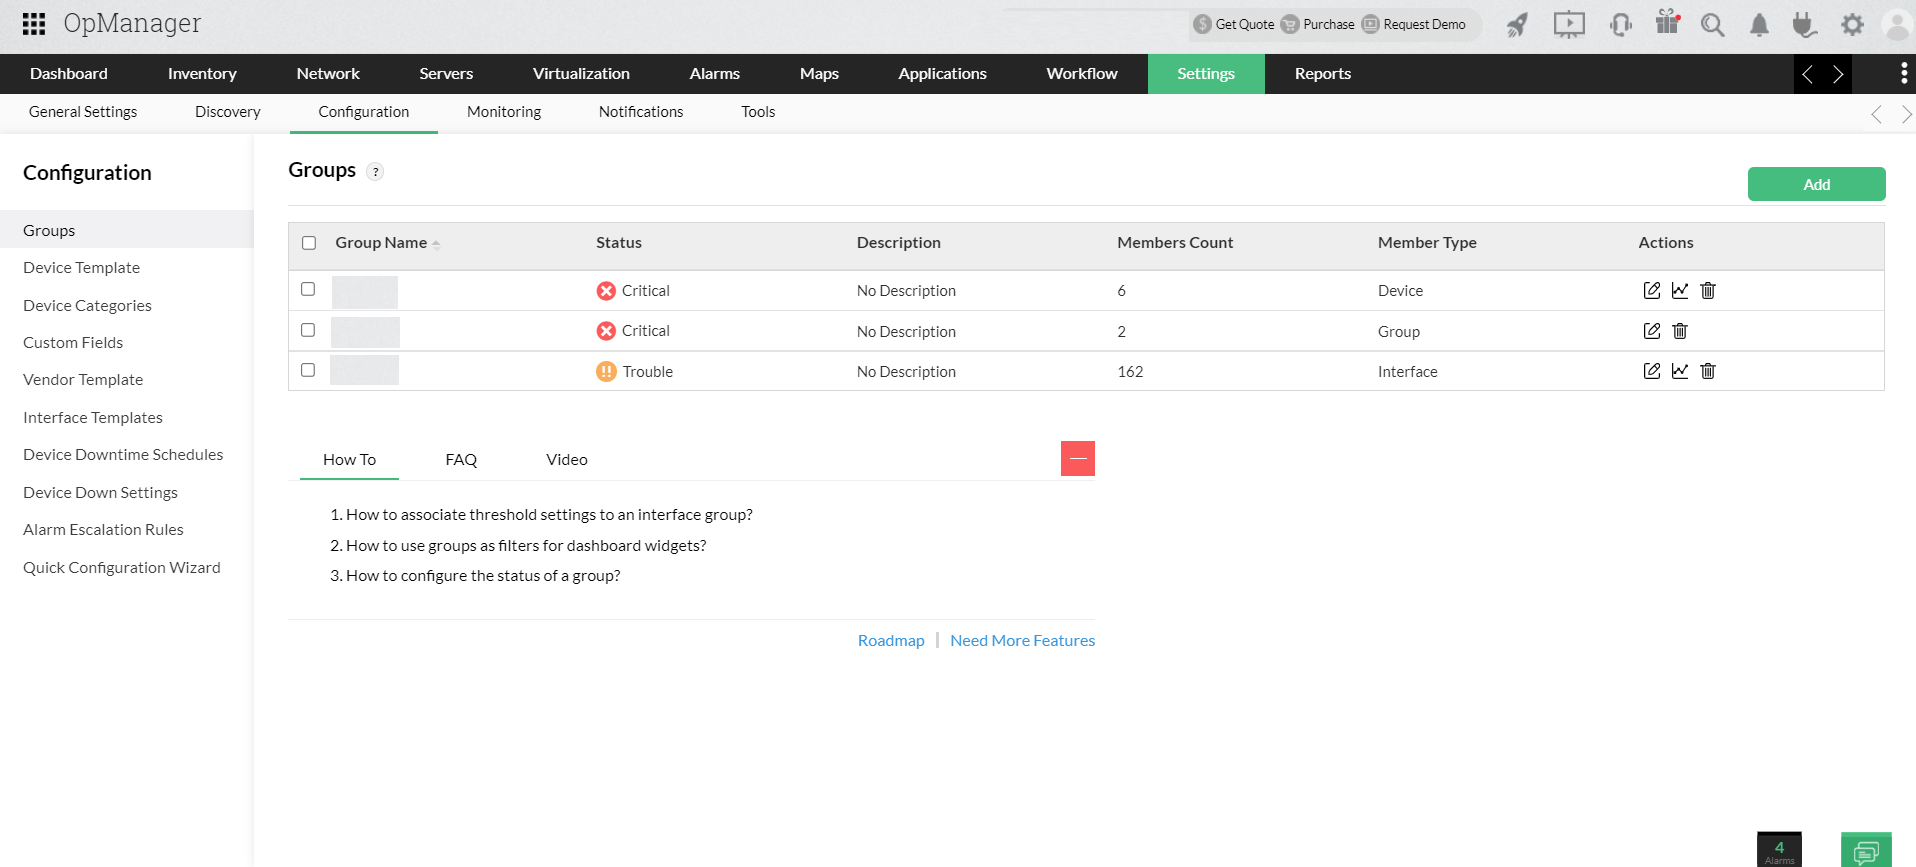
OpManager allows you to perform RCA for groups. For example, when a network outage occurs in a particular branch office, you can easily perform RCA for your branch office (Group) and troubleshoot the cause of the outage.
Notification profile
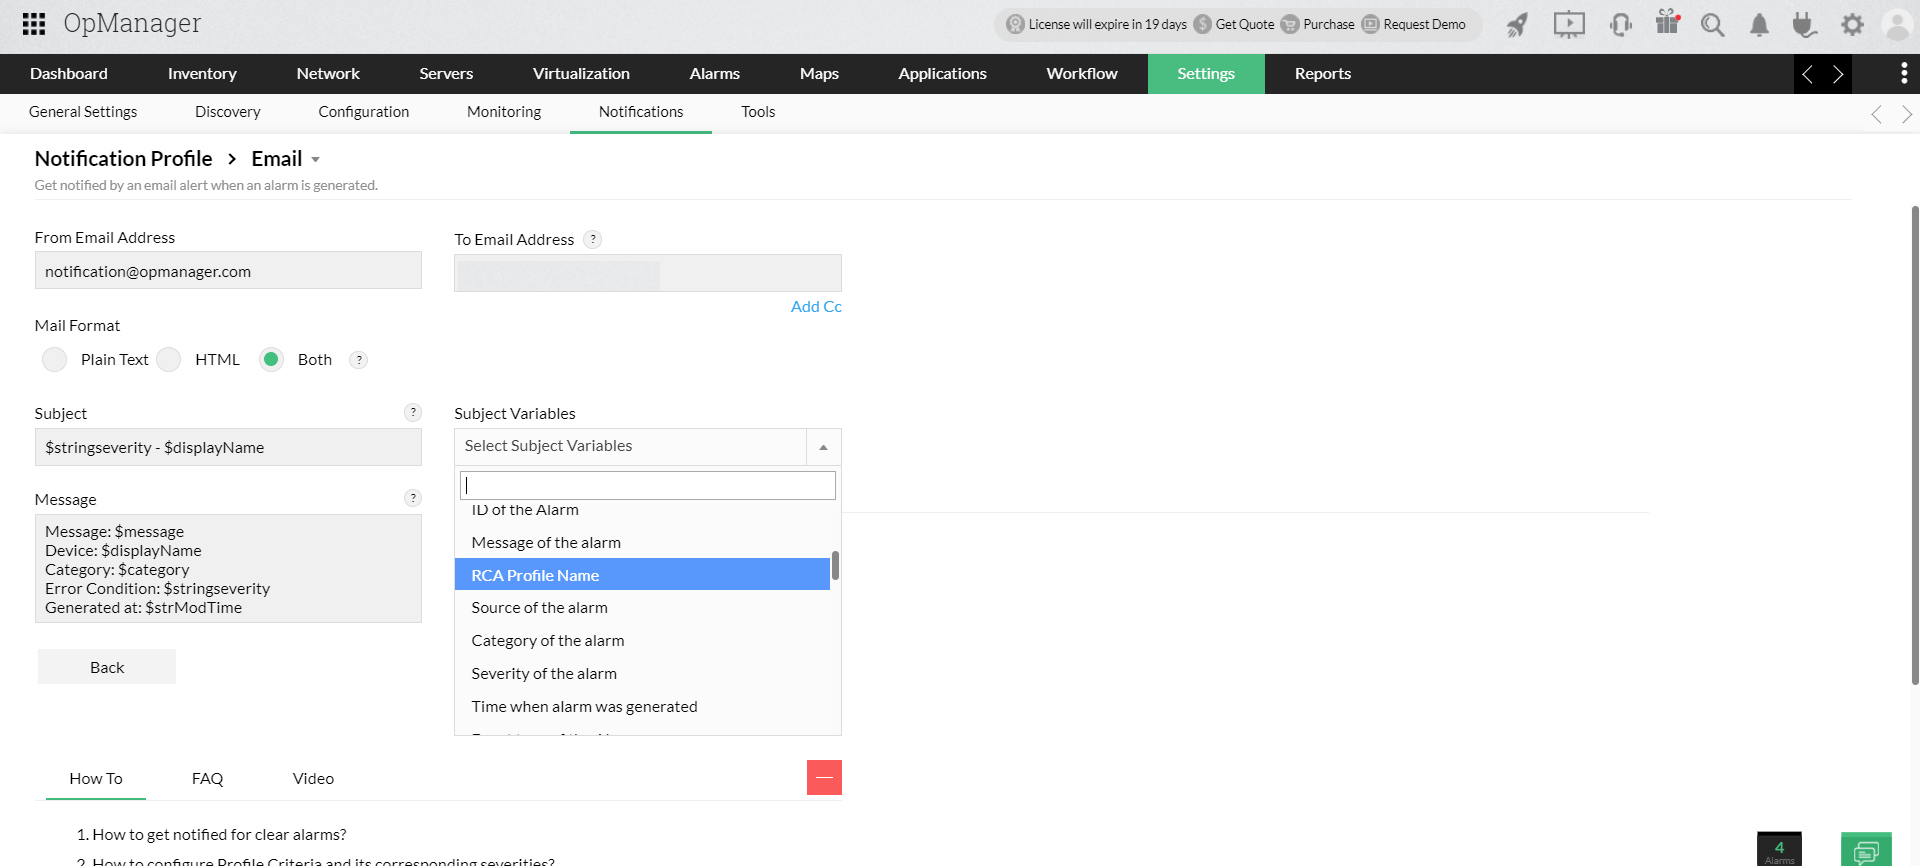
Configuring the notification profile in OpManager enables you to receive instant notifications via various channels, such as email, SMS, etc.
If you have created an RCA Profile with alarm data, you can send the details of that RCA Profile to the user by simply adding a variable with the alarm message.
How critical is RCA for network monitoring?
The CPU utilization skyrockets in a critical machine in your network that hosts important services. This reduces the system performance and impacts the end user. How will you troubleshoot the issue? Where will you start?
To resolve the end users' problems, you need to locate the service which drains the CPU resources. It maybe simple to analyze performance and spot the anomalous service if it is just a single machine. But it will be a tedious and time-consuming task if an entire network site goes down and you have to find the cause.
RCA helps you overcome this uphill challenge. It offers a centralized window where you can visualize IT monitoring information of multiple network components in a single pane of glass to speed up the fault identification process ensuring maximum network uptime.
Get a free and personalized online demo with our experts who can answer all your product related queries.