Real user monitoring for full-stack observability

Your APM traces tell you what happened on the server. Real user monitoring tells you what your users experienced in the browser. OpManager Nexus connects both, so you see the complete picture from the first click to the last database query, in one console.

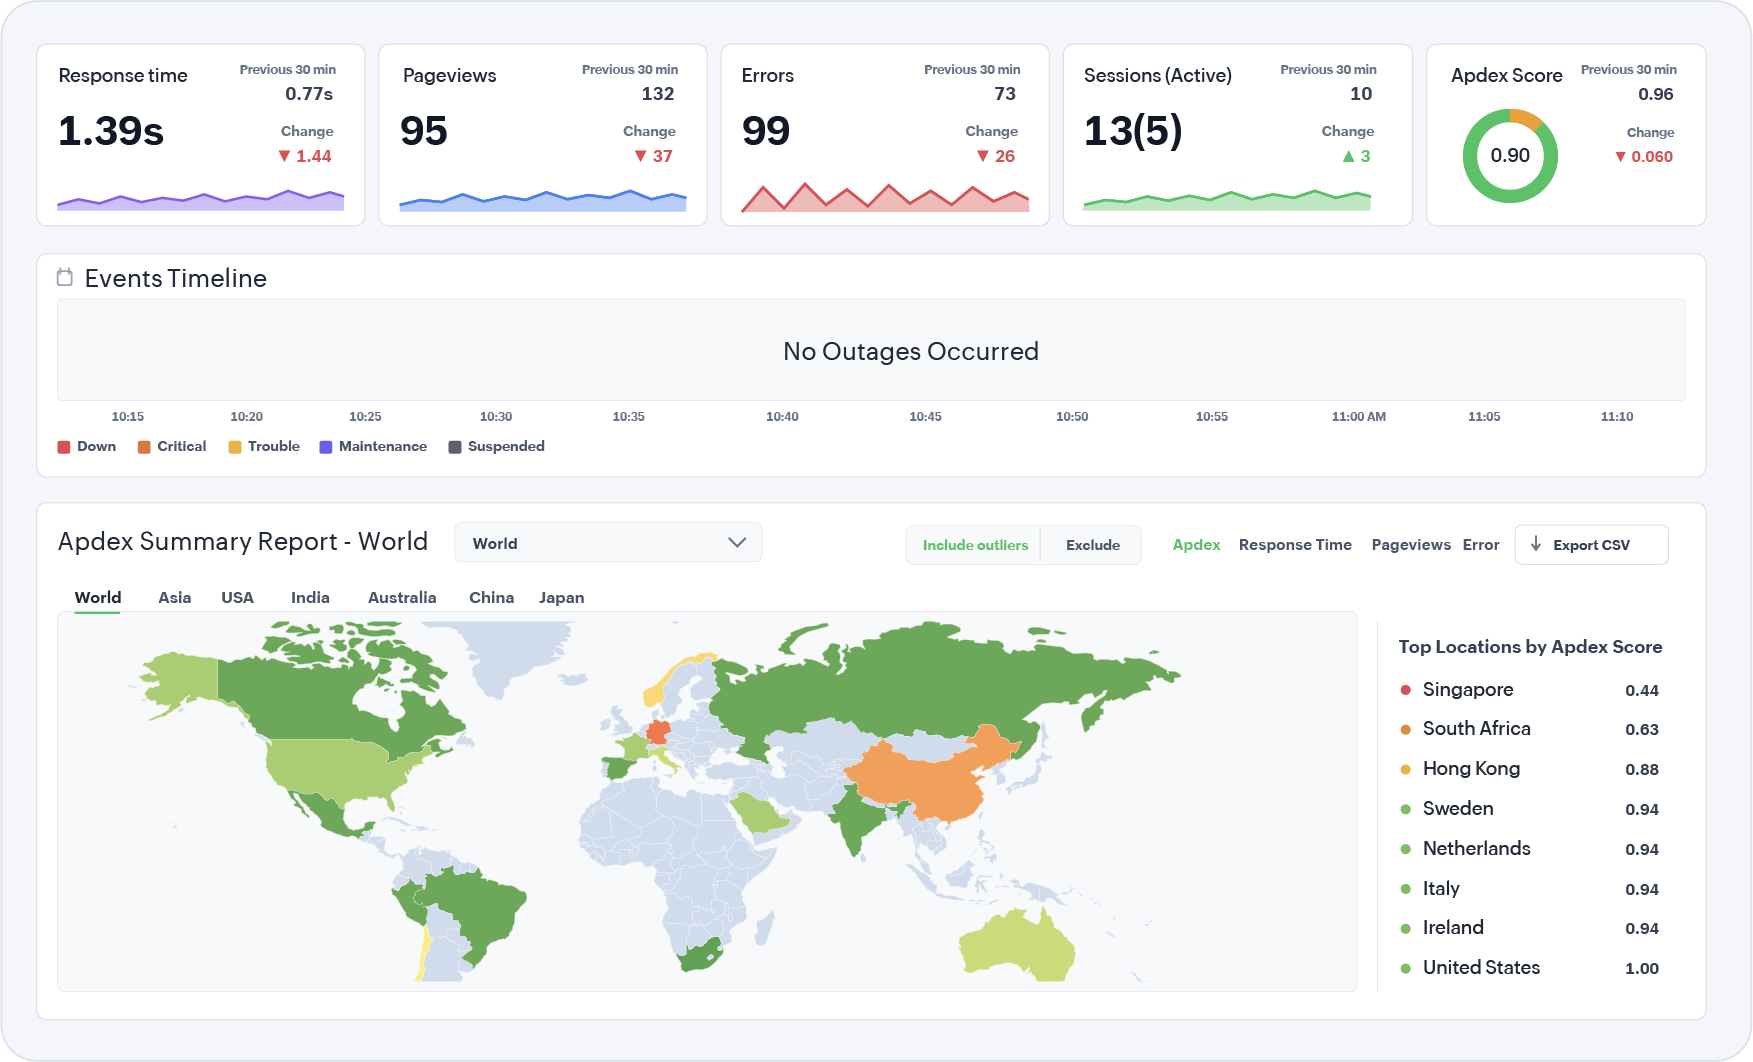
Real user monitoring dashboard

Overview

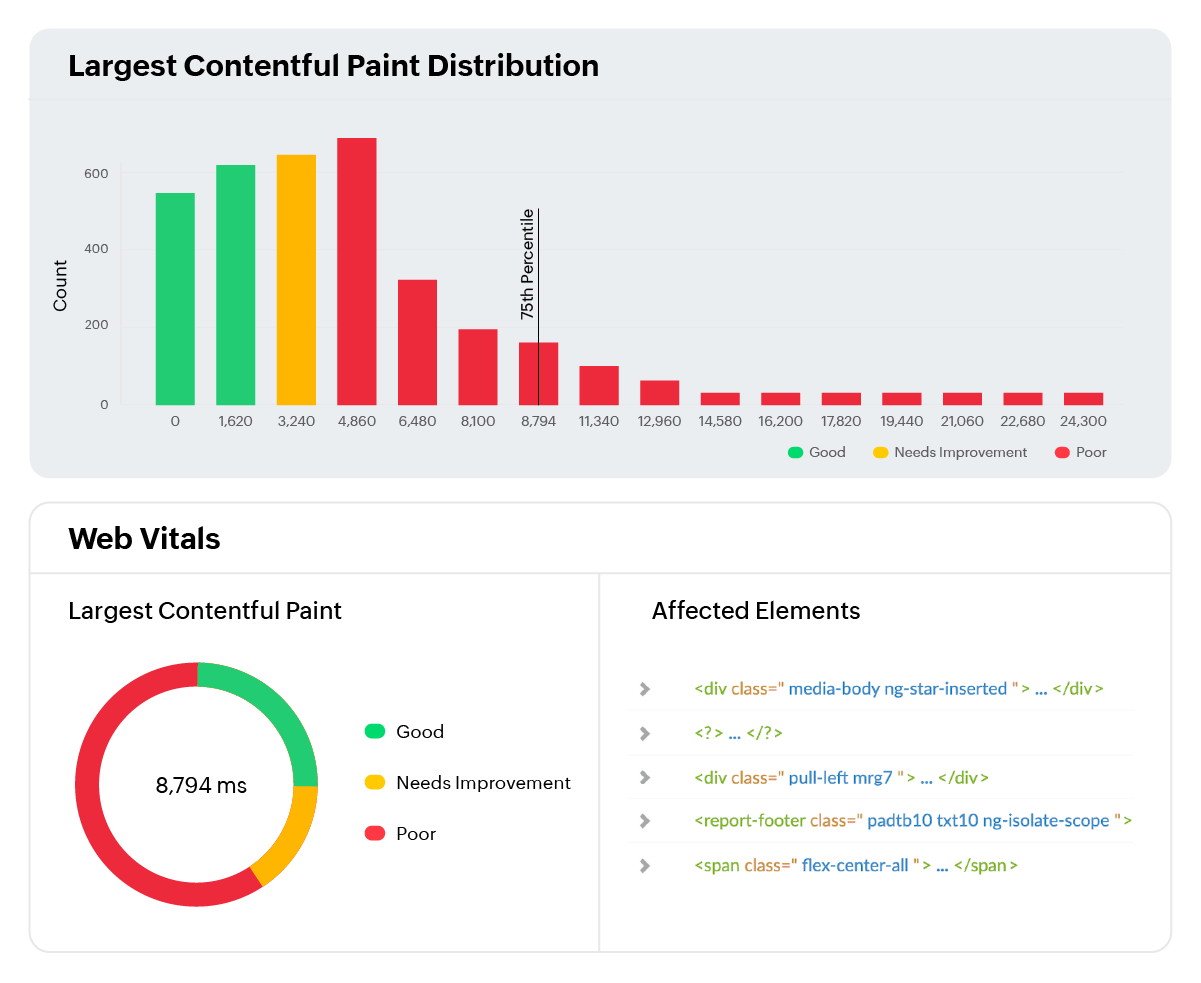
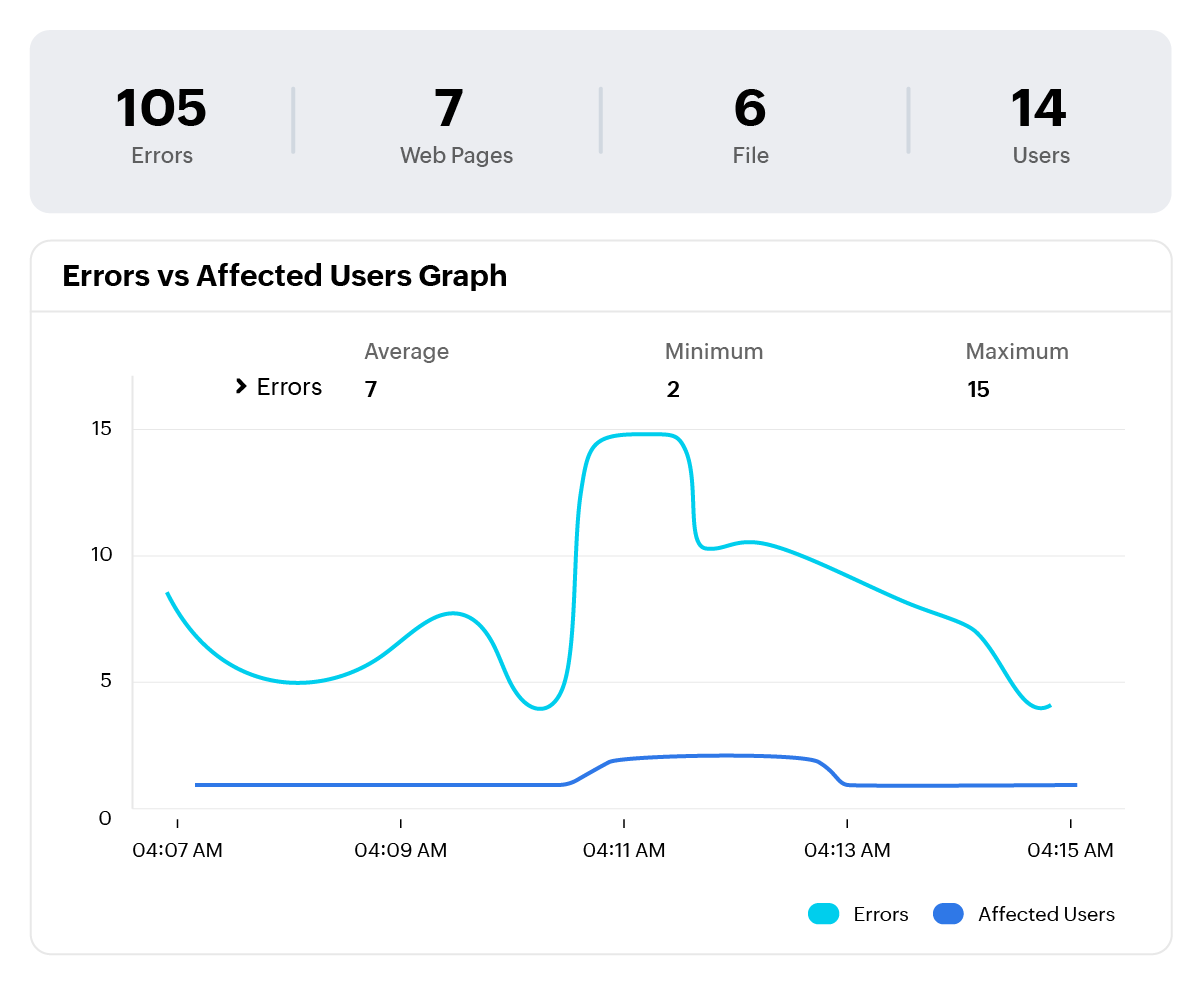
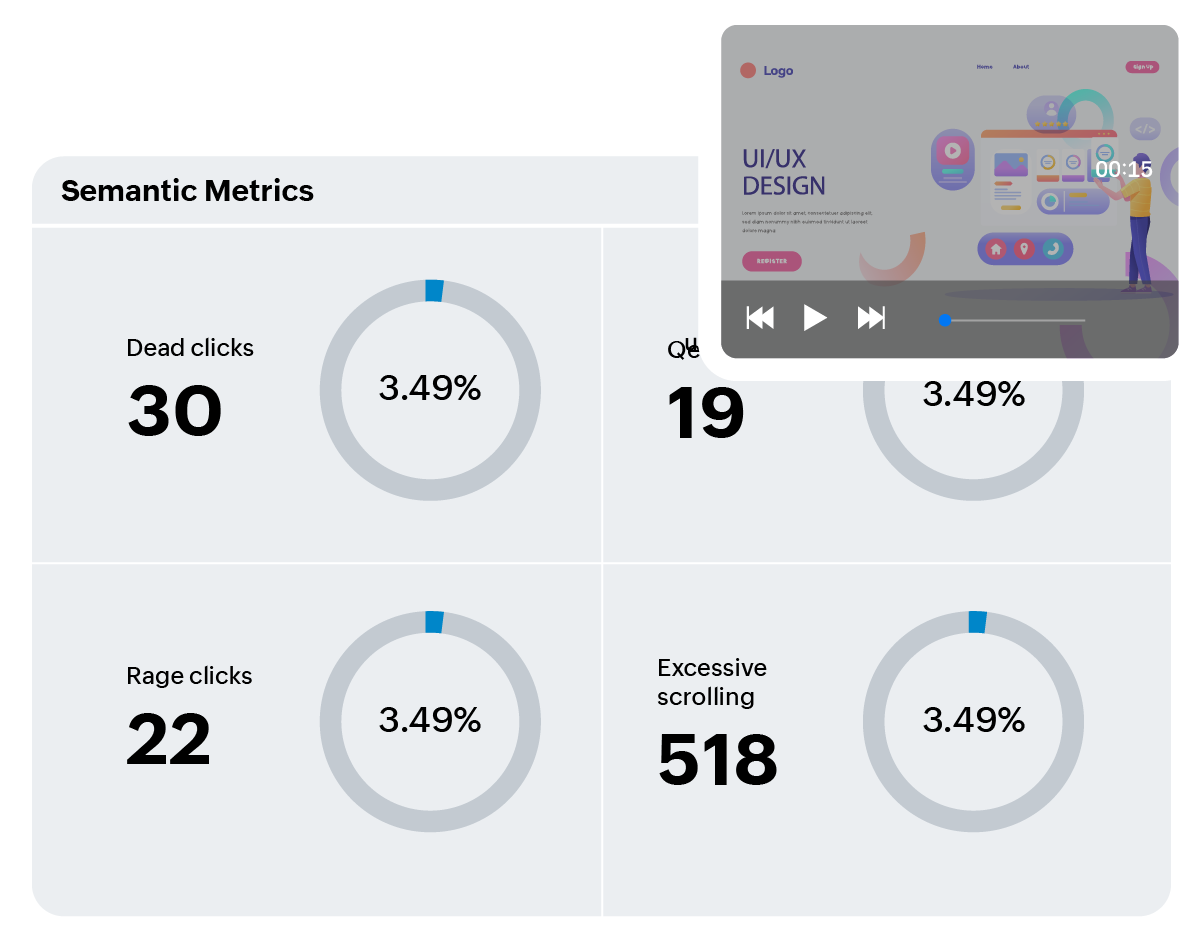
OpManager Nexus extends full-stack observability to the browser. Real user monitoring (RUM) captures telemetry directly from actual user sessions, Core Web Vitals, JavaScript errors, resource timings, and session replay, and correlates it with the APM traces and infrastructure metrics already in your OpManager Nexus console. The result is complete end-to-end visibility from the user's first interaction to the server-side root cause, with no tool switching and no manual trace correlation.
Why OpManager Nexus RUM is different from a standalone tool

Standalone RUM tools show you that users are experiencing slowness. OpManager Nexus shows you why, because the browser data and the backend data live in the same platform.

Full-stack in one console

Full-stack in one console

Browser session, APM trace, server log, database query, and infrastructure metrics, all correlated automatically. No manual timestamp matching. No tool switching during incidents.

Production context, not lab data

Production context, not lab data

Real sessions across real geographies, devices, ISPs, and network conditions. RUM captures what users actually experience when your application is running, not what probes simulate from controlled locations.

Open standards, no lock-in

Open standards, no lock-in

OpManager Nexus RUM is built on OpenTelemetry from the ground up. Instrument once with the OTel SDK. Your telemetry is portable and your instrumentation effort is reusable across vendors.

Privacy by default

Privacy by default

GDPR, HIPAA, CCPA, ISO 27001, and SOC 2 Type II compliant. Session replays mask sensitive fields automatically. EU data center options available. No PII is ever captured in raw form.

Get started with
OpManager Nexus

Start your free 30-day trial and add real user monitoring to the observability stack your team is already running.

Start your free trial