Manage rules
Last updated on:
In this page
- Overview
- Accessing the Manage Rules module
- Fields in the manage rules table
- Actions column
- Enable/Disable rules
- Clone a rule
- Edit a rule
- Delete rule(s)
- Filter rule(s)
- Other configurations to manage rules
- Rule Name column
- Rule Details
- Prerequisites
- Mitigation
- Execution Details
- Rule tuning
- Severity
- MITRE Att&ck Mapping
- Tags
- Execution Mode & Status
- Alert Profiles
- Created By
- Rule Type
- Installed Time
- Last Modified Time
- Detections
- Scheduled Reports
Overview
This page explains how to use the Manage Rules module to oversee all detection rules in a centralized view. It covers actions such as enabling, disabling, cloning, editing, deleting, filtering, and importing/exporting rules. Each rule entry provides detailed information, including severity, MITRE ATT&CK mapping, tags, execution mode, alert profiles, and detection history. Additional features such as rule tuning, prerequisites, and mitigation steps help administrators refine detections, improve performance, and align rules with security frameworks.
Accessing the Manage Rules module
-
Navigate to the Security tab via the dashboard and click on
Manage Rule as highlighted
below.
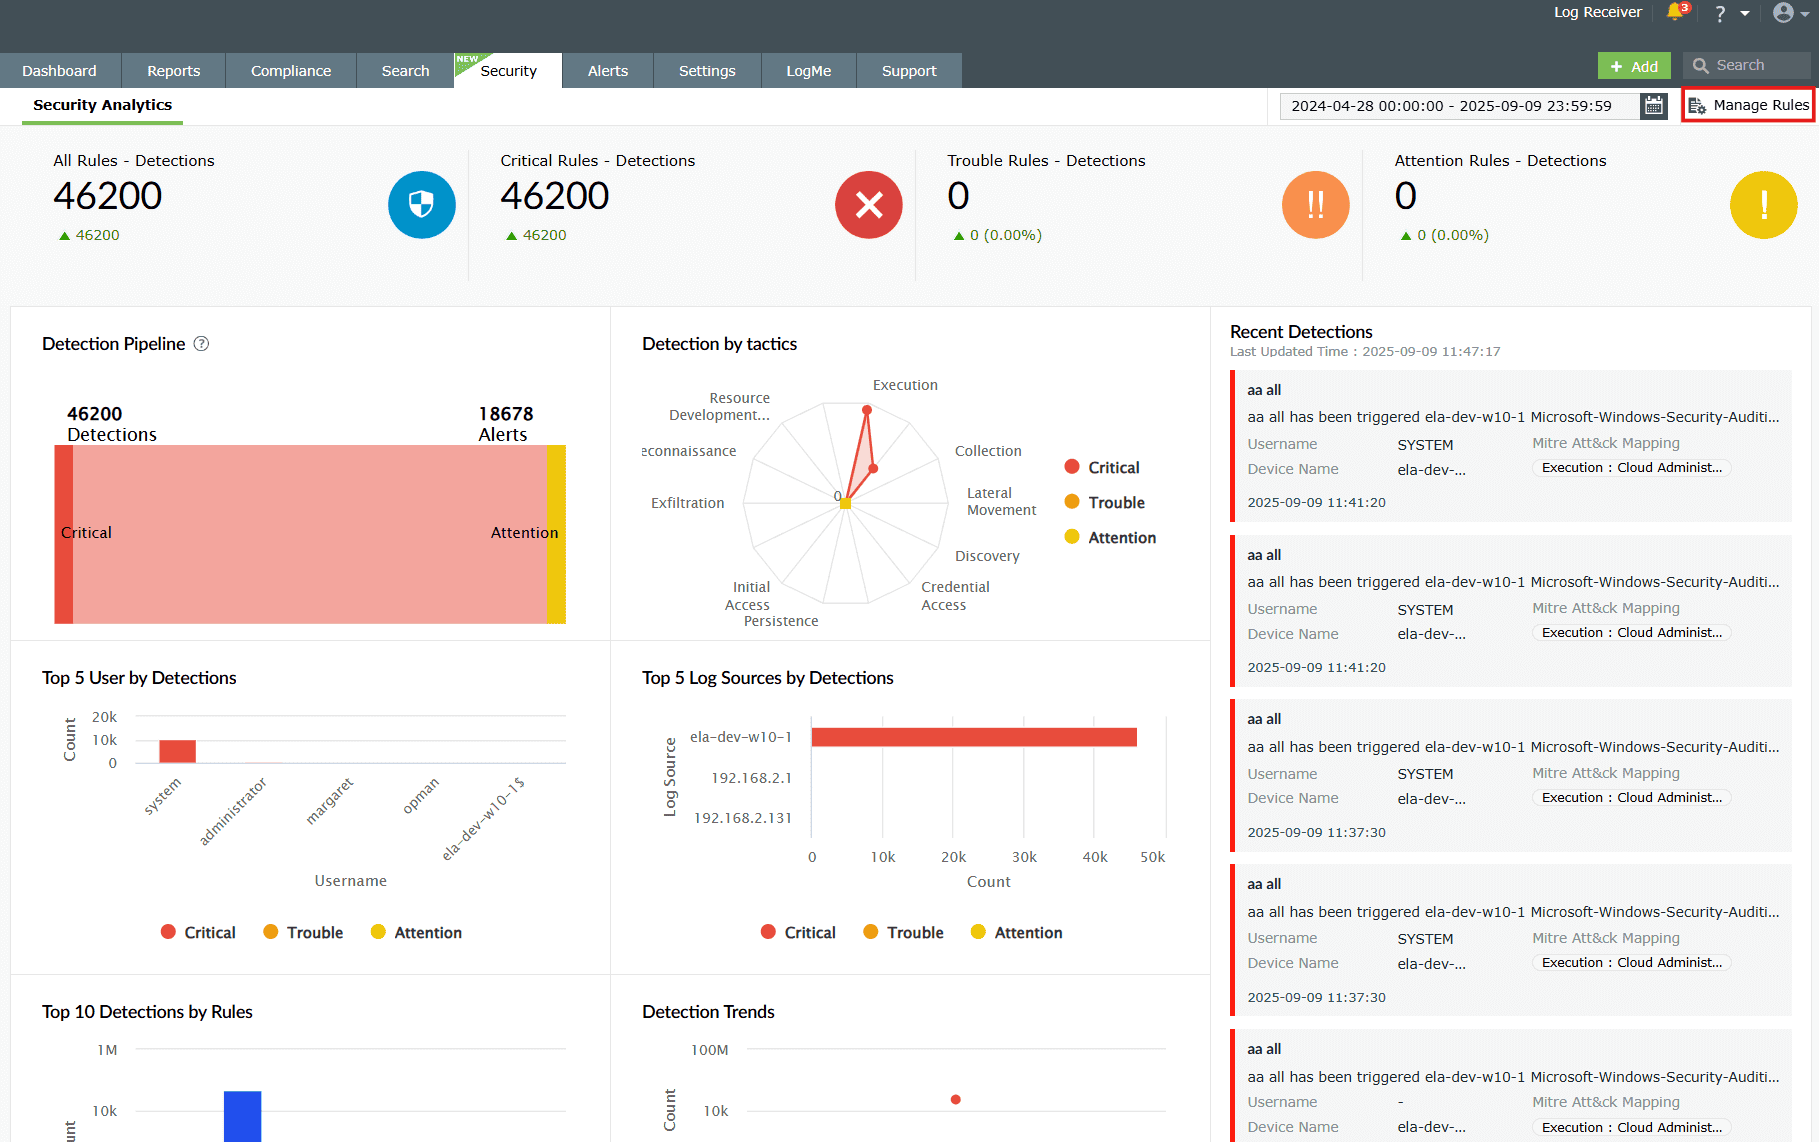
Image 1: Manage rules in security dashboard -
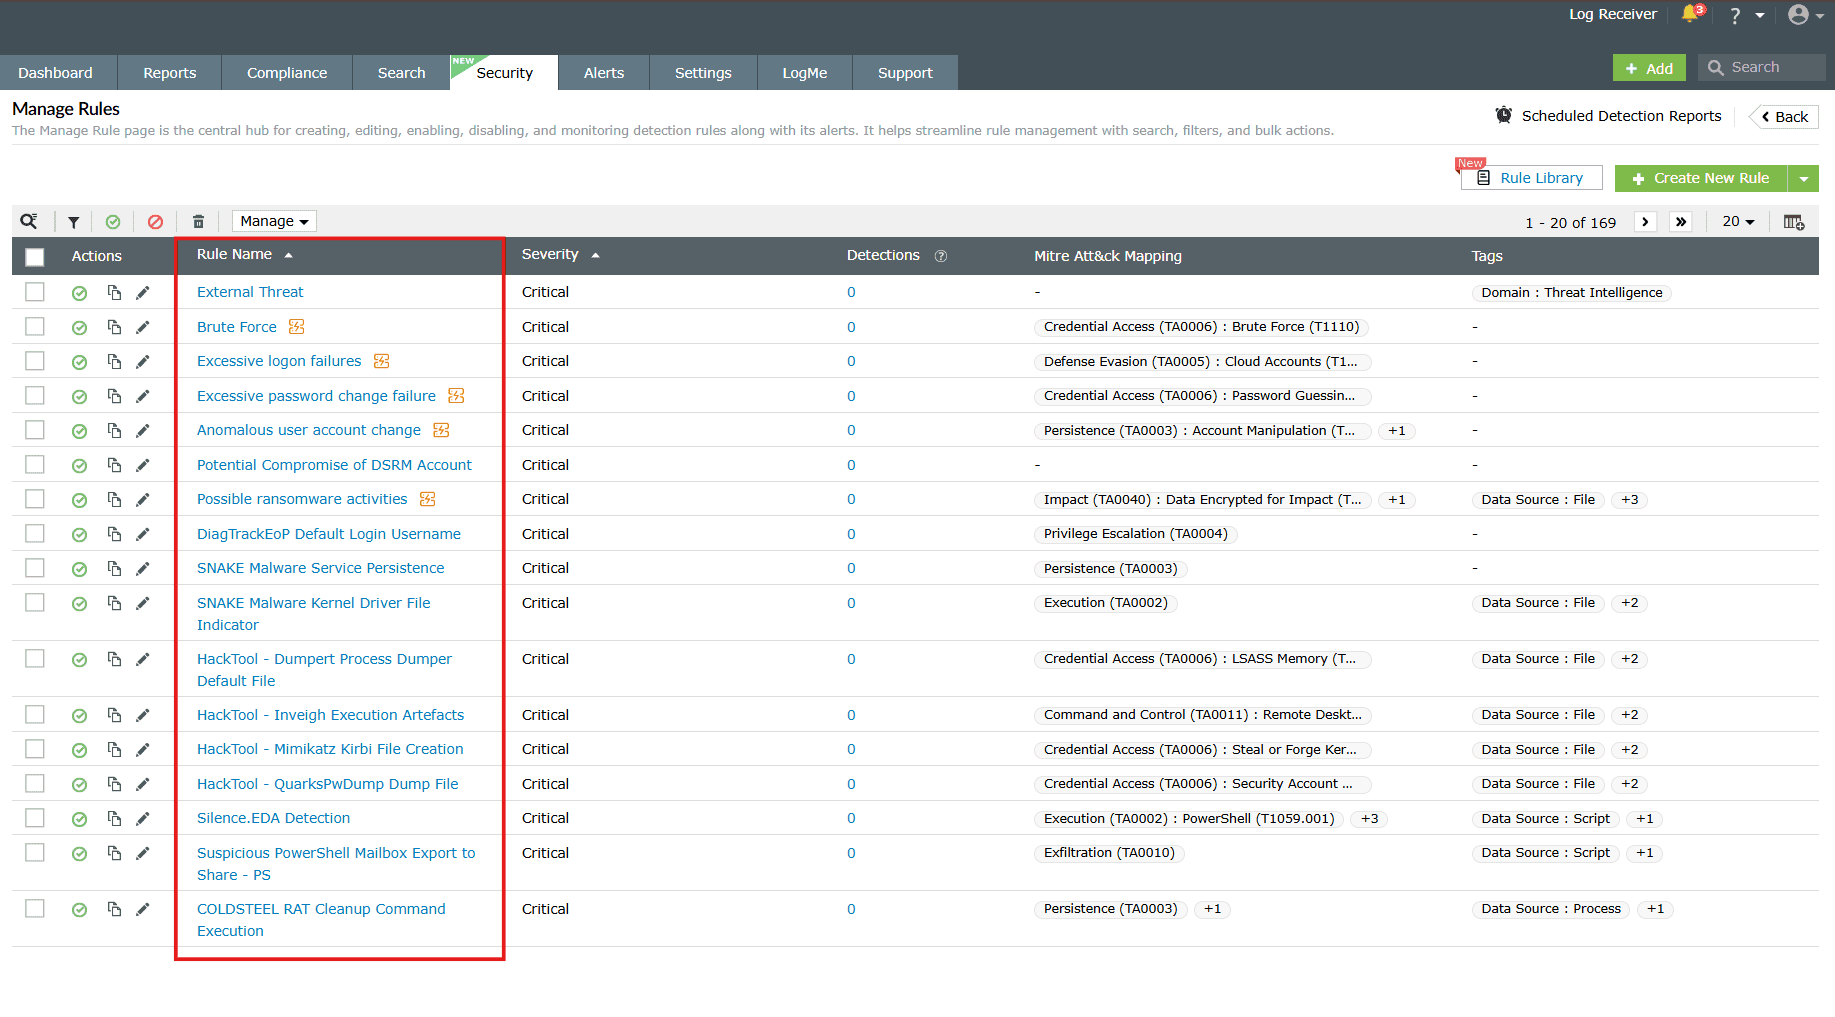
You will be taken to the Manage Rules page with the complete list of
rules as shown in
the below image. It is the central hub for creating, editing, enabling, disabling, and
monitoring detection rules along with its alerts. It helps streamline rule management
with search, filters, and bulk actions.
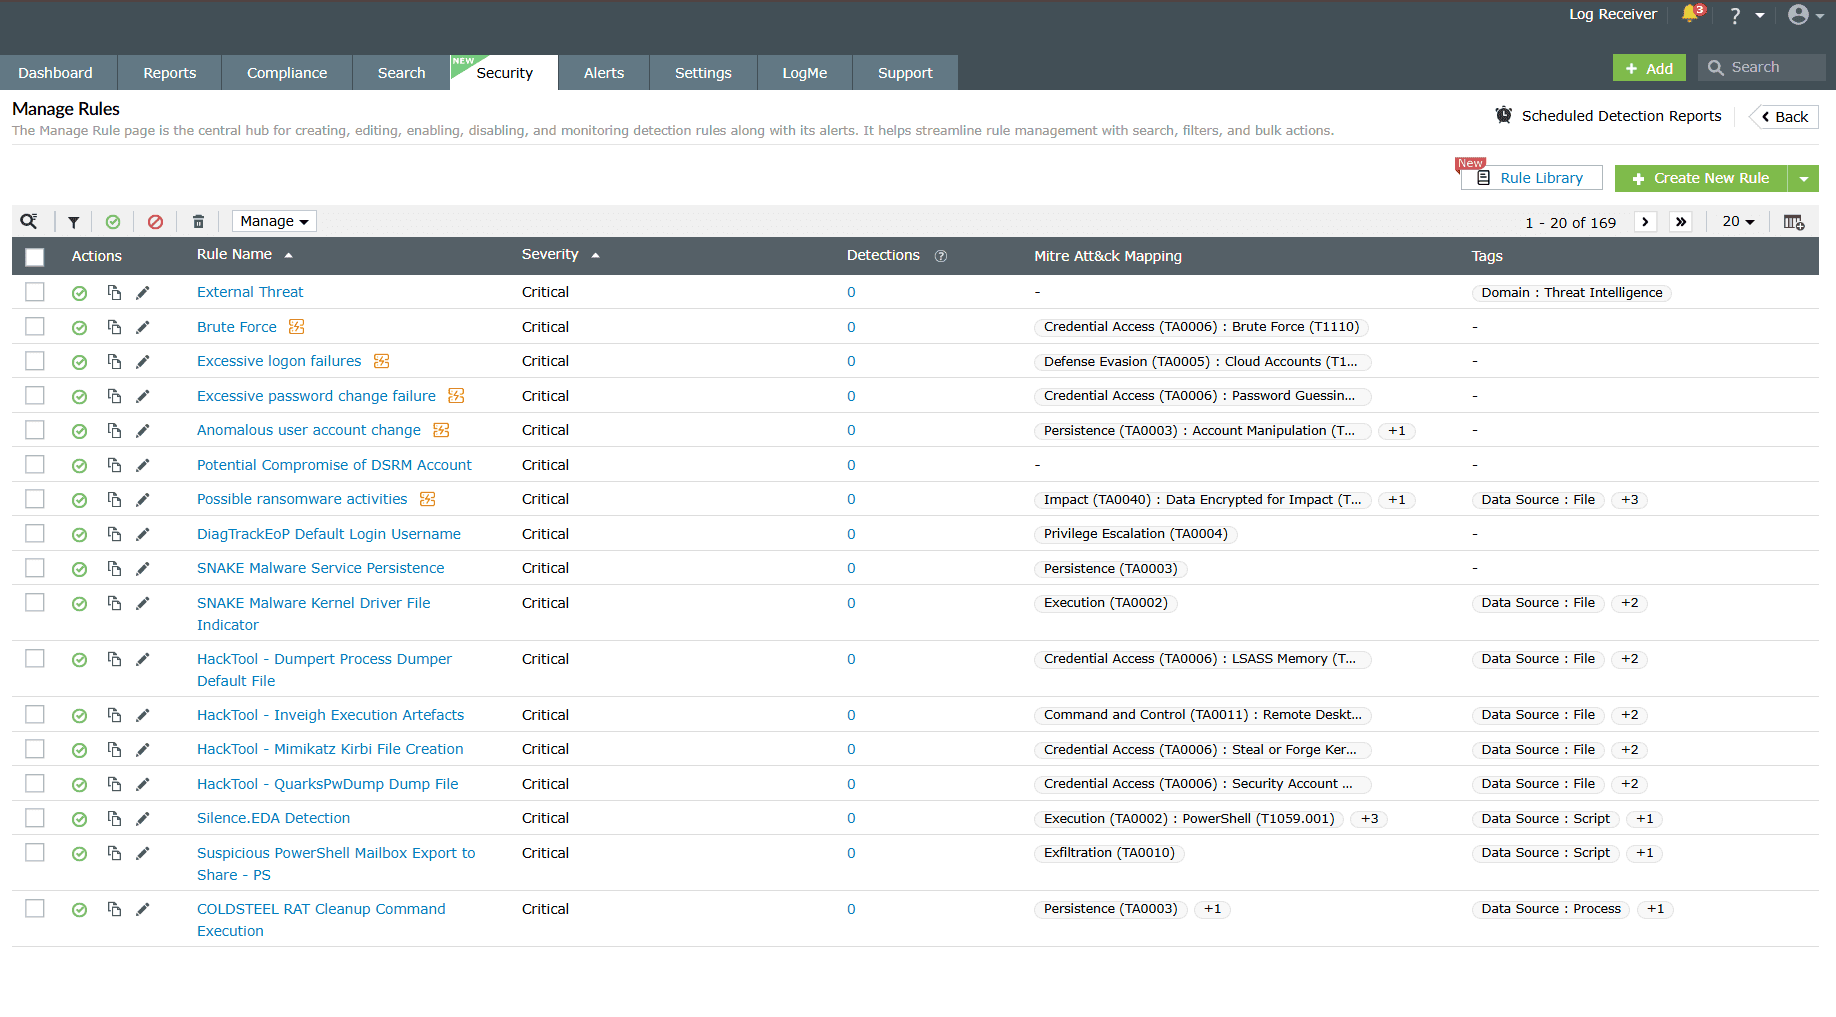
Image 2: Manage rules module via the security dashboard
Fields in the manage rules table
A. Actions column
The actions column acts as a medium for you to take required actions on the rule(s) as per your needs. Below are the available rule actions in the Manage Rules module.
- Enable/disable rules
- Clone rule
- Edit rule
- Delete rule(s)
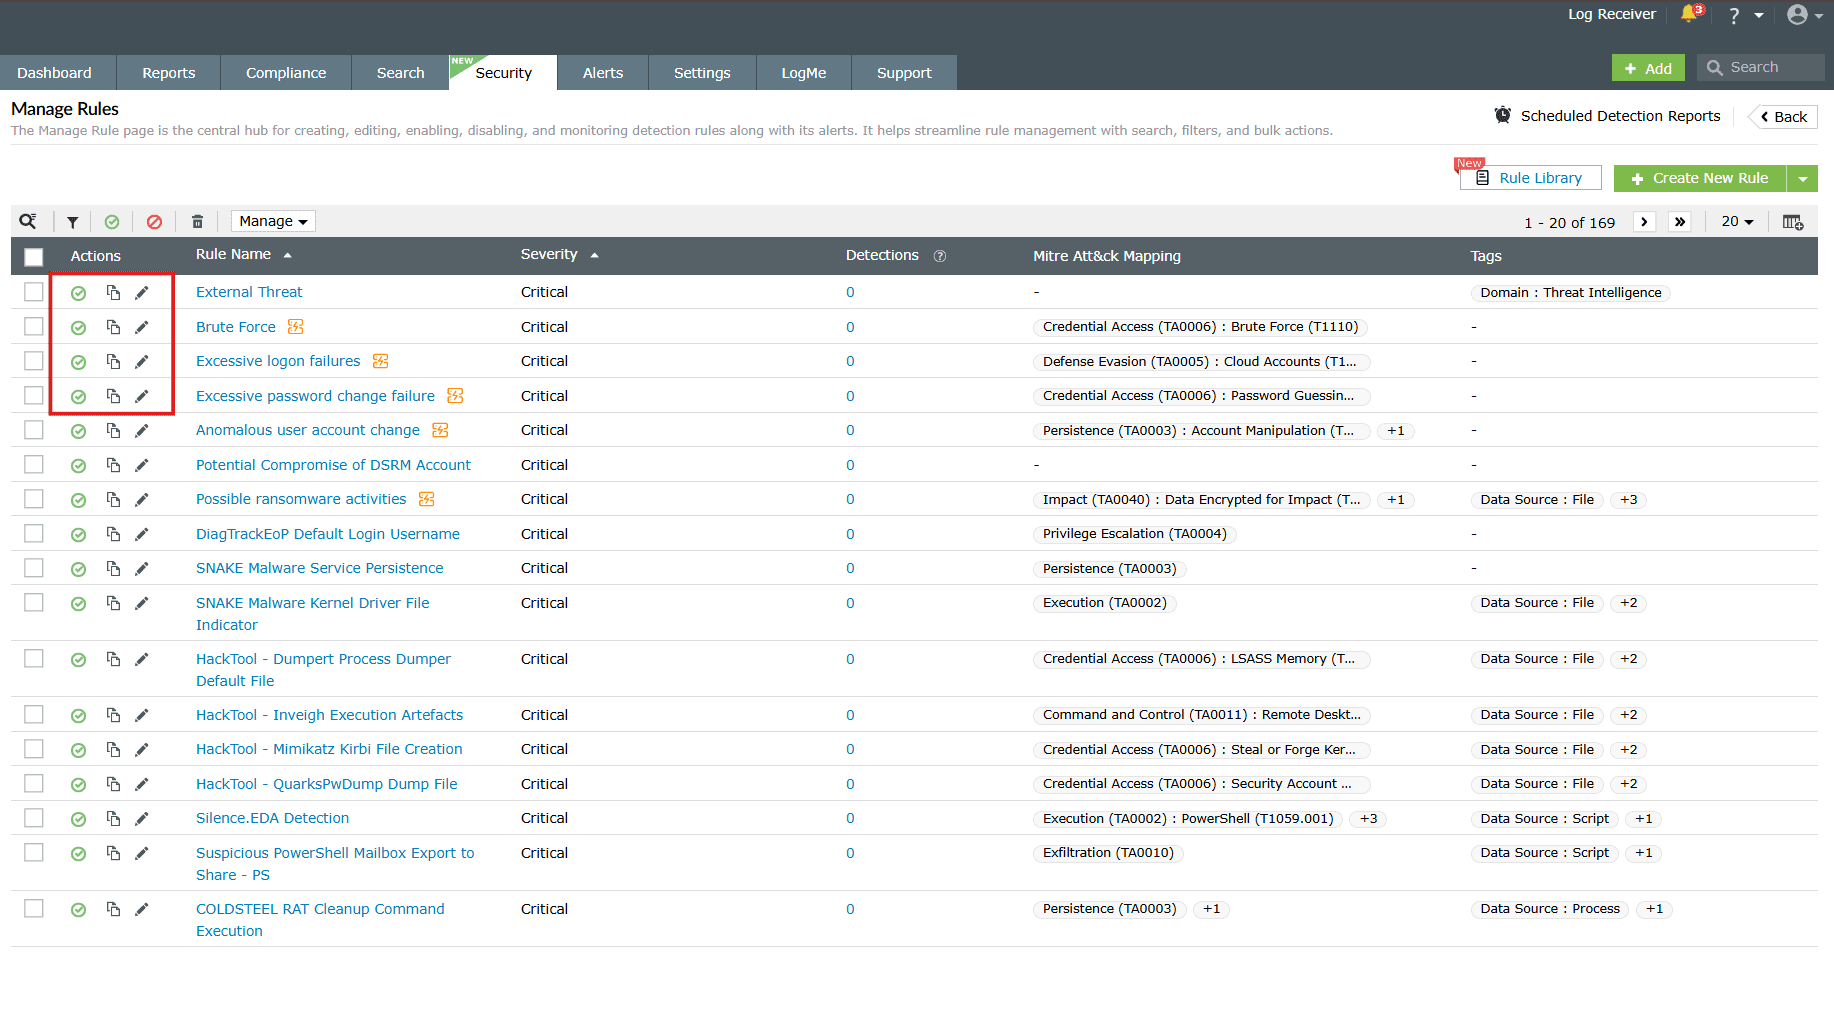
Enable/Disable rules
Enabling a rule
-
Click on the disabled icon
 under the
Actions column to enable the rule.
under the
Actions column to enable the rule.
-
As soon as you perform this action, the icon indicates that the rule is now enabled
 and
the below pop-up message appears briefly.
and
the below pop-up message appears briefly.

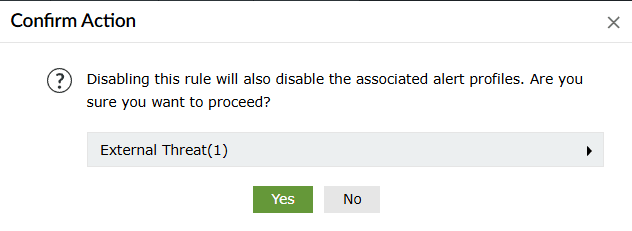
Disabling a rule
-
Click on the enabled icon under the
Actions column to disable the rule.
-
A confirm action pop-up will appear if an alert profile is associated with the said
rule. Click on Yes to proceed.
-
As soon as you perform this action, the icon indicates that the rule is now disabled
and
the below pop-up message appears briefly.

Enable/Disable multiple rules at once
- Click on the empty checkbox(es) in the first column in order to select the respective rules.
-
Click on the Enable/Disable icons in the ribbon above the rules list.
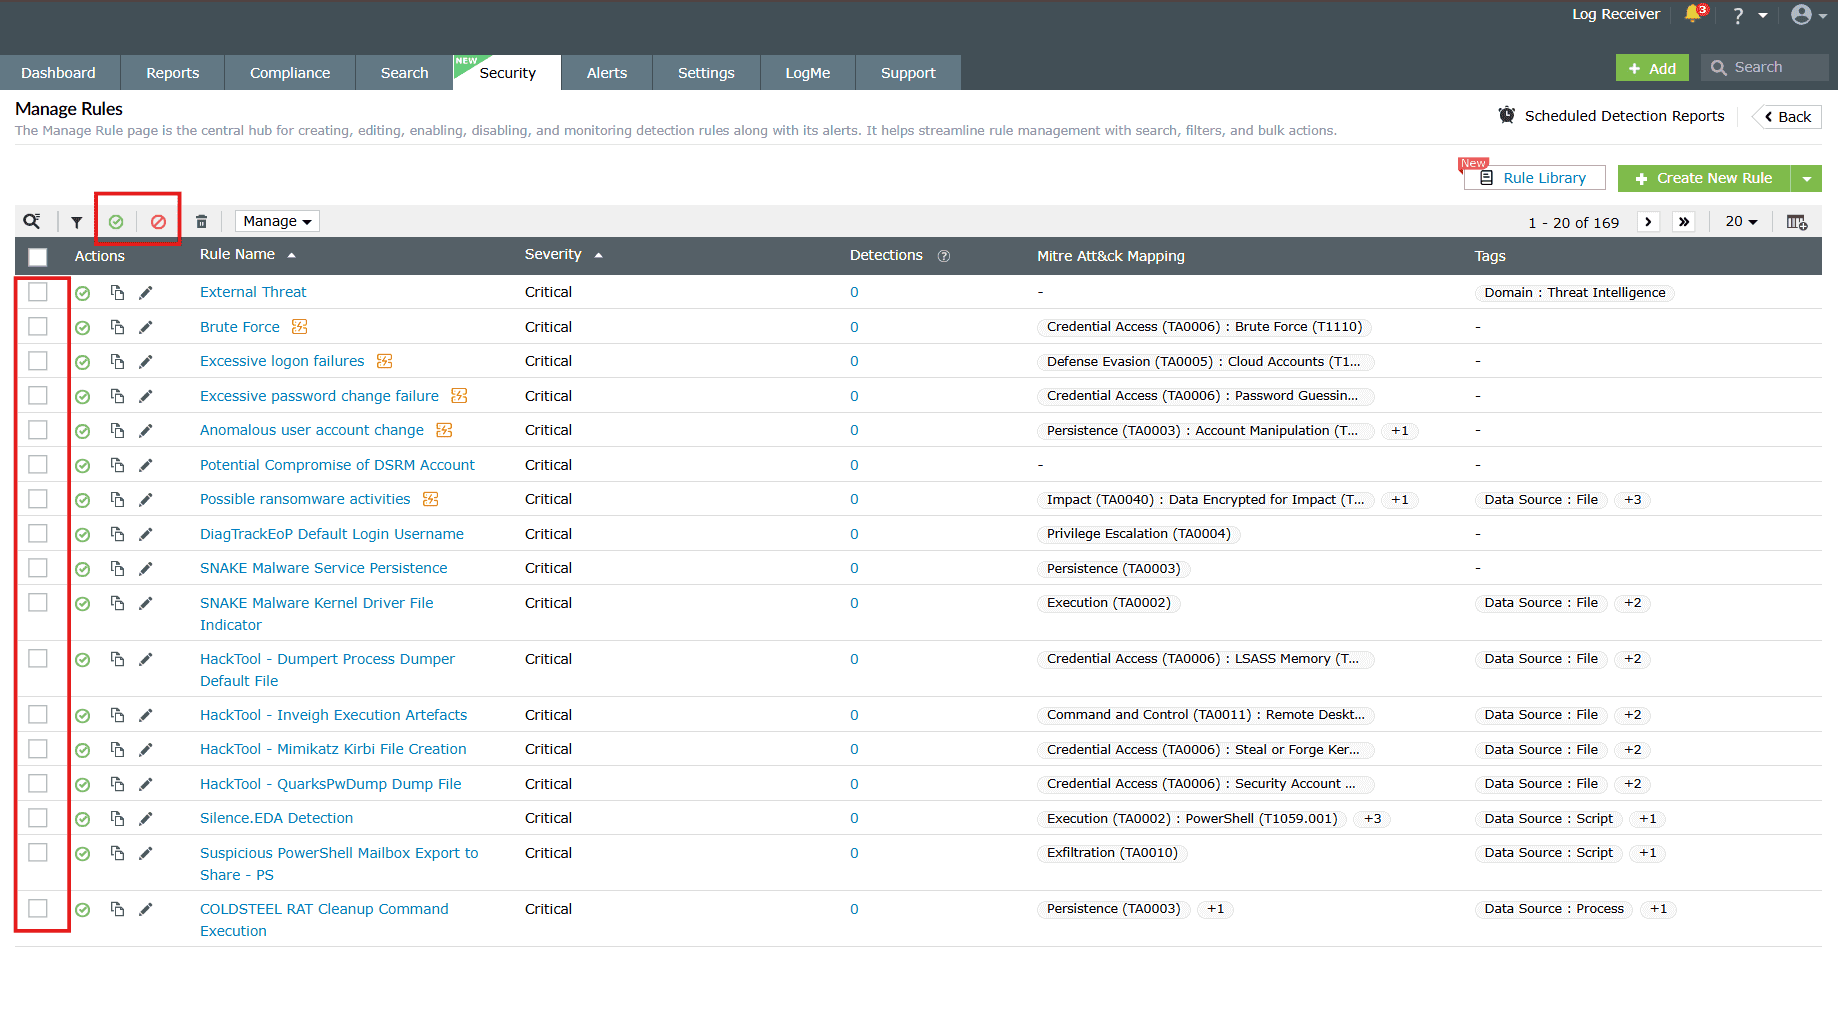
Image 4: Bulk actions in the manage rules module - Upon successful completion of the action, the below pop-up appears.
When enabled:

When disabled:

Clone a rule
- Click on the Clone icon
 under the
Actions column to
clone the respective rule.
under the
Actions column to
clone the respective rule. - Depending upon the rule type—Standard, Anomaly, or Advanced—you will be taken to the specific configuration page of that particular rule.
- Make the necessary changes in the field values in order to customize the cloned rule and click on Create.
- Upon successful completion of the action, the below pop-up appears.

Edit a rule
- Click on the Edit icon
 under the
Actions column to
edit the respective rule.
under the
Actions column to
edit the respective rule. - Depending upon the rule type—Standard, Anomaly, or Advanced—you will be taken to the specific configuration page of that particular rule.
- Make the necessary edits in the field values and click on Update.
- The rule will be updated instantly in the rules list.
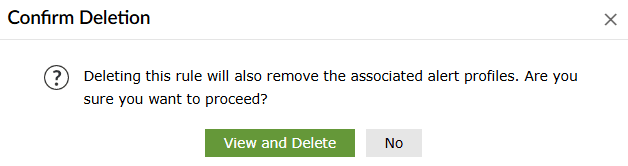
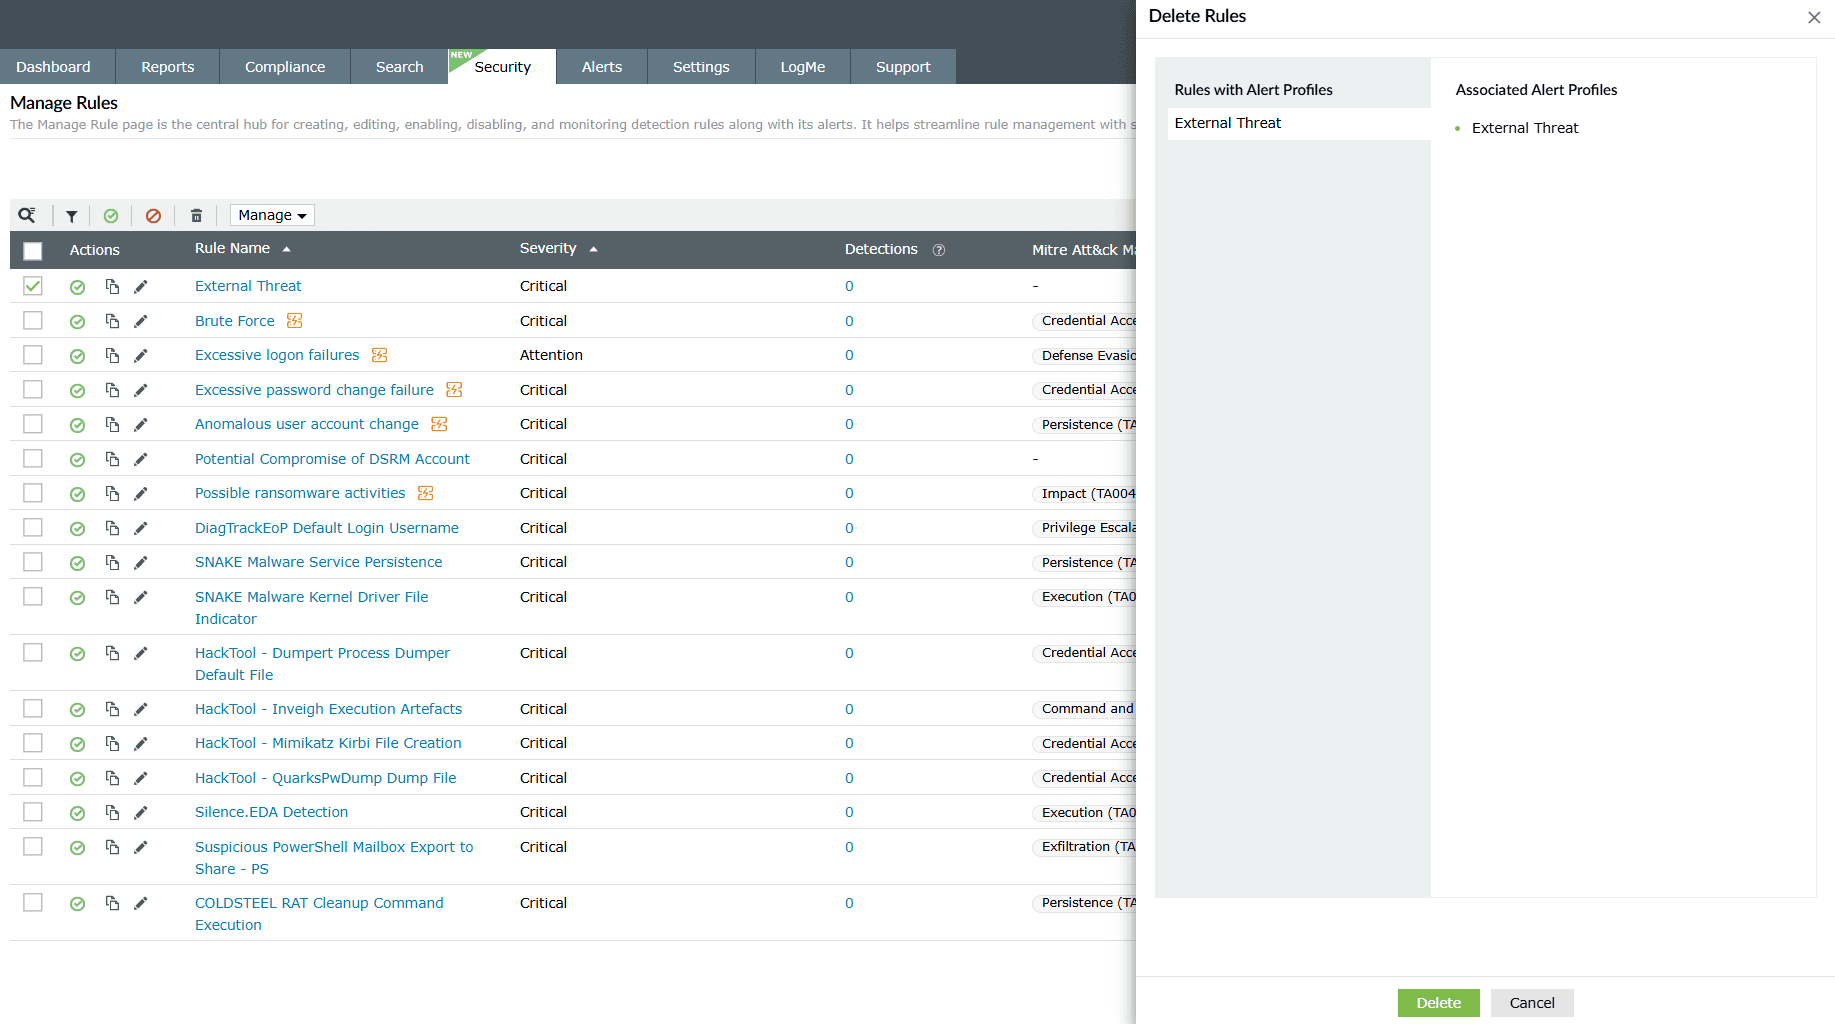
Delete rule(s)
- Click on the empty checkbox(es) in the first column in order to select the respective rules.
- Then click on the Delete icon
 in the ribbon above the
rules list.
in the ribbon above the
rules list. - A Confirm Action pop-up appears. Click on Delete.
- Upon successful completion of the action, the below pop-up appears.

Filter rule(s)
- Click on the Filter icon in the ribbon above the rules list.
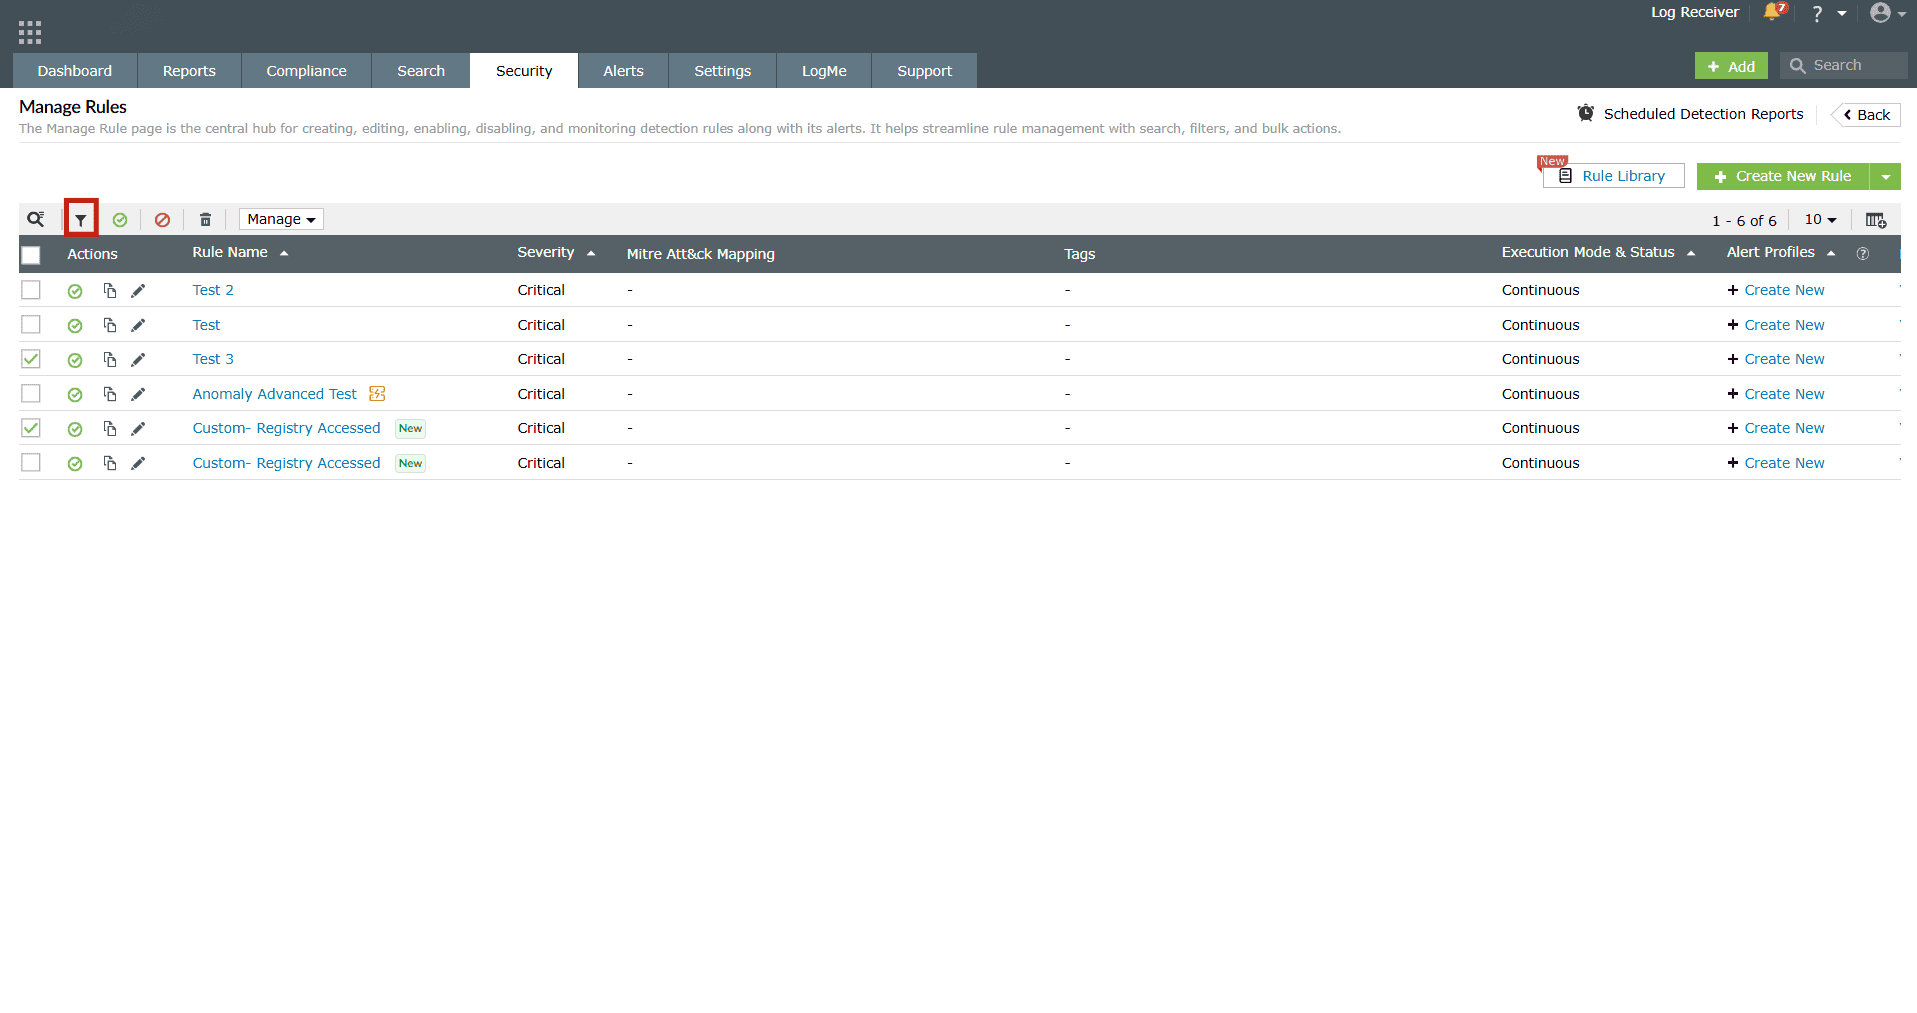
Image 6: Filtering rules in the manage rules module - The following filter options appear.
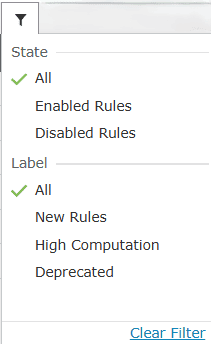
- You can choose multiple filters at once. Click on a filter to select it. Click on it again if you want to deselect it. The rules get filtered instantly as you click on any filter option.
- Click on the Clear Filter option to undo all/any filtering that has been done to the rules.
Other configurations to manage rules
- Click on the empty checkbox(es) in the first column in order to select the respective rules you wish to configure.
- In the ribbon above the list of rules, an option to further Manage
rules is available.
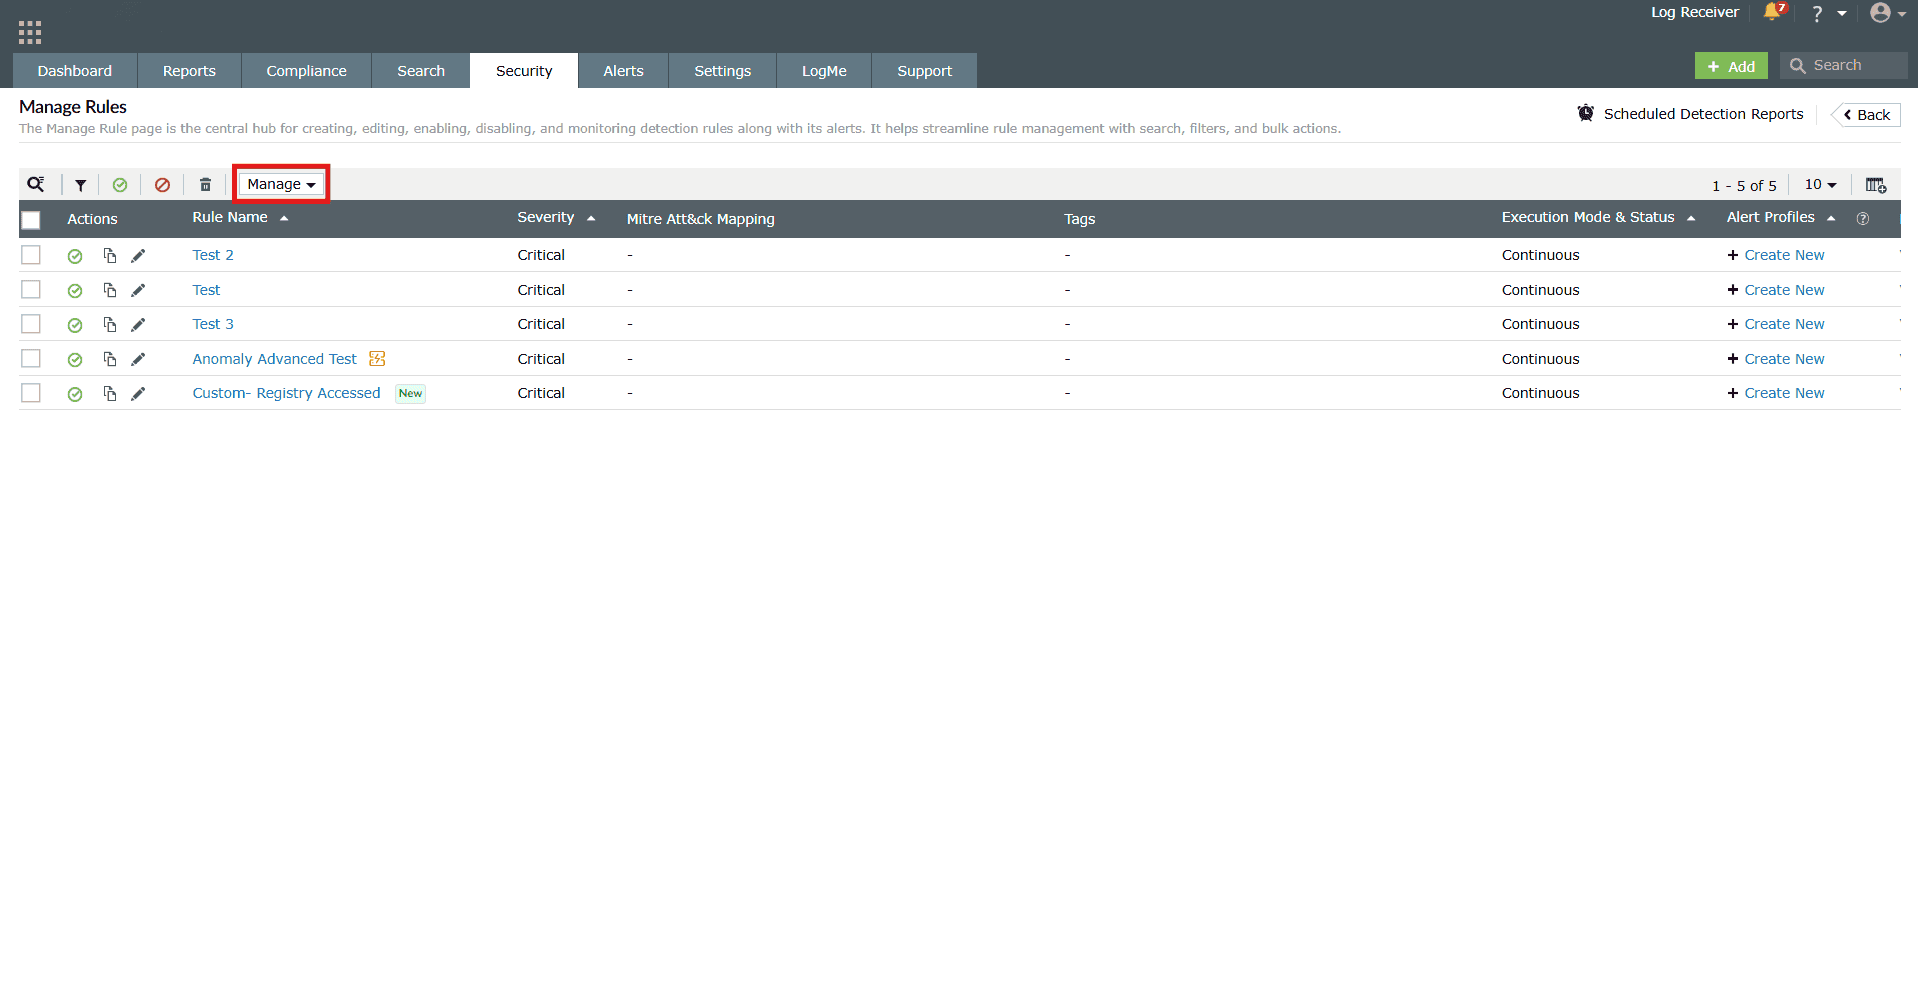
Image 7: Managing rules in the manage rules module - Click on it for the Manage tab to expand the configurations.
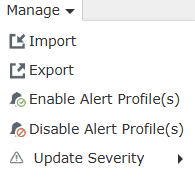
-
Configurations:
- Import:
- Import the desired rules by uploading a file containing the rules and then click on View and Import. The rules will be verified and then imported into the rules.
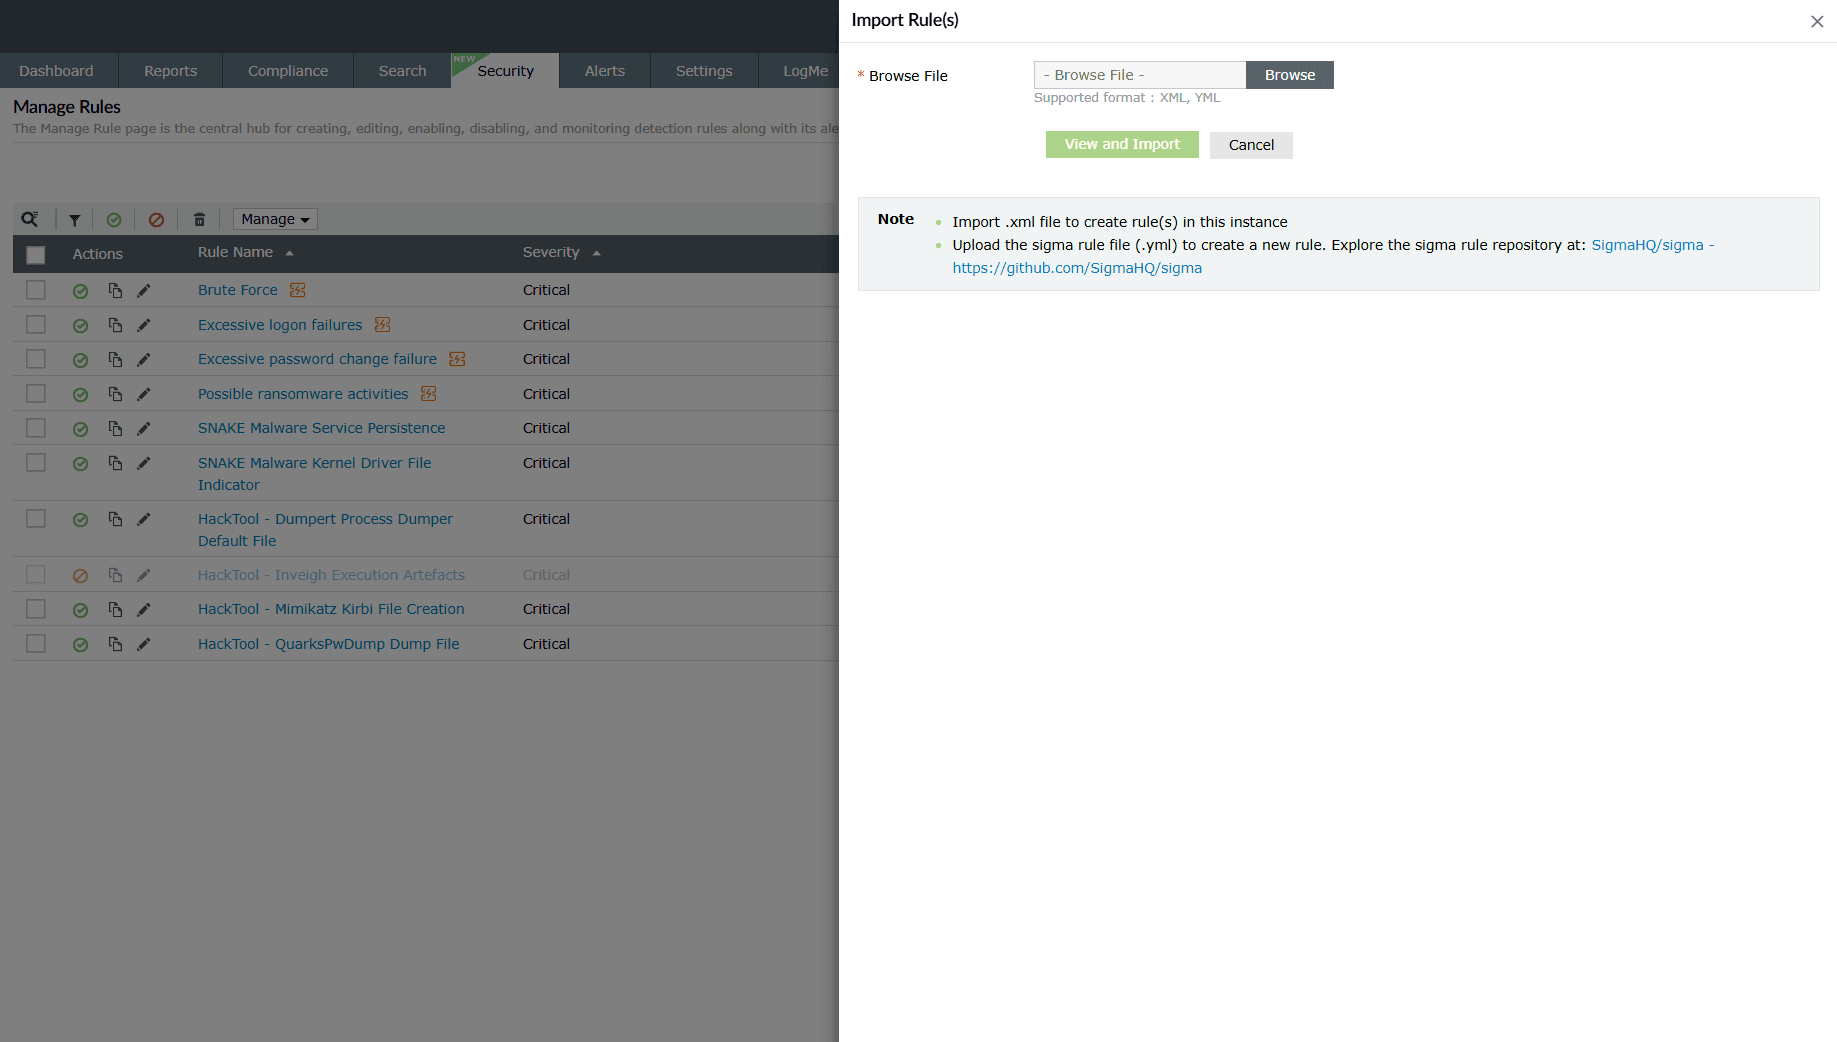
Image 8: Importing rules in the product NOTE In case you reach the limit for maximum number of Active High Computation rules, the rules will be imported as a disabled rule. - You can import Sigma rules into the product to automate detection and alerting based on standardized rule definitions.
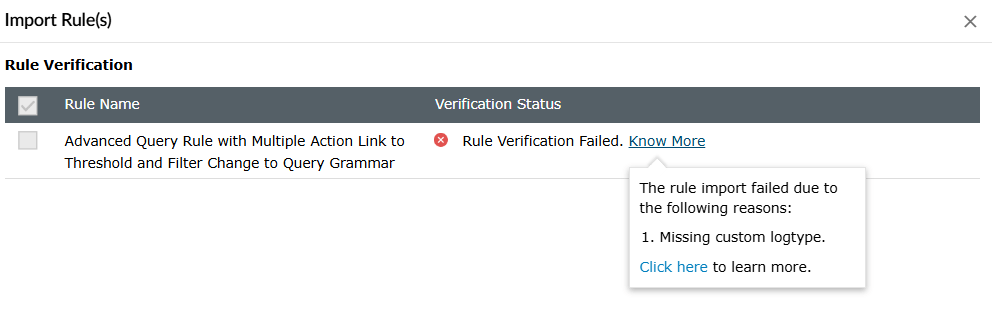
Rule import preview
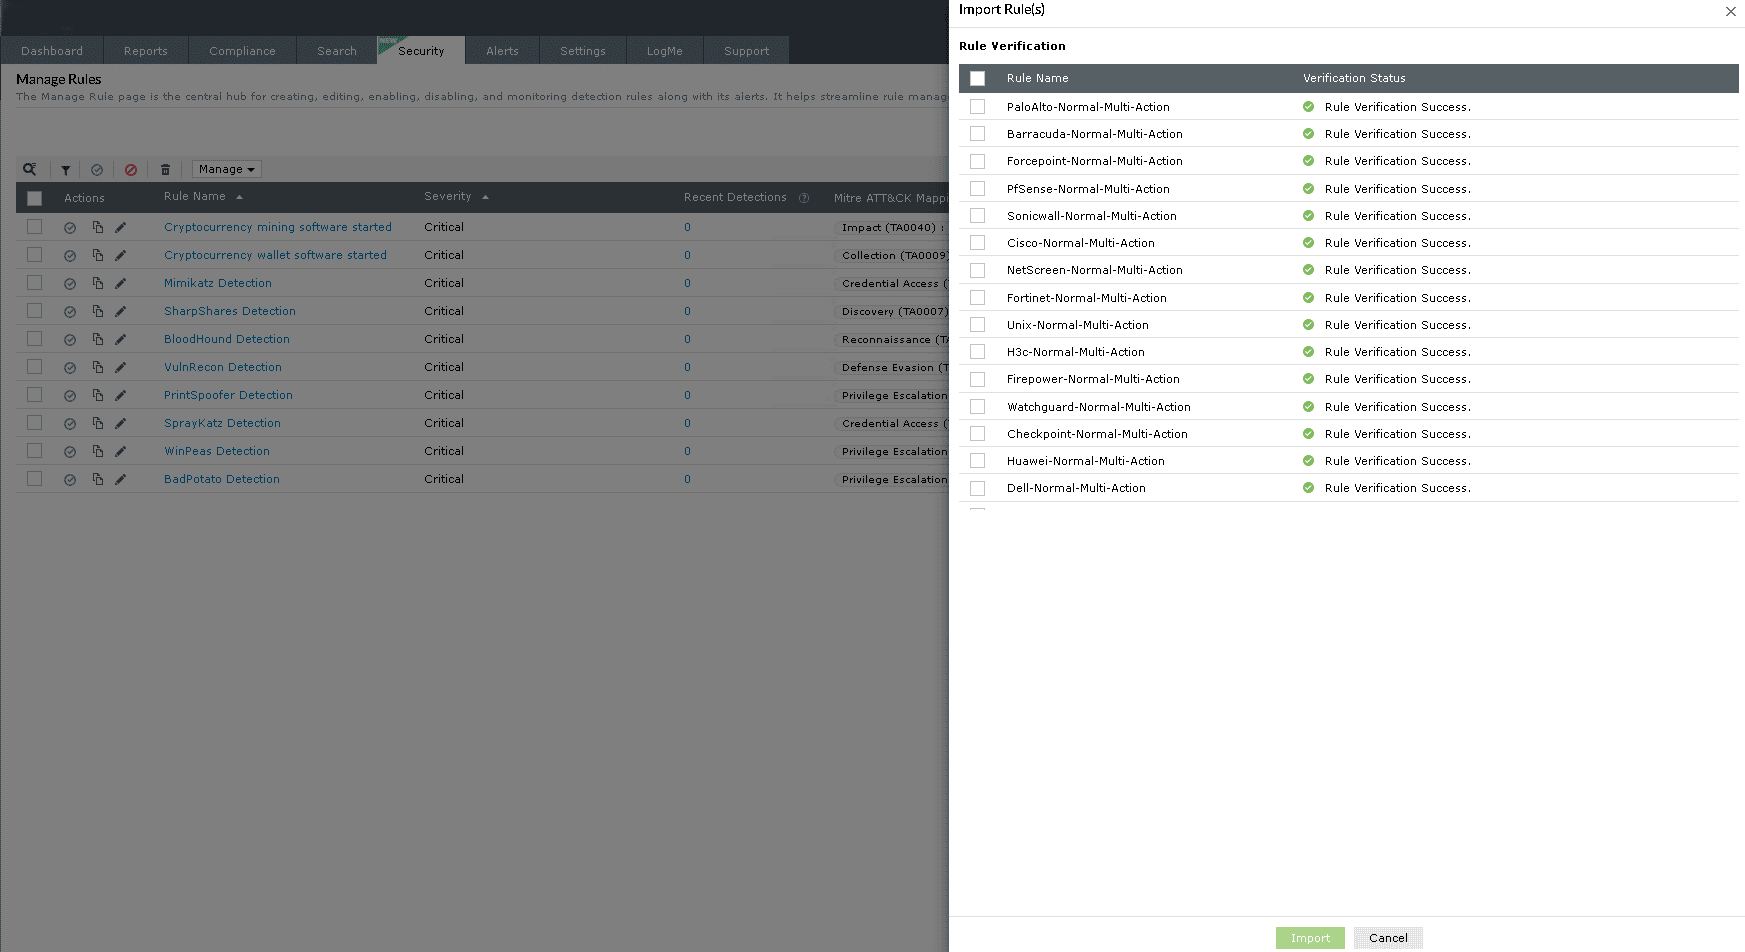
Image 9: Importing rules preview in the product When you upload a rule package, the product displays a preview of all the rules available for import. This allows you to review the rule names and associated actions before proceeding.
Rules with errors
During the preview, any rule that is found to be of any of the below categories will be marked with a Failure status. These rules will not be imported unless the underlying configuration issues are resolved:
- Was created using a log format action or custom fields that are not available in your environment, or
- Contains a duplicate action name or rule name or alert profile name
What are Sigma rules?
Sigma is a text-based format for describing security events in log data, which simplifies security threat detection.
- While choosing the file for import, choose the sigma file and click on View and Import. During the import process, you will have the option to map fields and the log type associated with the sigma rule. Click Next.
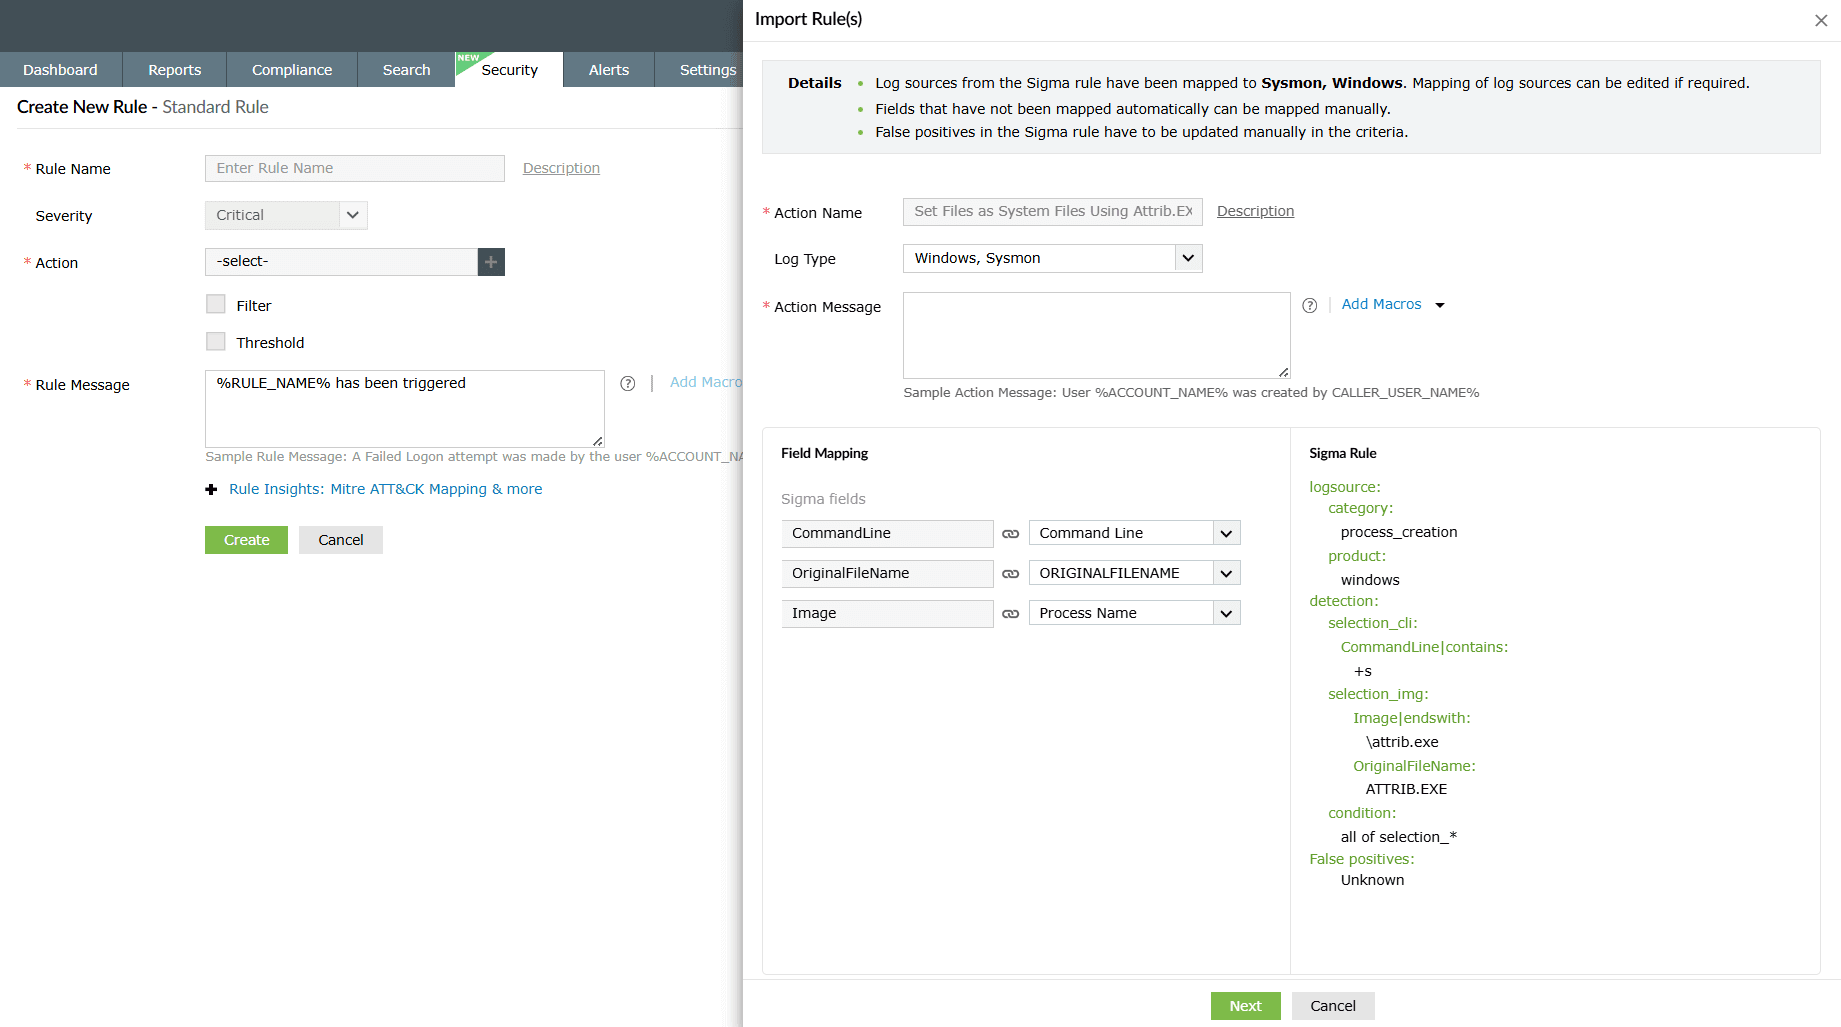
Image 10: Importing sigma rules in the product - You will be taken to the Create New Rule - Standard Rule module in order to configure further and enhance the rule. Refer to the Creating custom rules help document to learn more about rule creation.
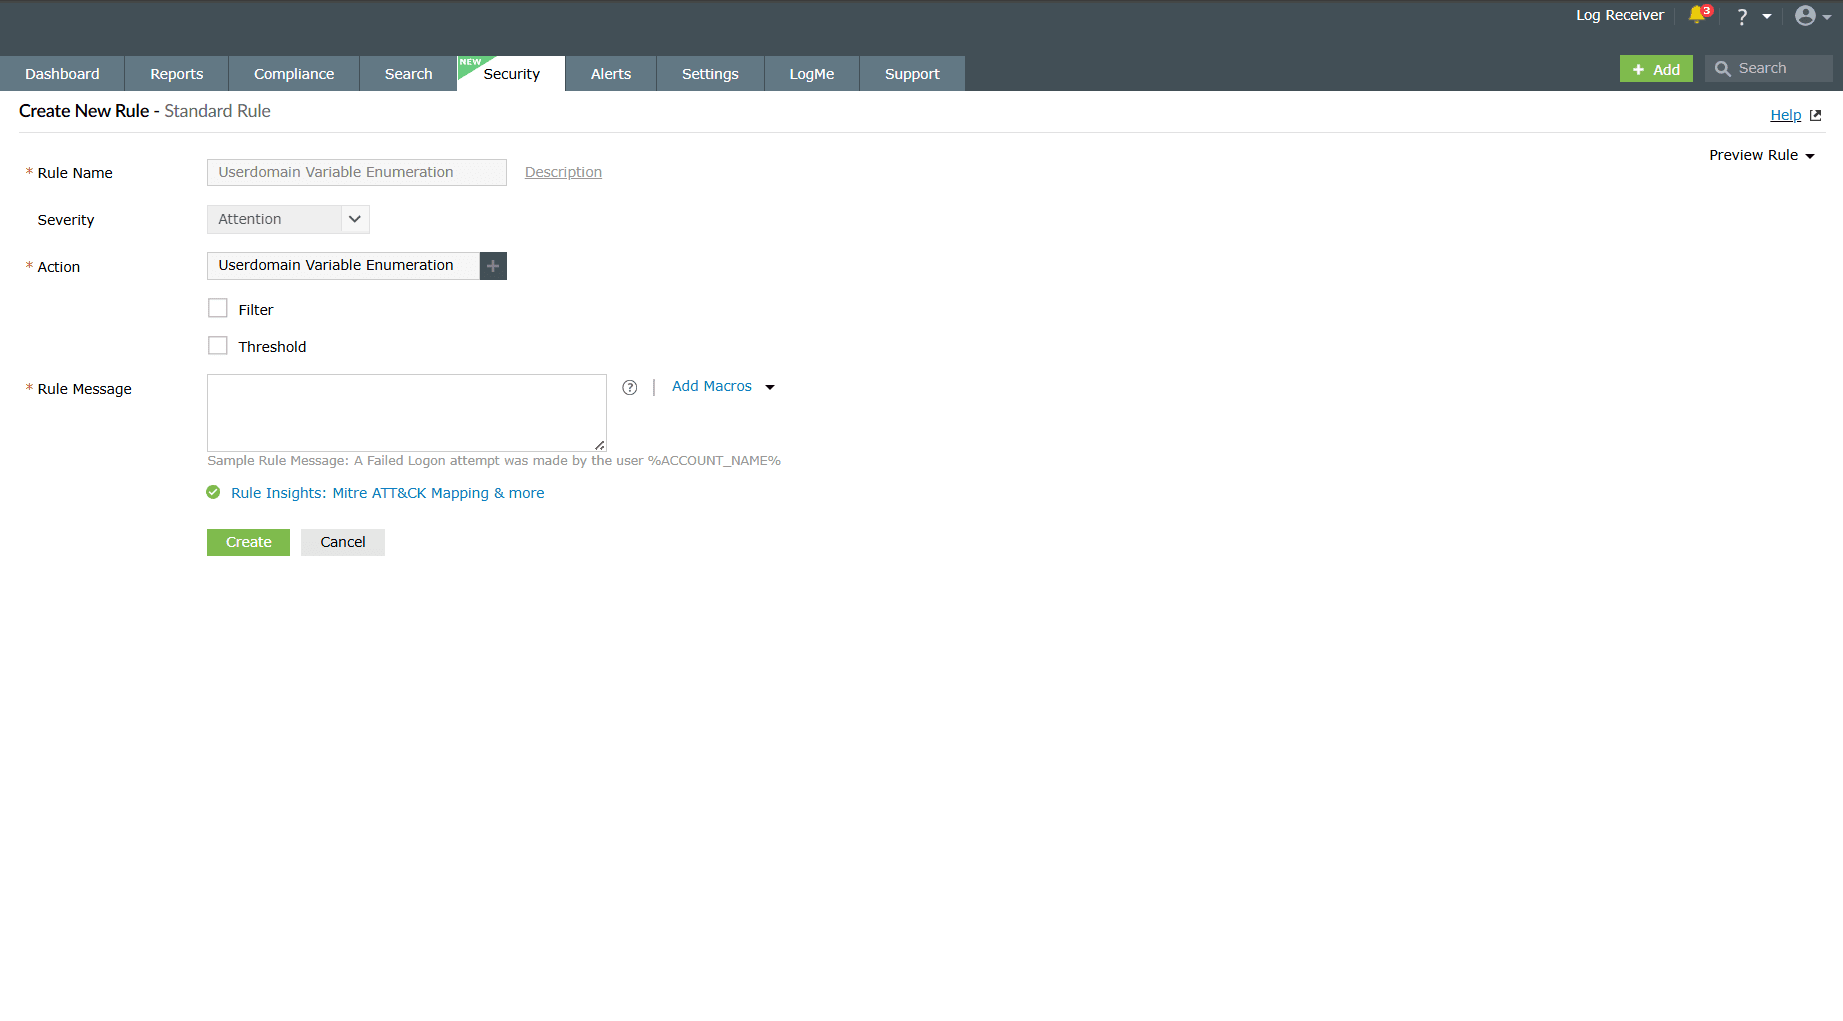
Image 11: Modifying the imported sigma rules in the product - Once the required configurations are made, click on the Create button. The product will store the imported sigma rule profile along with its defined criteria.
- Review the following points before importing:
- Sigma import location: The Sigma import option has been moved from the Alerts section to the Rule Management module.
- Detection support: Detections are supported for Sigma rules.
- Rule categorization: Imported Sigma rules will appear under the Custom category.
- Rule preview: The preview screen displays a list of rules that are about to be imported.
- Missing extensions: If a rule created with a specific log format action is imported but its corresponding extension is not installed, the rule will be displayed with a Failure status in the preview.
- Enablement behavior: Imported rules are enabled by default; however, the associated alert profiles will remain disabled- similar to rule auto-installation from extensions.
- Sigma import exception: For Sigma imports alone, the associated alert profiles will also be enabled automatically.
- Supported formats: XML, YML
- Import the desired rules by uploading a file containing the rules and then click on View and Import. The rules will be verified and then imported into the rules.
- Export:
- Instantly download the selected rules along with the configuration details. This option is applicable only for custom created rules.
- You can export custom rules from the product for backup or reuse purposes.
- Remember the following points before exporting:
- Predefined rules cannot be exported: Only custom rules created by users are eligible for export.
- Associated alert profiles are included: When a custom rule is exported, all alert profiles linked to that rule will also be exported automatically.
- Complete configuration export: Every configuration associated with the custom rule-including MITRE mapping, mitigation steps, tags, and prerequisites will be included in the export file.
- Supported file format: XML
- Enable Alert Profile(s): Click on it to Enable Alert
Profile(s)
for the selected rule(s) and the configuration is instantly updated displaying
the below pop-up.

- Disable Alert Profile(s): Click on it to Disable Alert
Profile(s) for the selected rule(s) and the configuration is
instantly updated
displaying the below pop-up.

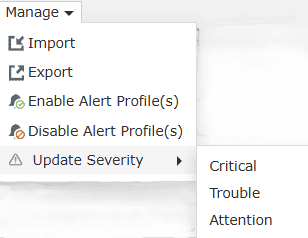
- Update Severity: Click/Hover on it to view the three severity
levels and choose the one you wish to apply.
- Import:
The configuration is instantly
updated displaying the below pop-up.

B. Rule Name column
The Rule Name column lists the names of all the configured rules till date.
Clicking on any rule name prompts the Rule Summary box to slide open. It includes 4 sub-tabs:
- Rule Details
- Prerequisites
- Mitigation
- Execution Details
Rule Details
Provides a summary of the rule along with the respective details and options to add exceptions for that particular rule.
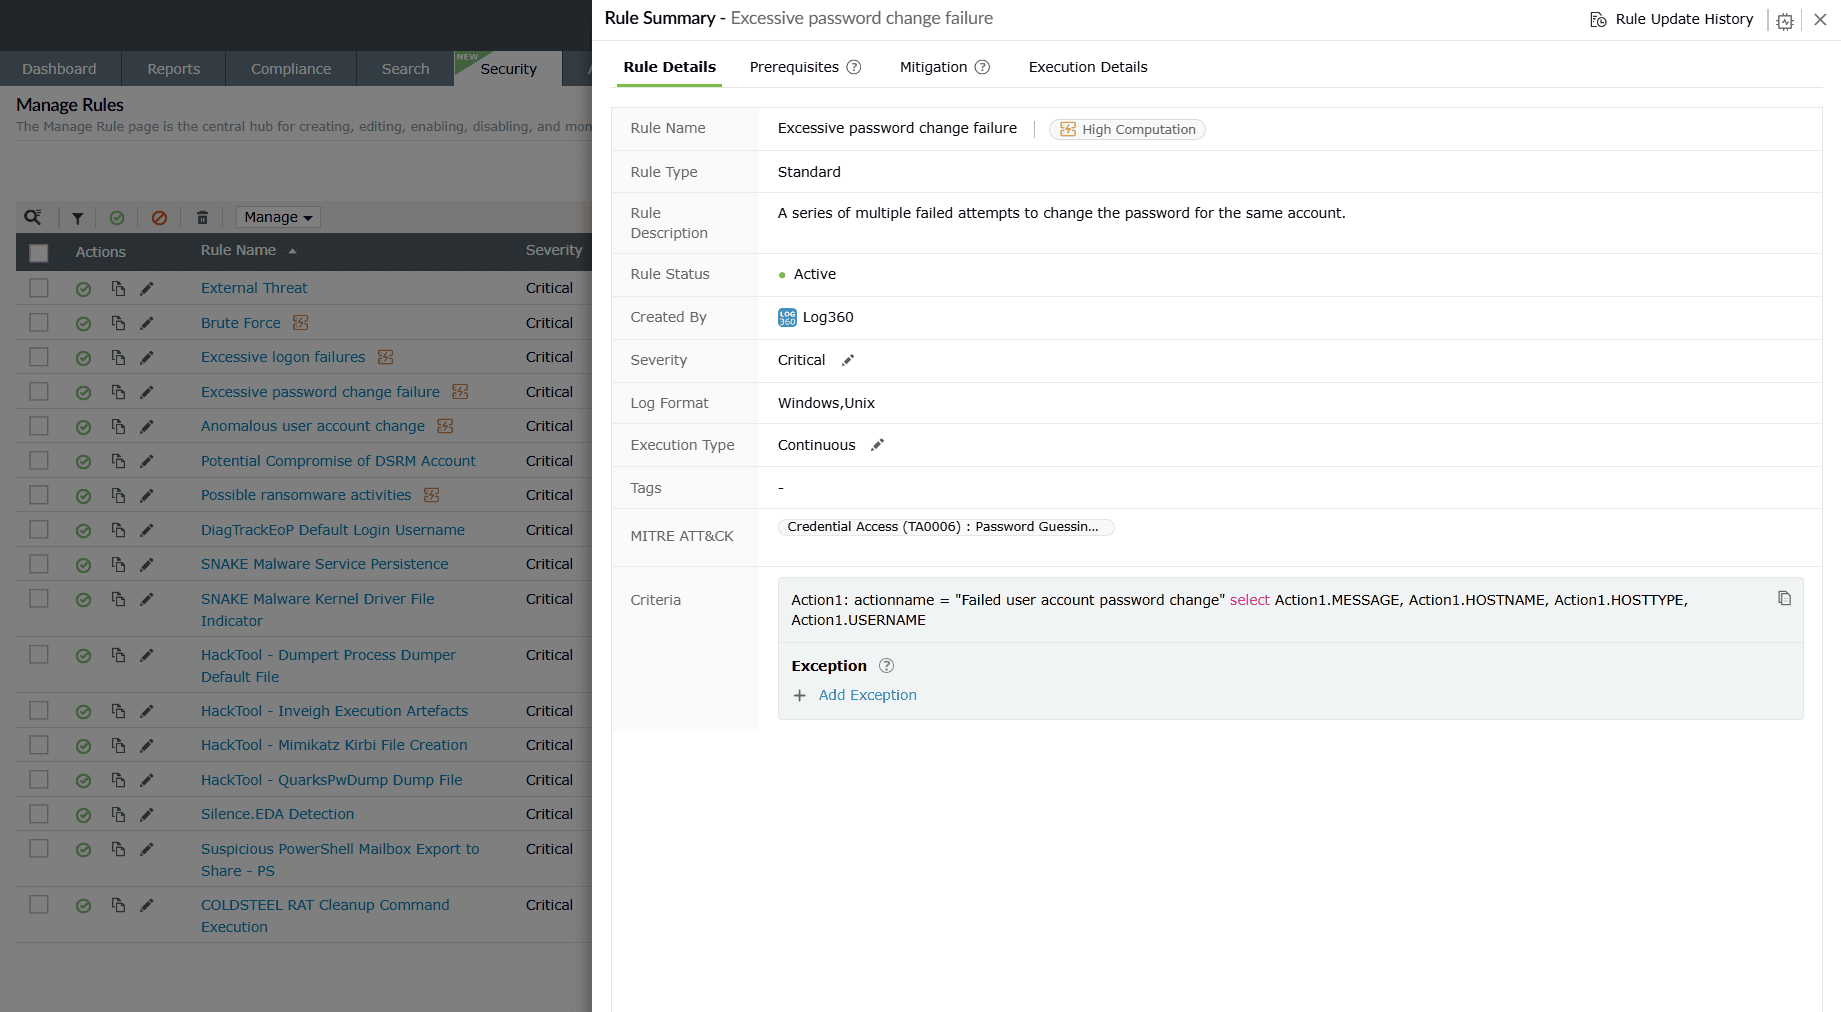
- Rule Name: Displays the unique rule name assigned by you for this rule.
- Rule Type: Displays which category of rules this rule comes under - Standard, Anomaly, or Advanced.
- Rule Description: Displays whatever description you have added for this rule, if any.
- Rule Status: Displays whether the rule is currently in an Active state or Inactive.
- Created By: Displays the user (identified by their role in this network) who has created this rule.
- Severity: Displays the Severity level set during the rule configuration - Critical, Trouble, or Attention.
- Log Format: Shows the log type associated with the rule.
- Execution Type: Displays the Execution Configuration mode set for this rule - Continuous; Schedule every 5 minutes, 10 minutes, 30 minutes, 1 hour; and Custom. In the case where anomaly rules are involved in the rule configuration, the execution mode is Intelligent mode, where it takes a few hours for the detection engine to generate the anomaly logs.
- Tags: Categorizes the rule based on industry or type.
- MITRE ATT&CK: Maps the rule to relevant MITRE tactics and techniques.
- Criteria: Displays the rule conditions in query format.
- Exception: The Exception defines the criteria
for
the
detection engine to rule out cases from the detections and reports. A detection
will
not
be created if the set conditions from the rule exception match.
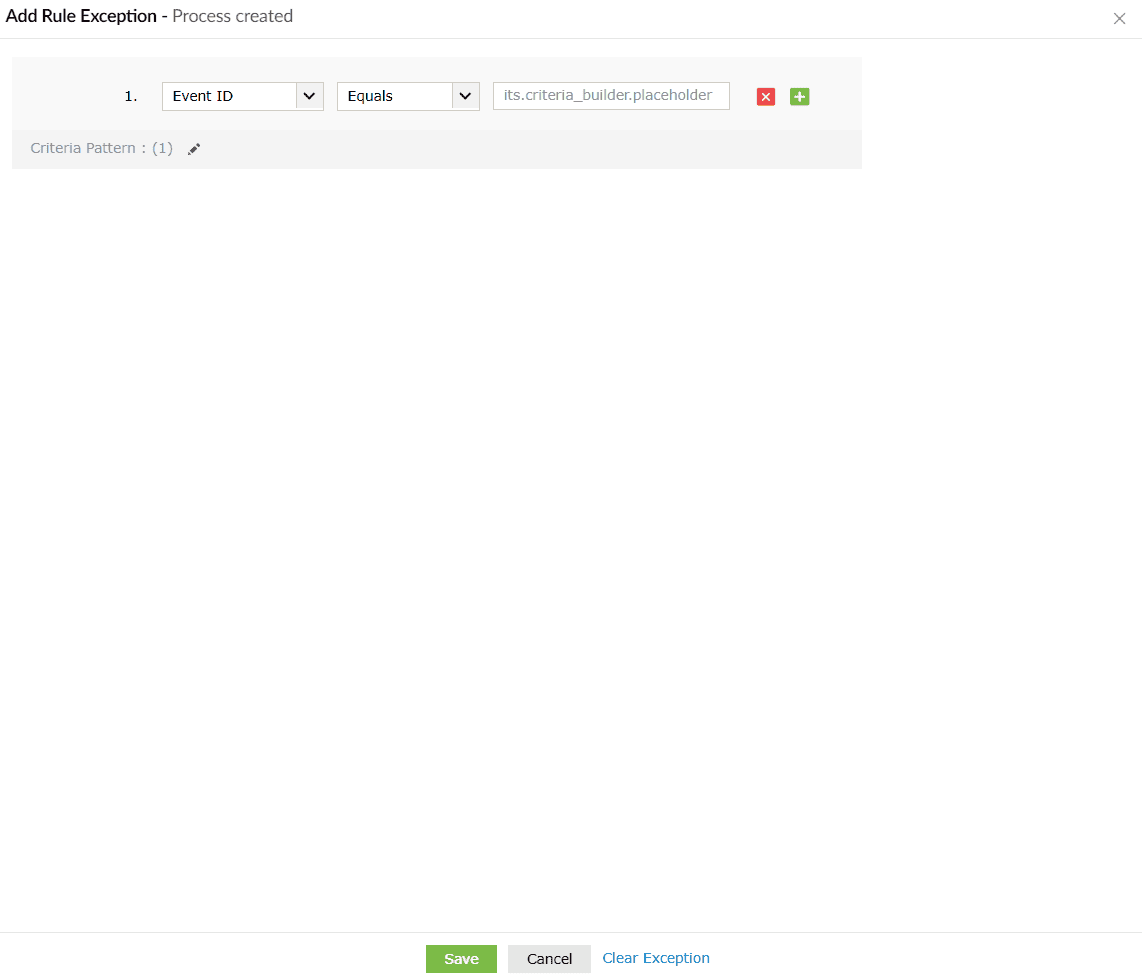
- When you click on the Add Exception button, the Add Rule Exception box slides open.
- You can configure the exceptions you wish to rule out from detections and reports.
- Click on the Save button to save the rule exception.
- Upon successful completion of the action, the below pop-up appears.
- If you wish to reset and reconfigure that exception you can click on Clear Exception, and the configurations are reset.
- Click on Cancel if you wish to abort the process.

- Exception: The Exception defines the criteria
for
the
detection engine to rule out cases from the detections and reports. A detection
will
not
be created if the set conditions from the rule exception match.
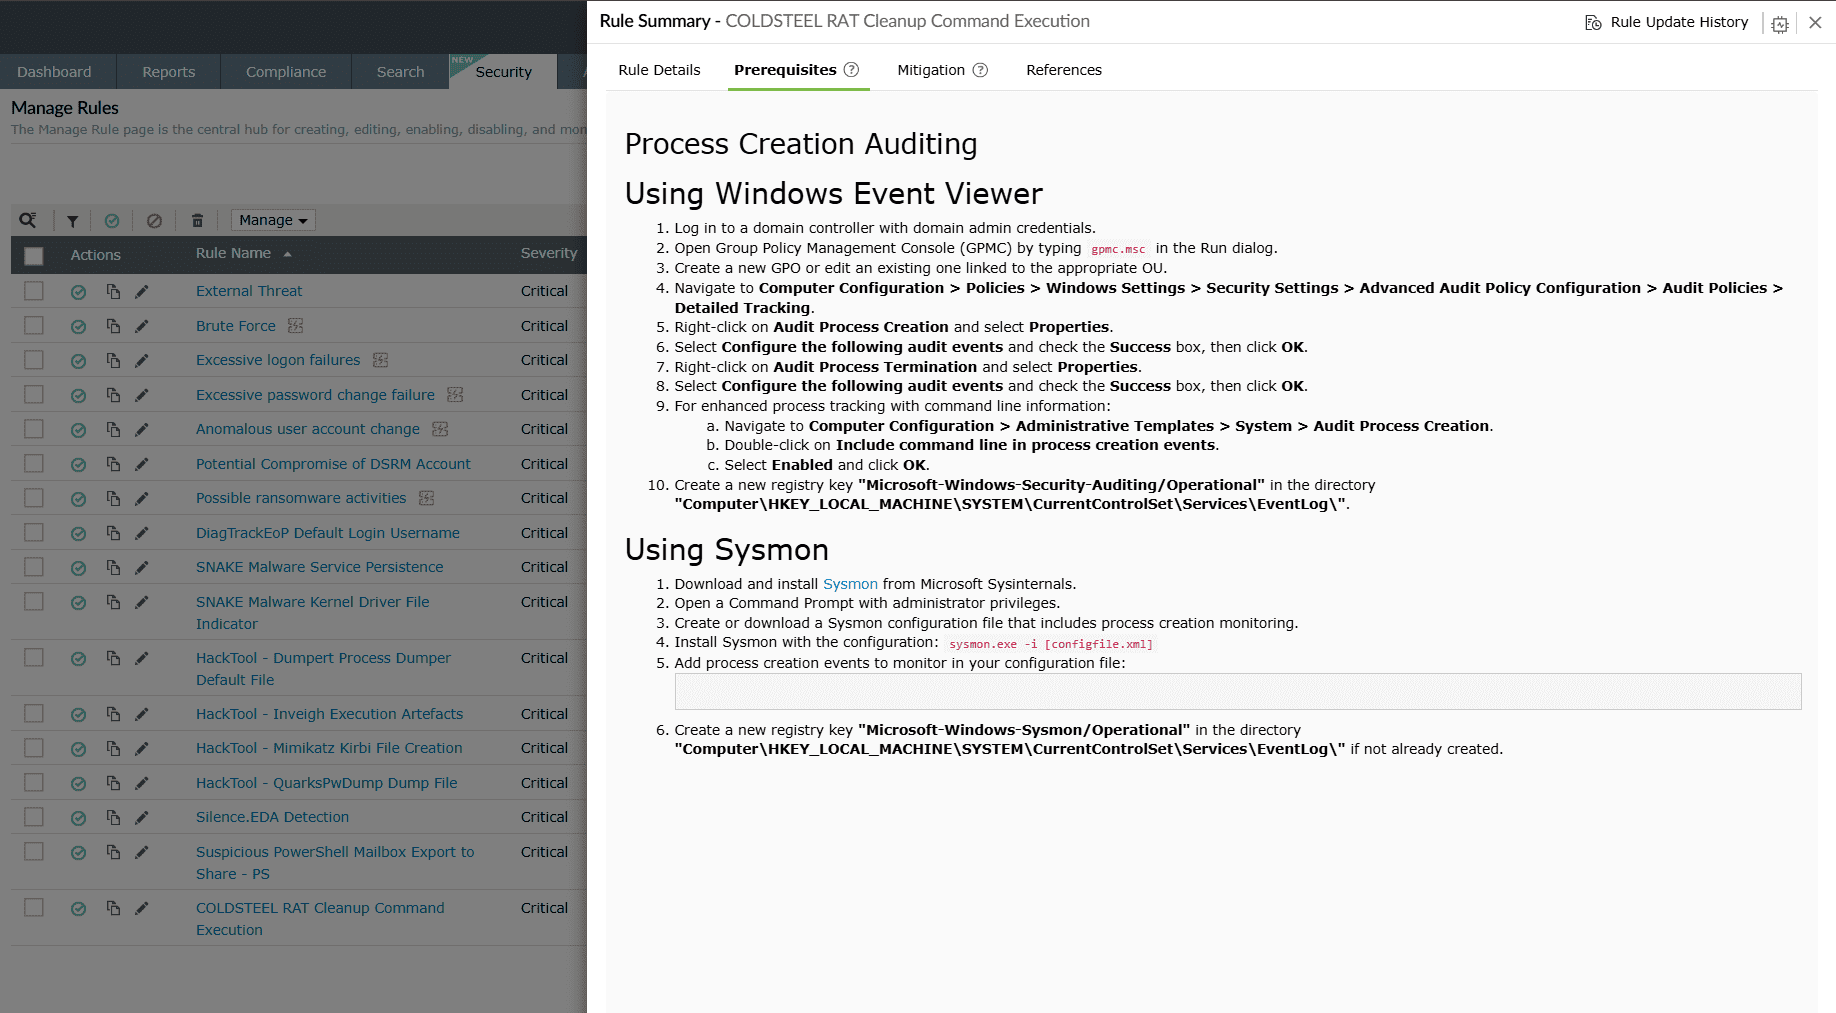
Prerequisites
This sub-tab provides an interface for you to check and ensure that the required dependencies of the rule are met for proper detection.
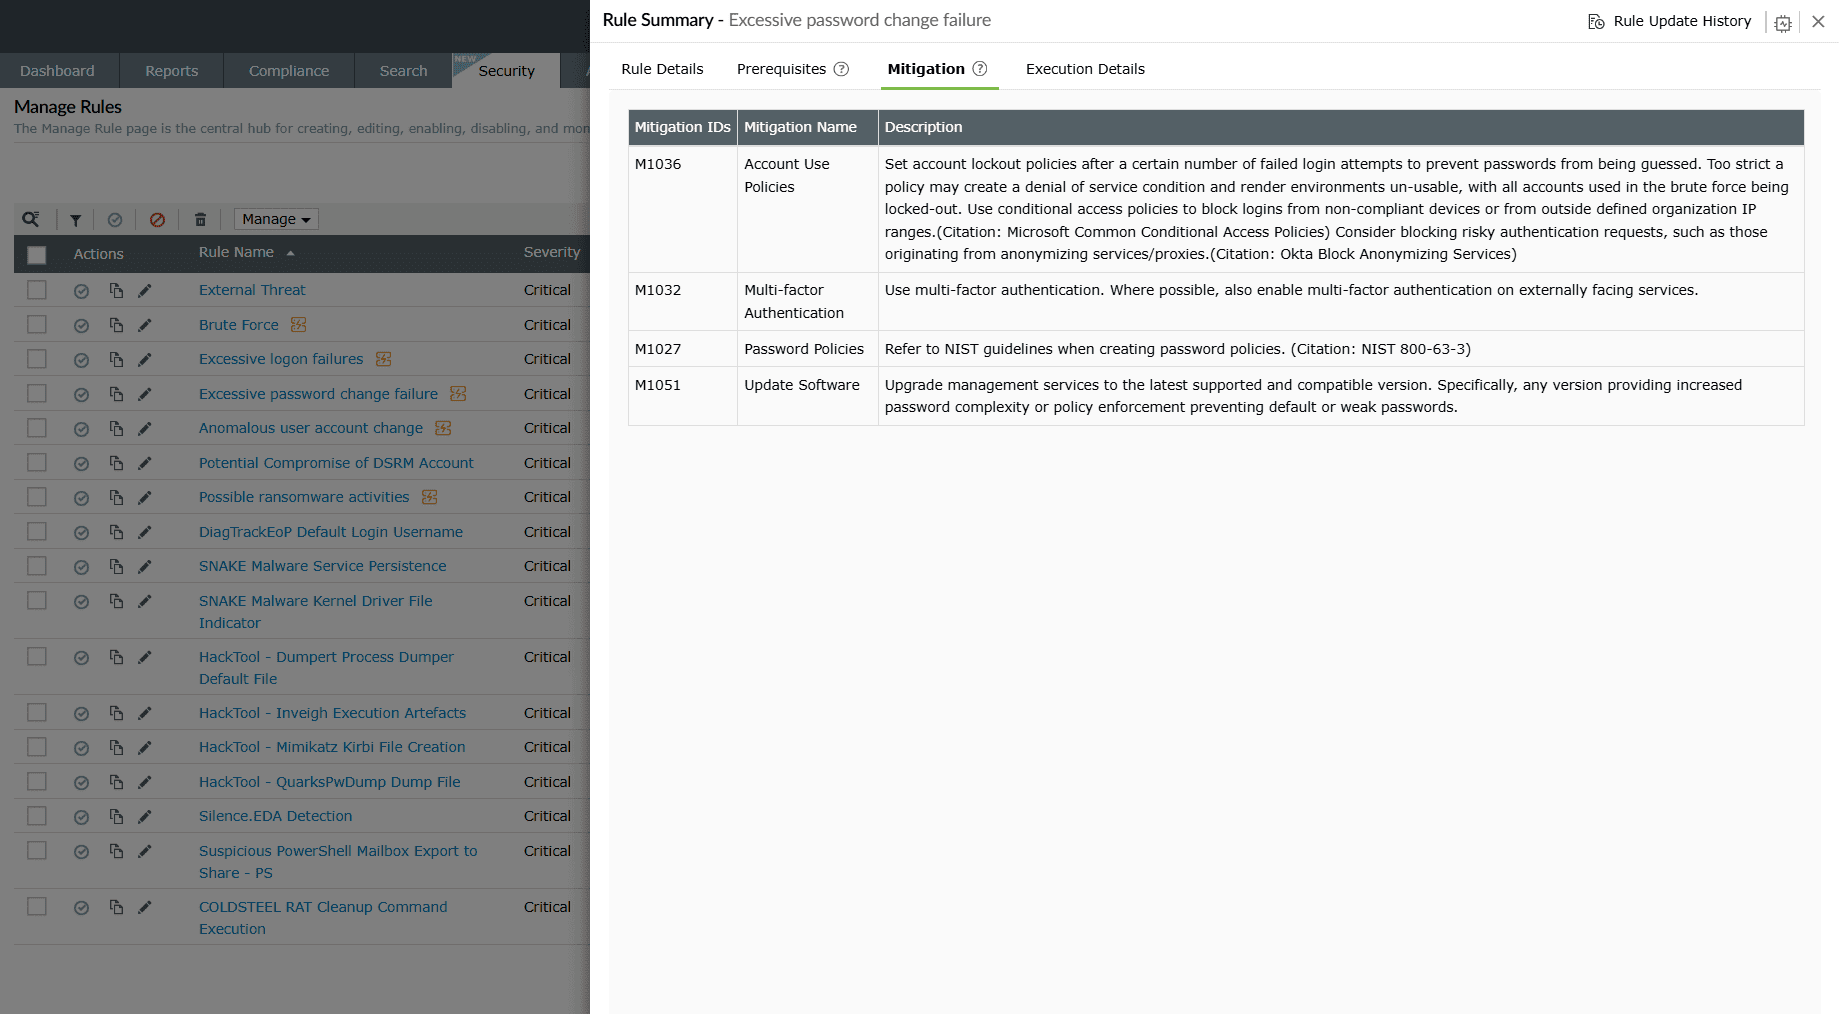
Mitigation
This sub-tab provides an interface for you to take recommended actions to minimize risks and prevent future threats. Mitigations are pre-added for predefined rules, whereas for custom rules they must be manually added by the user.
Case 1: Mitigation steps existing in the rule configuration.
- Mitigation IDs: Lists the MITRE ATT&CK mitigation techniques associated with the detected rule or threat.
- Description: Provides actionable guidance on how to mitigate or reduce the impact of the threat, such as configuration changes, security policies, or best practices.
- False positives: Indicates the likelihood of false positives for the specific detection.
Case 2: No existing mitigation steps.
In such cases, it is implied that no mitigation is necessary for that particular rule.
Execution Details
Used to identify high-computation continuous rules in terms of memory usage. It also shows which of the currently collected logs fall under this rule’s actions.
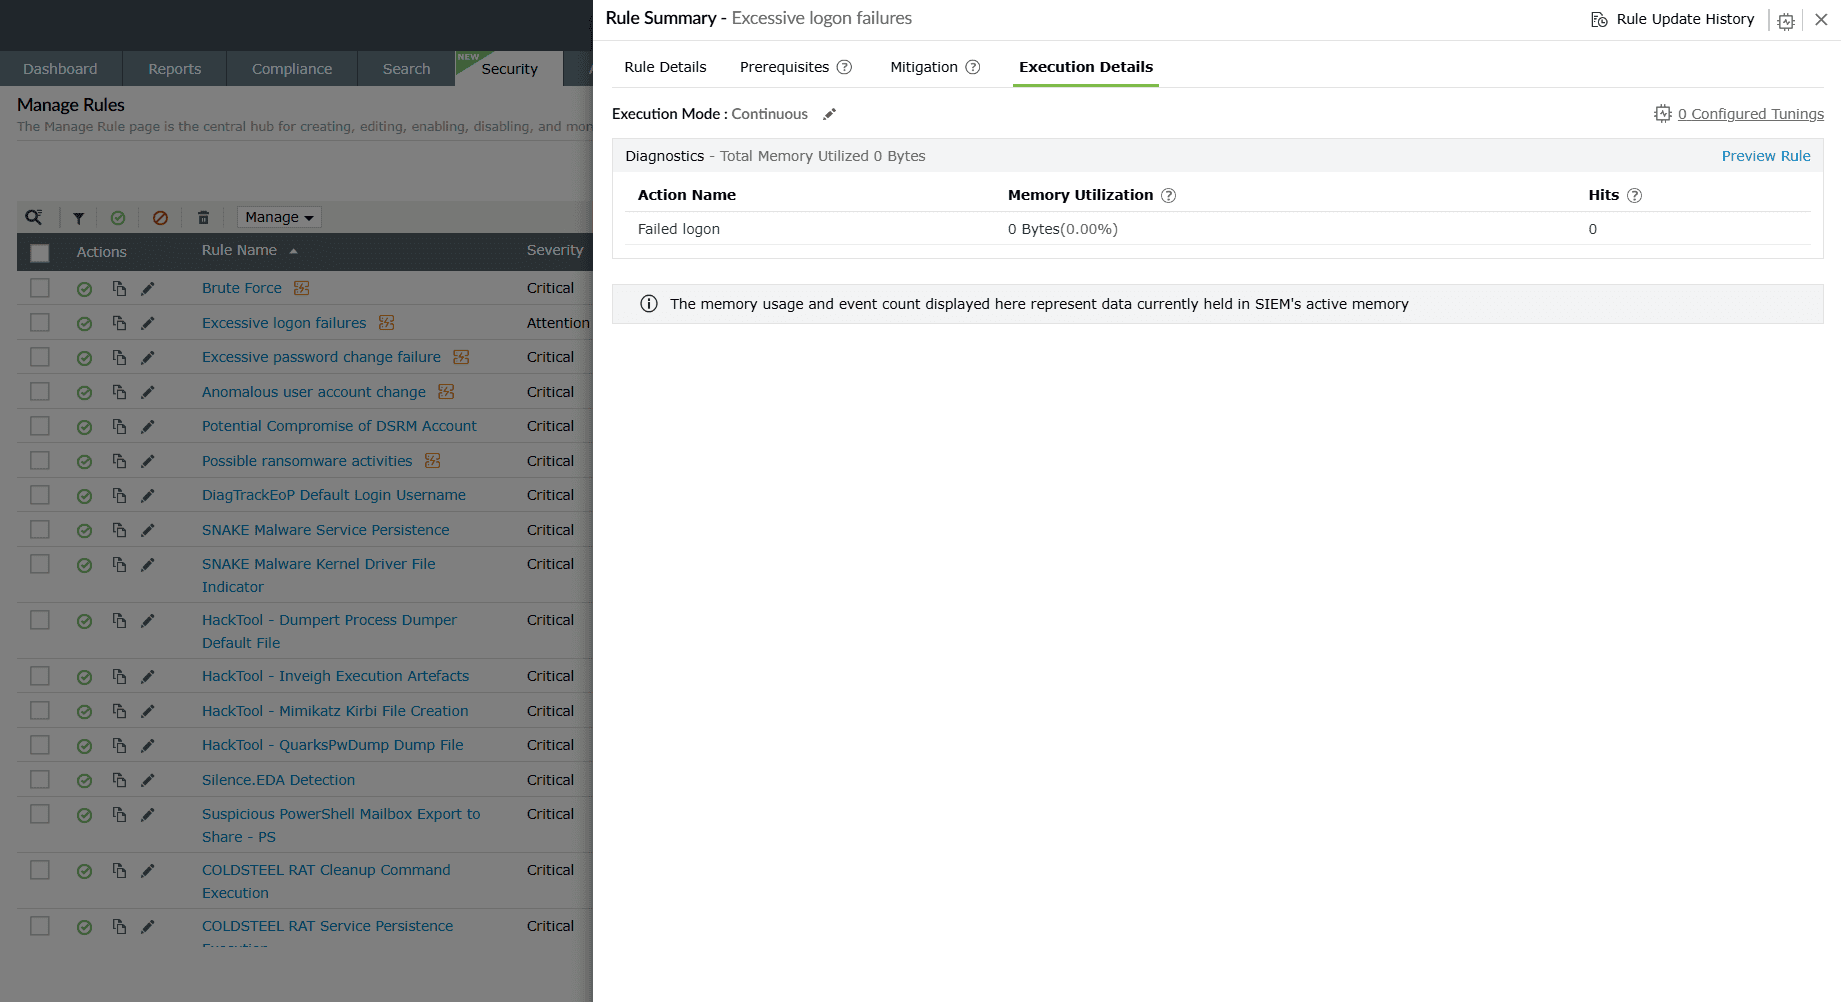
Execution Mode:
- Execution Mode: Displays the Execution Configuration mode set for this rule—Continuous; Schedule every 5 minutes, 10 minutes, 30 minutes, 1 hour; and Custom.
-
Diagnostics: Provides insights into the resource usage and activity
generated by the rule. This helps you verify how the rule performs during execution.
- Action Name: Displays the event/action associated with this particular detection. For example, Successful logon.
- Memory Utilization: Track total memory used during action execution in near real time.
- Hits: Track the total number of hits for the action in near real time.
- Execution History: Displays a timeline of the rule’s past executions, including event counts and memory consumption recorded during each run. This helps you review the rule’s performance over time and troubleshoot any anomalies.
- Refer to the understanding rules page to learn more about the differences in the execution mode for continuous and scheduled modes.
Rule tuning
The Rule Tuning option in helps administrators refine detection rules by optimizing query execution. It analyzes the way rules are processed and provides actionable insights to improve performance. Below are the enhancements rule tuning can help administrators with:
- Enhances rule performance by reducing unnecessary execution overhead.
- Prevents timeouts and delays during query runs.
- Helps scale detection efficiency as log volume grows.
- Click the icon in the top-right corner of the Rule Summary box to view the rule tuning configurations box.
- The Rule Tuning panel opens, displaying:
- Rule conditions and actions.
- Tuning insights and recommendations.
- A preview of rule execution with graphical output.
Available actions:
-
Rule preview
- Generates a sample output graph showing query execution trends.
- Displays execution time and data results (e.g., usernames, devices).
- Helps validate whether tuning improves efficiency without losing accuracy.
-
Handling query timeouts
- If a scheduled task fails due to query timeout, you can:
- Adjust the query timeout value.
- Apply recommended tunings.
- If a scheduled task fails due to query timeout, you can:
Example use case: Brute Force detection
Consider the Brute Force rule, which detects failed and successful Windows logins within a specific timeframe.
- Without tuning, this rule may return large datasets causing execution delays.
- With tuning, you can:
- Add grouping by username/device.
- Limit the number of results analyzed.
- Exclude repeated usernames or devices to reduce execution load.
Result: Faster query response, reduced noise, and more efficient detection of brute-force attempts.
Rule tuning best practices
- Always preview the rule before applying tunings.
- Use manual exceptions for repetitive patterns instead of disabling rules.
- Periodically revisit tuning recommendations as log volume and attack patterns evolve.
C. Severity
Displays the severity level set for the rules- Critical, Trouble or Attention.
D. Mitre Att&ck Mapping
Tactic and technique classification aligned with the MITRE ATT&CK framework that are associated with the rules.
E. Tags
Additional contextual tags, such as threat actor, software, industry verticals that are associated with the rules.
F. Execution Mode & Status
Displays the Execution Configuration mode set for each rule.
G. Alert Profiles
- Provides the option to create an alert profile for all the rules listed here.
- When you click on the Create Alert Profile option, an alert profile for
the corresponding rule is created instantly and the below pop-up appears.

- When you click on the Click Here option provided in the pop-up as shown above, you will be taken to the Edit Alert Profile module. Read the Alert Profile help page to learn more about editing and assigning alert profiles.
H. Created By
Displays the user (identified by their role in this network) who has created this rule.
I. Rule Type
Displays the rule category- Standard, Anomaly, or Advanced.
J. Installed Time
Displays the time of rule installation from the Rule Library.
K. Last Modified Time
Displays the time of the most recent modification done to the rule.
L. Detections
Click on the View Detections link to view all the detections that were triggered by that particular rule. A periodic graph of the detections will be shown to you for that particular rule as given below.
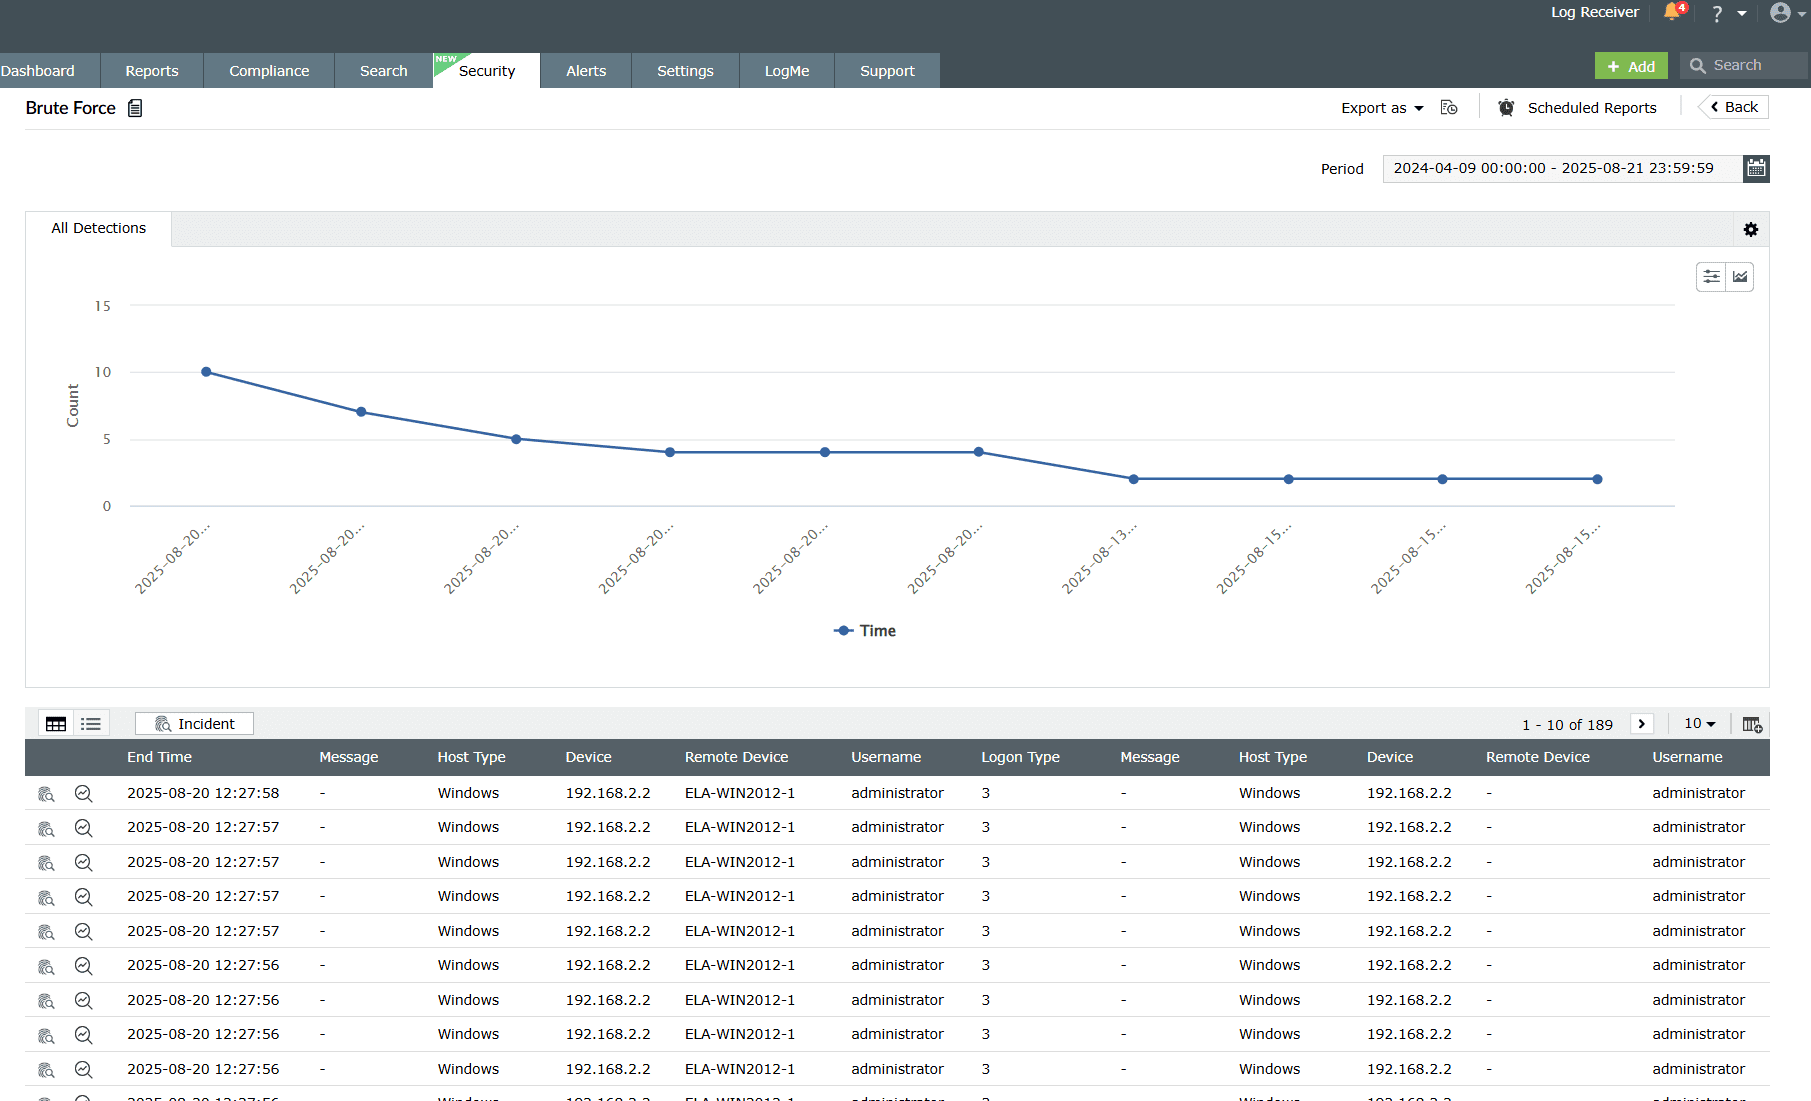
The details displayed in the detection are as follows:
- Customize views:
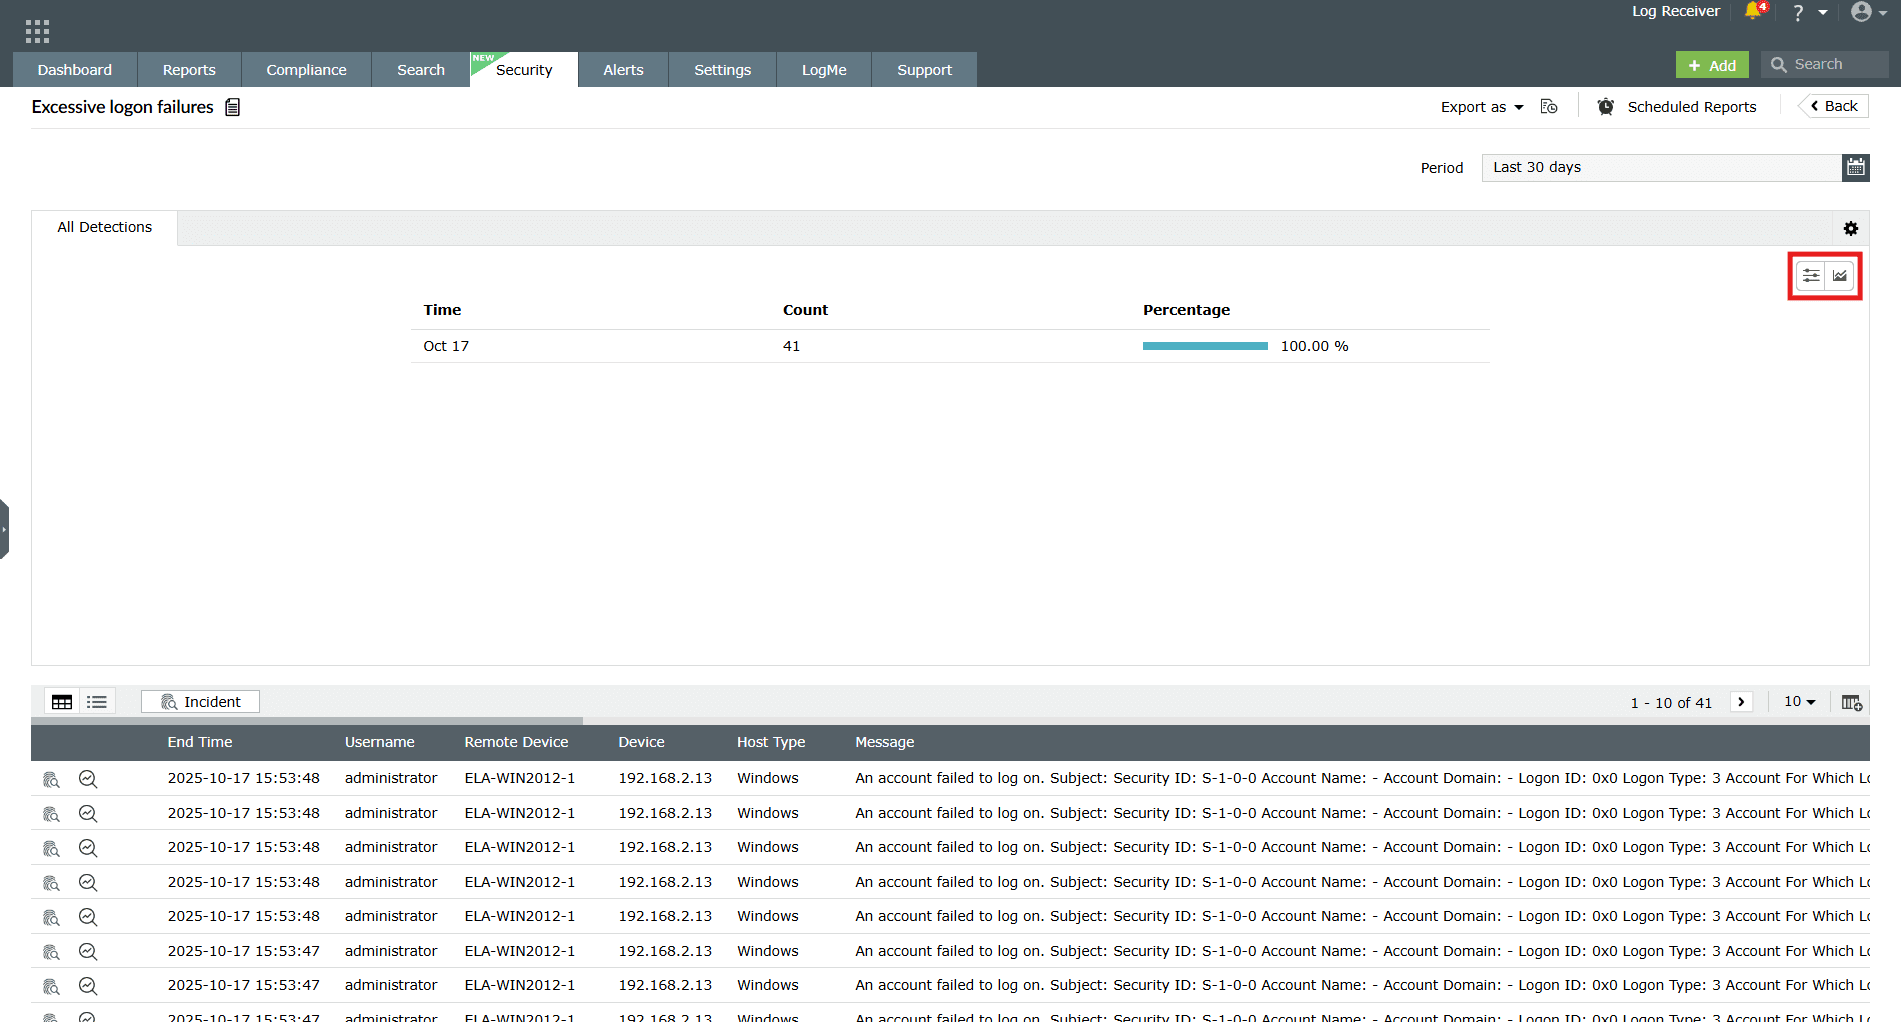
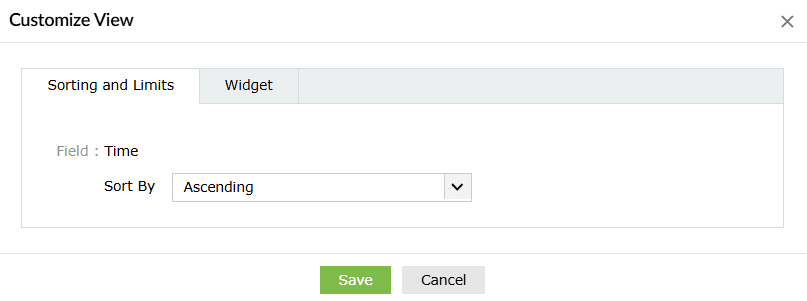
Image 18: Customize detection report - Customize sorting and limit:
- Customize the sorting and limit from the options of Most occurred, Least occurred, Ascending, or Descending and click on the Save button.
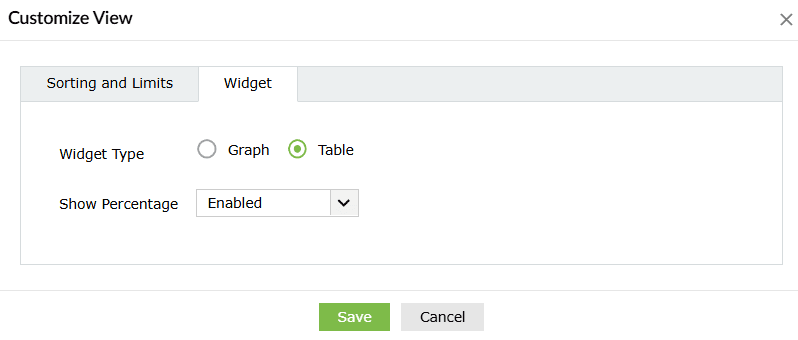
- Customize widget:
- Customize the widget view from the options of Graph, or Table view and click on the Save button. You may also choose to either enable or disable the percentages in the report.
- Detection graph:
- A visual depiction showing the event count over time that triggered the respective rule for quick anomaly spotting. Upon clicking the drop-down arrow available beside the graph, you will be shown the different types of graphs to choose from.
- Event Log Table: Displays details of each detected event that triggered
the rule such as End Time, Event IDs, Log Source, Time, User Name, Domain, Message, etc.
Clicking on the icon on the top-right corner of the data table allows you to
select/deselect and Add what fields you wish to view
separated by columns. You can choose fields from the many options provided.
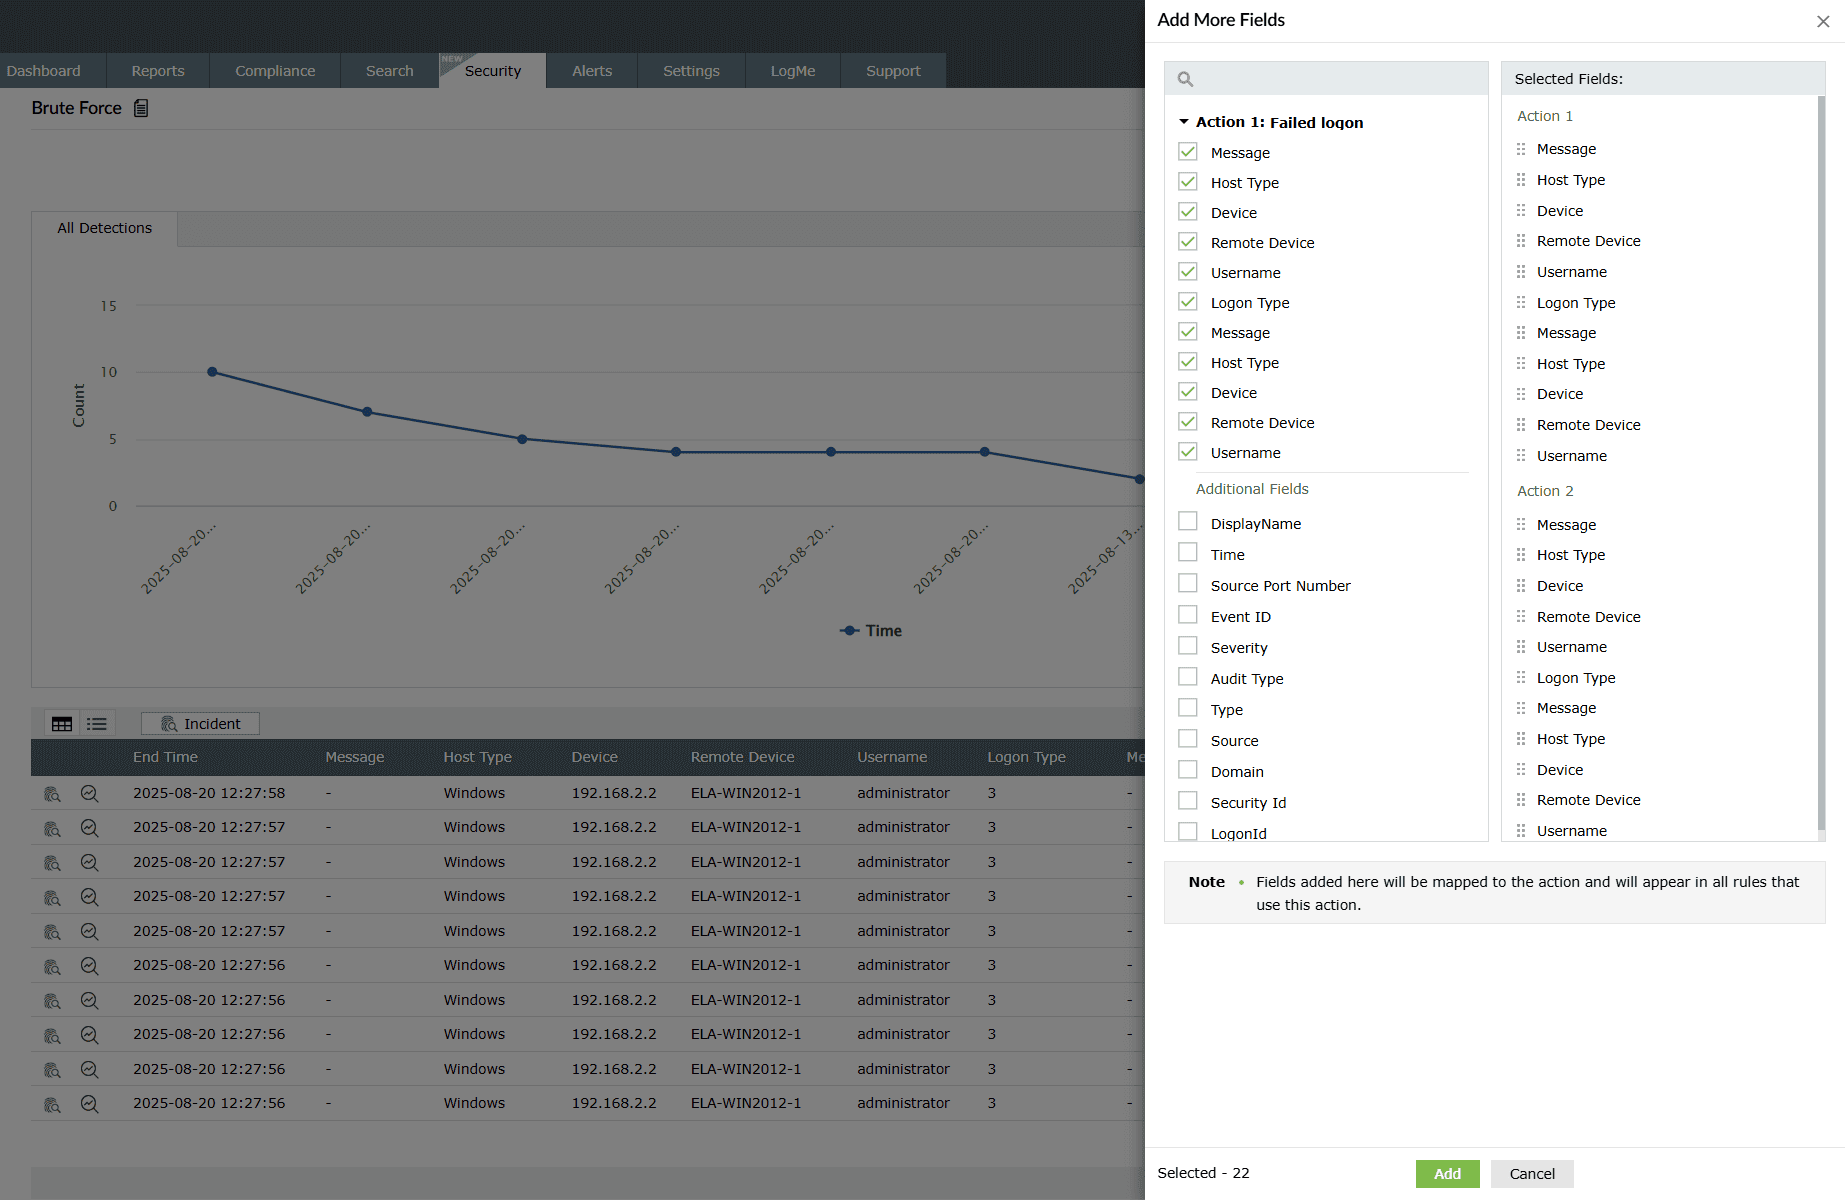
Image 19: Rule detection details columns in the manage rules module
Available actions in the detections module:
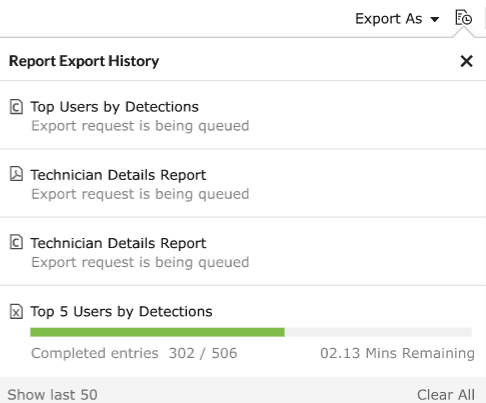
- Clicking on the button allows you to choose a format to export the said data either in a PDF format or a CSV file.
- Clicking on the Report export history icon
 allows you to view the
complete history of the past data exports that have taken place for that particular
report.
allows you to view the
complete history of the past data exports that have taken place for that particular
report.
- You can also customize the time range for the detection by clicking on
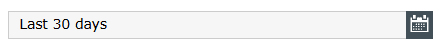
You can:
- Select the start date and end date for your desired time range.
- Click on any of the predefined time ranges available that suits your requirements.
- Click on Custom range and then proceed to enter a number in the box provided below that will represent the past number of days worth of data you wish to view.
- Click on Apply.
Below are the steps to access the detections and details of detections made based on each rule category:
Steps to access the detection details
- Navigate to the Manage Rules module and click on the number listed under the Recent Detections column for a rule you wish to check.
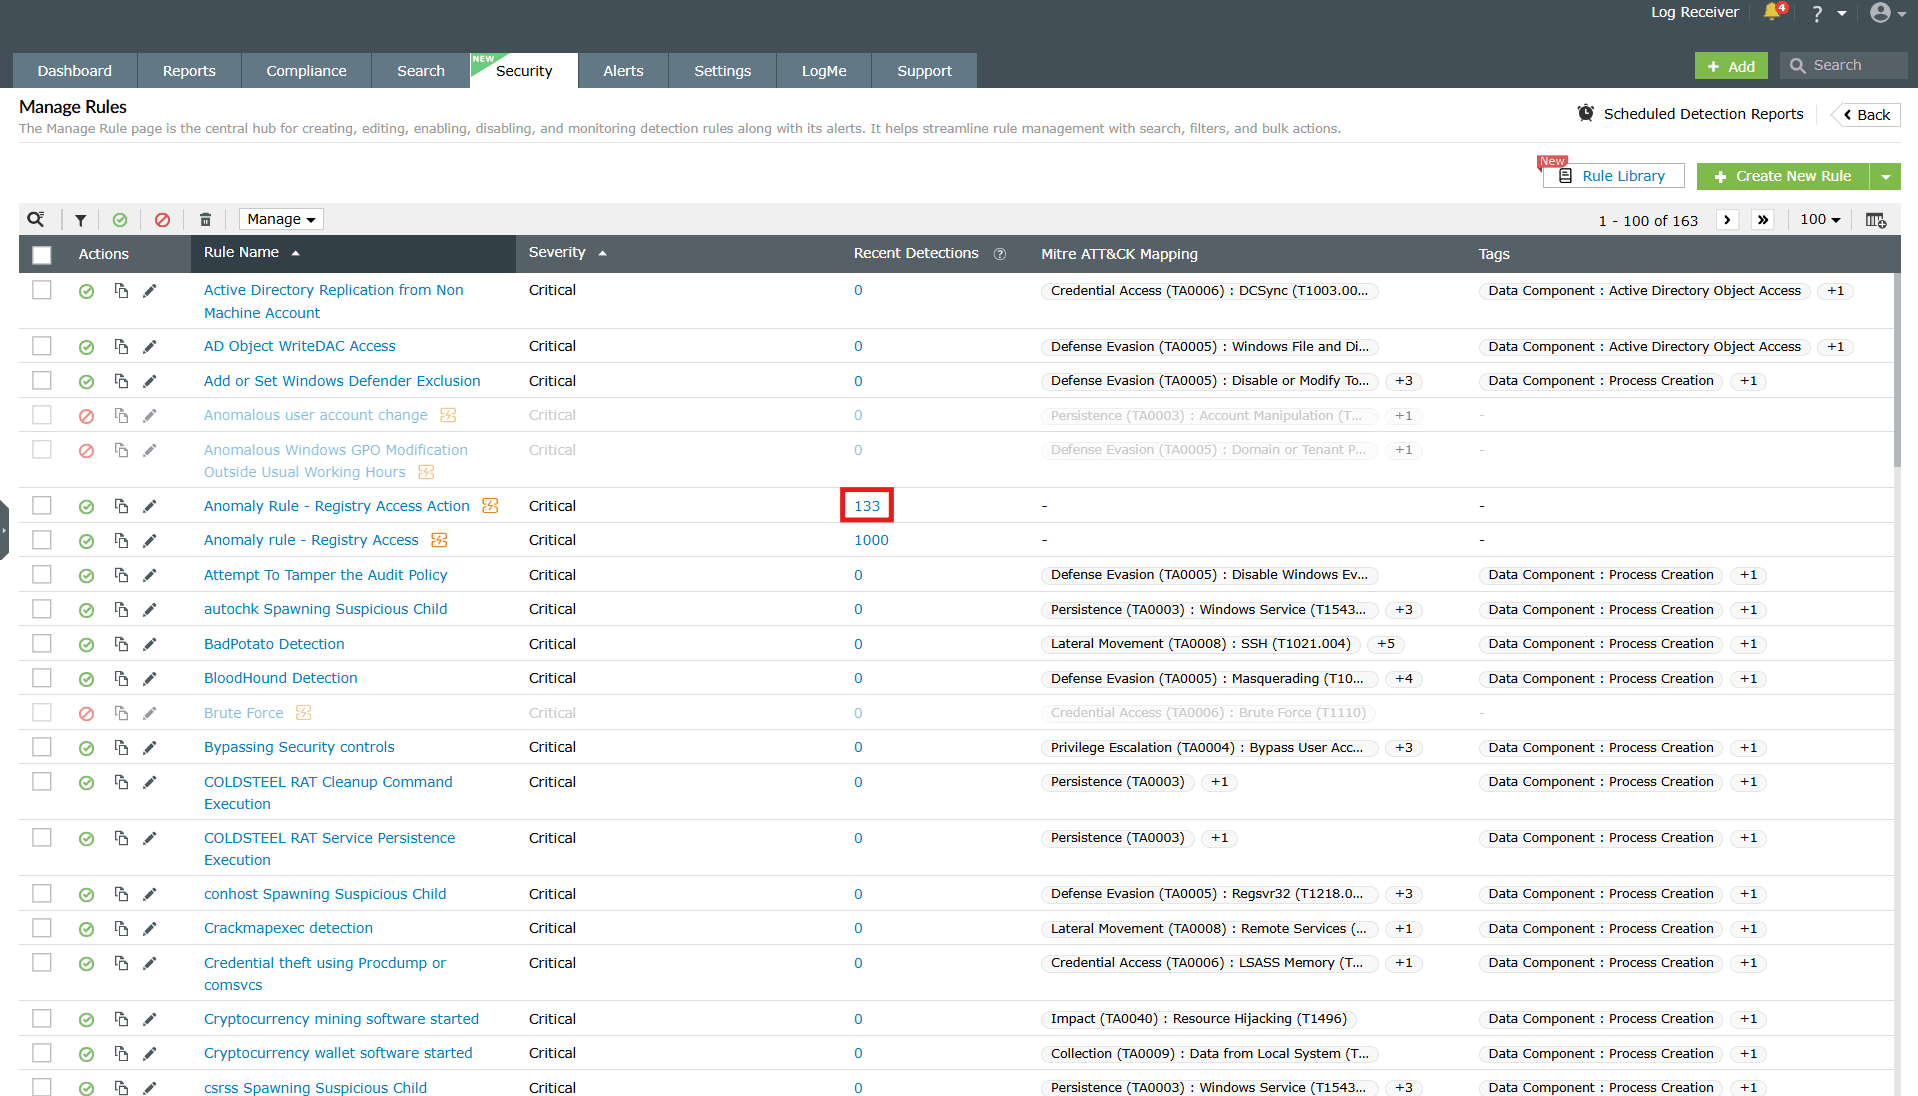
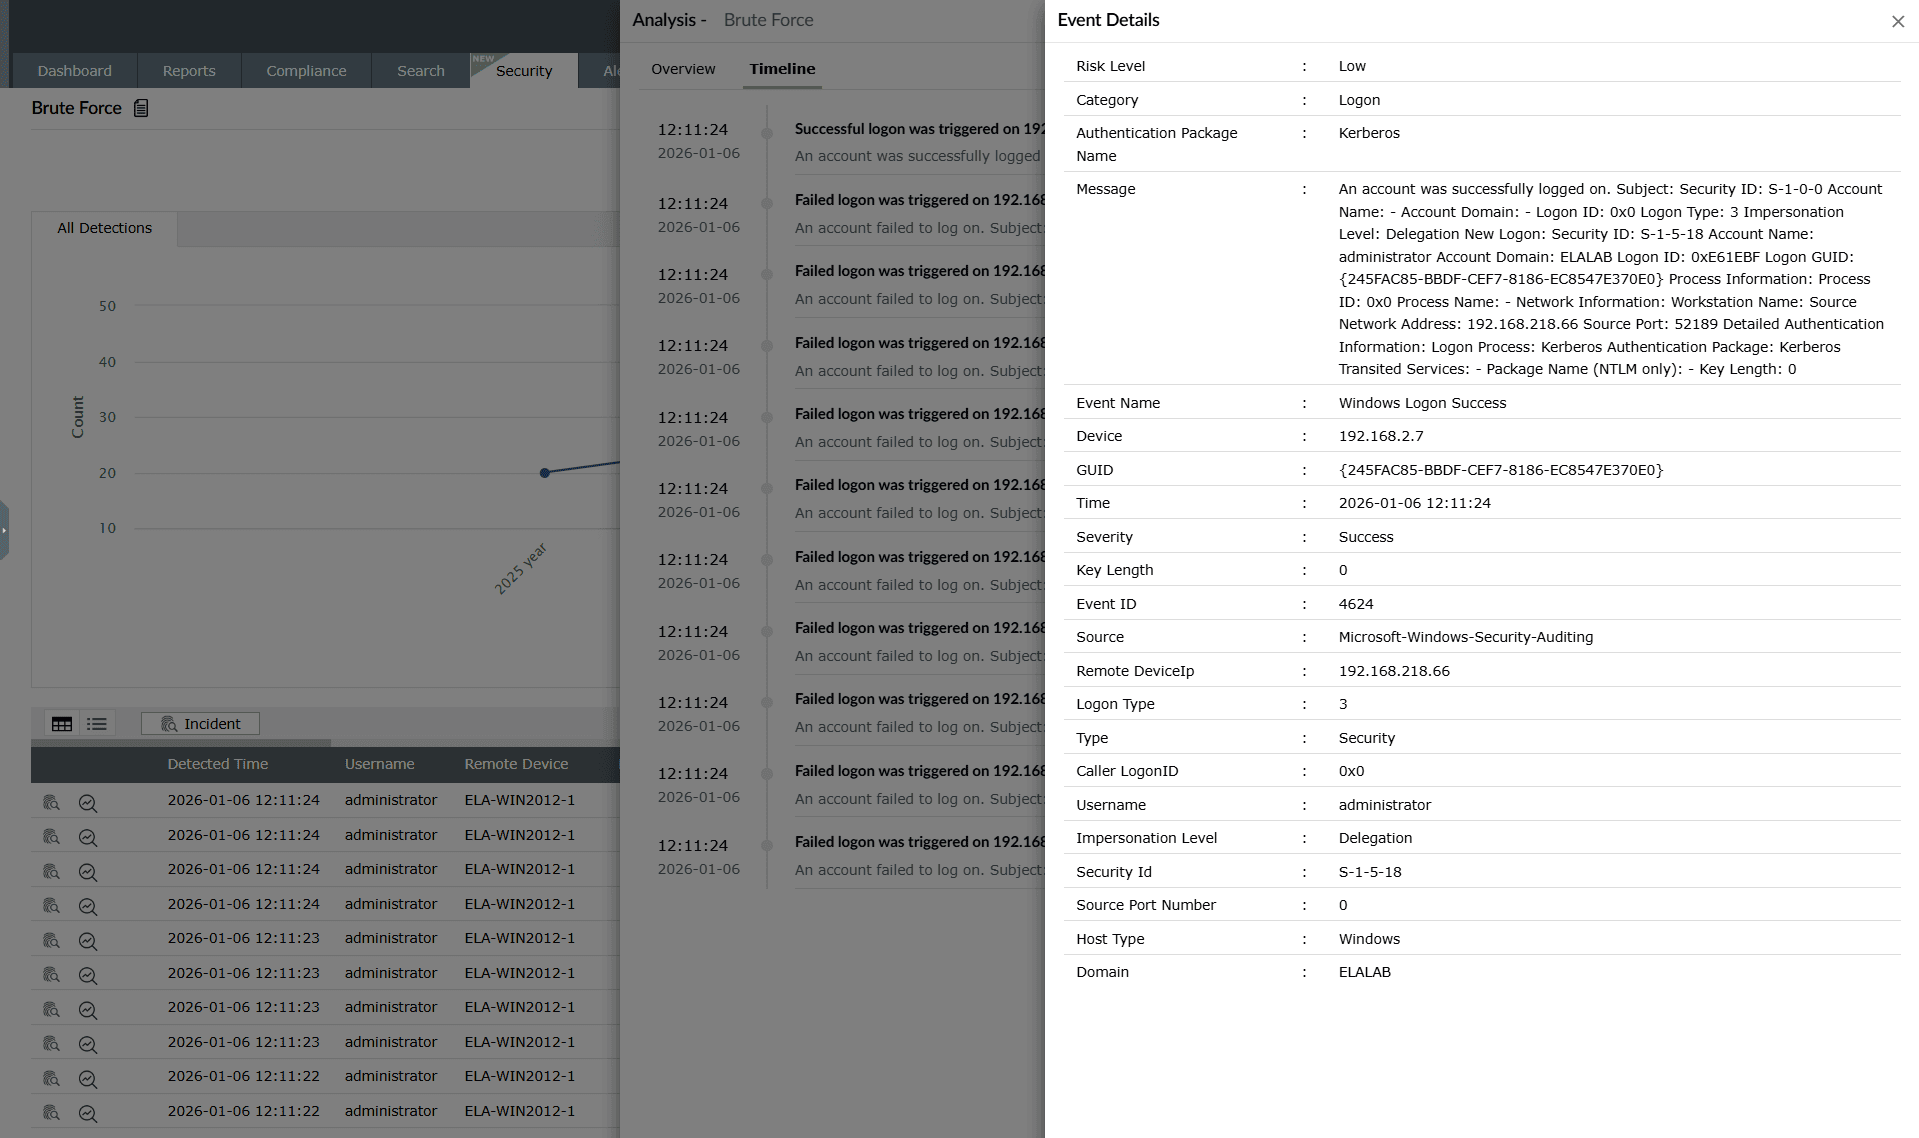
Image: Viewing the recent detections for a rule - You will be taken to the detections identified for that rule. Click on the View Event Analysis icon as highlighted below.
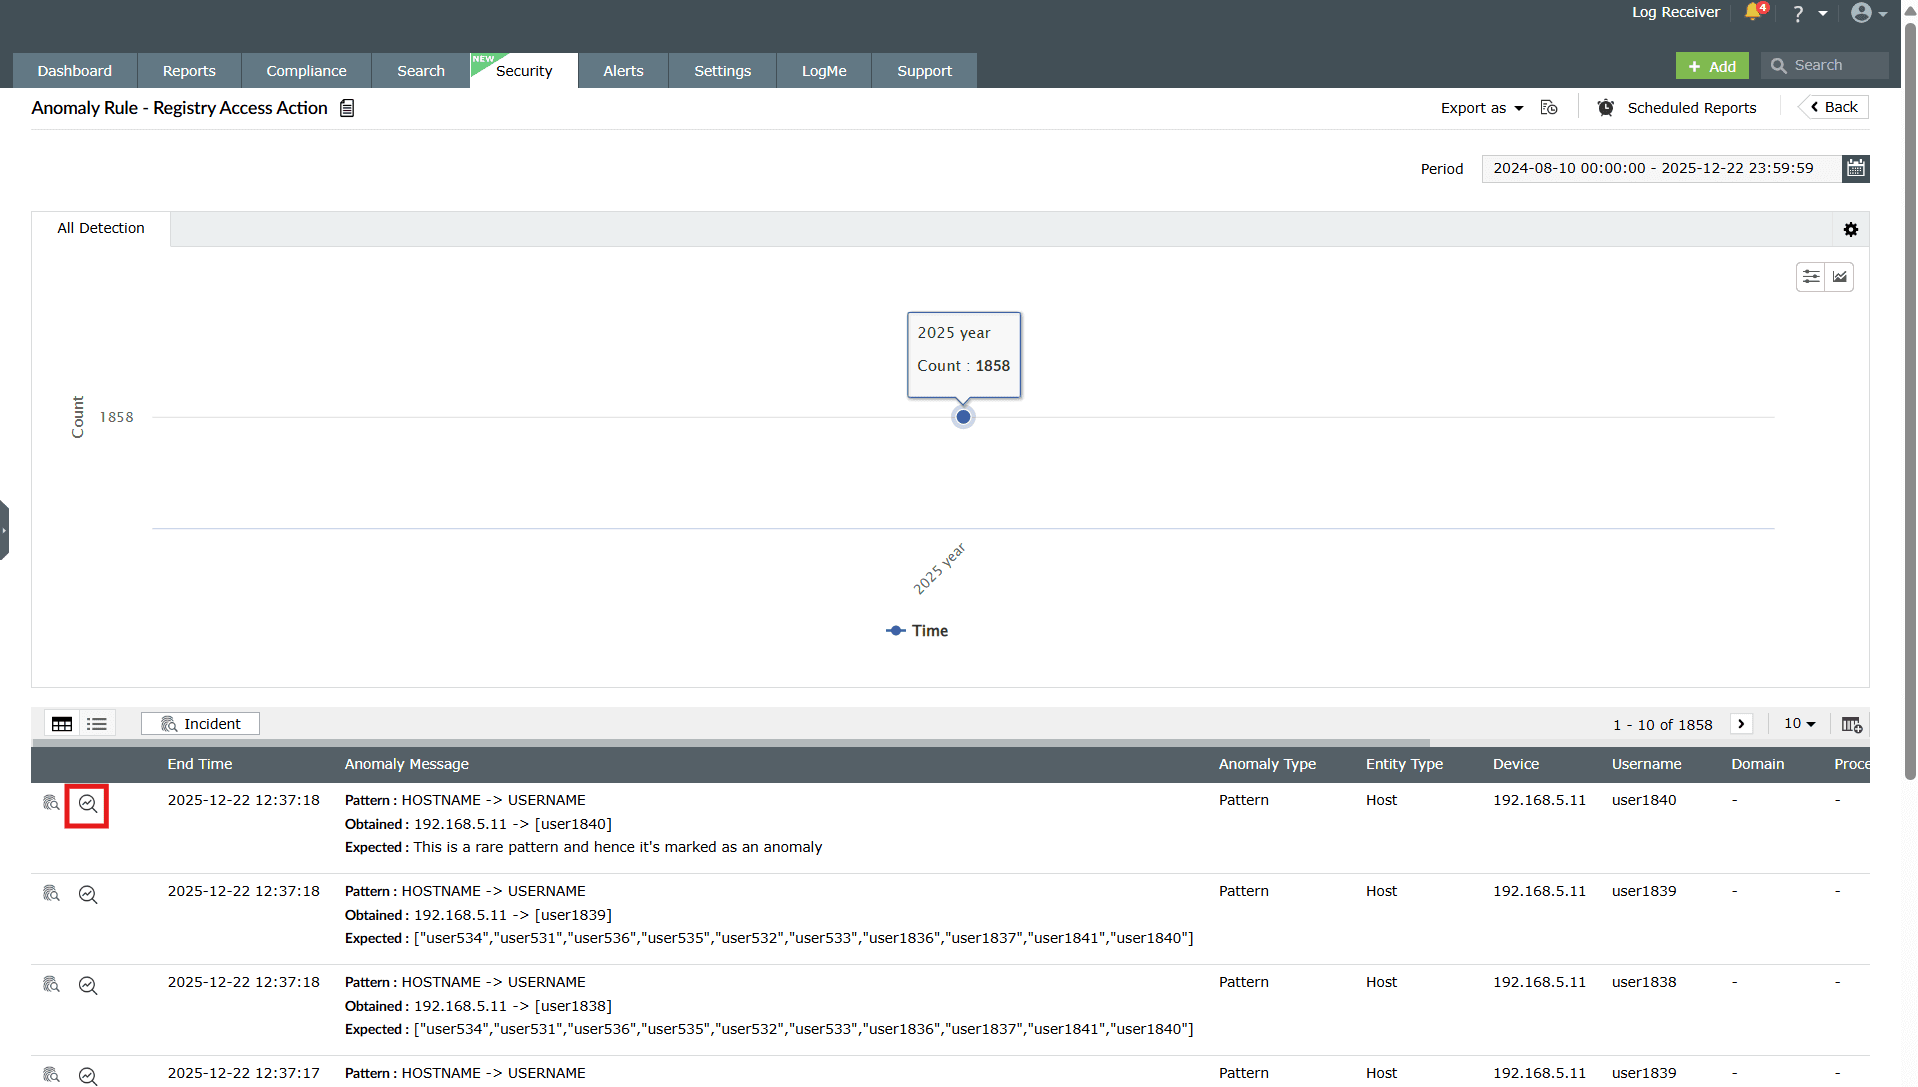
Image: Viewing event analysis for a rule detection - Click on Timeline to view the timeline view on the event analysis.
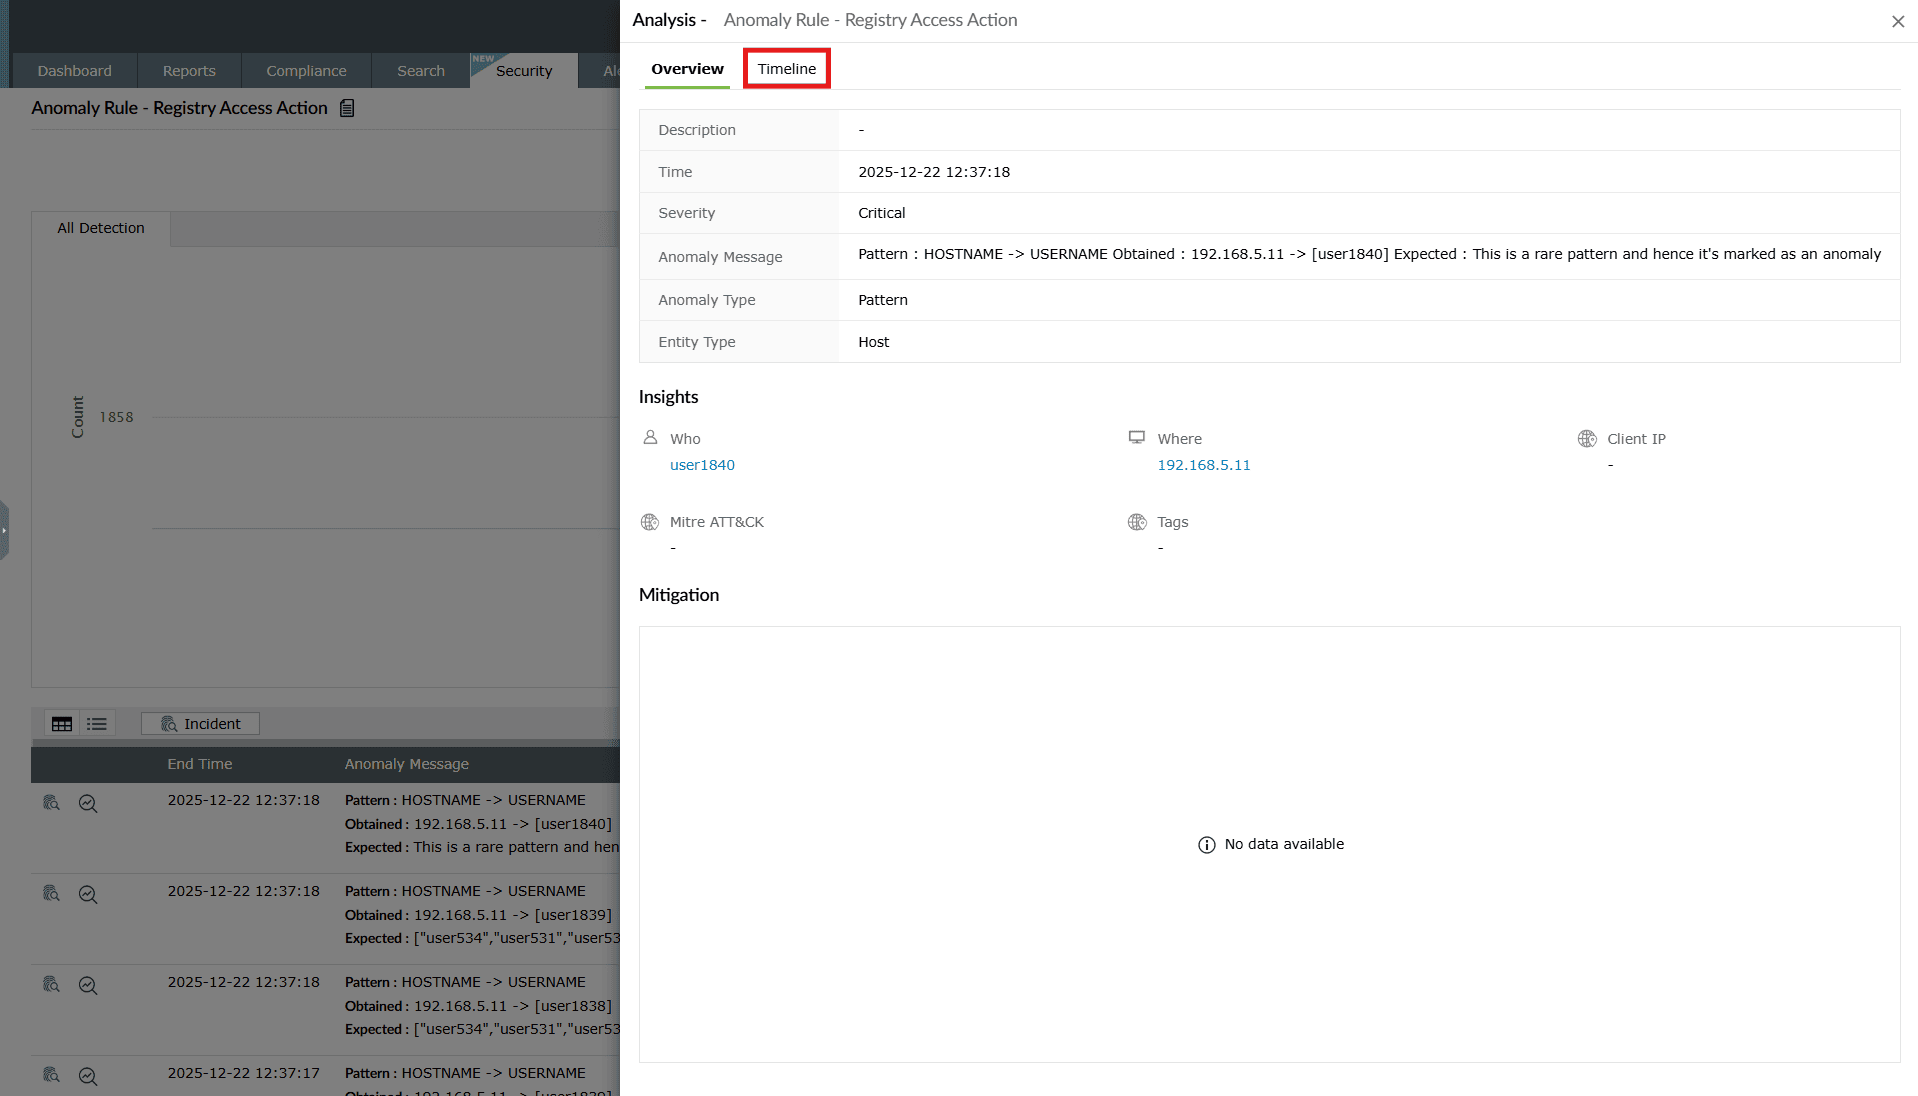
Image: Timeline view of event analysis of a rule - Click on Details.
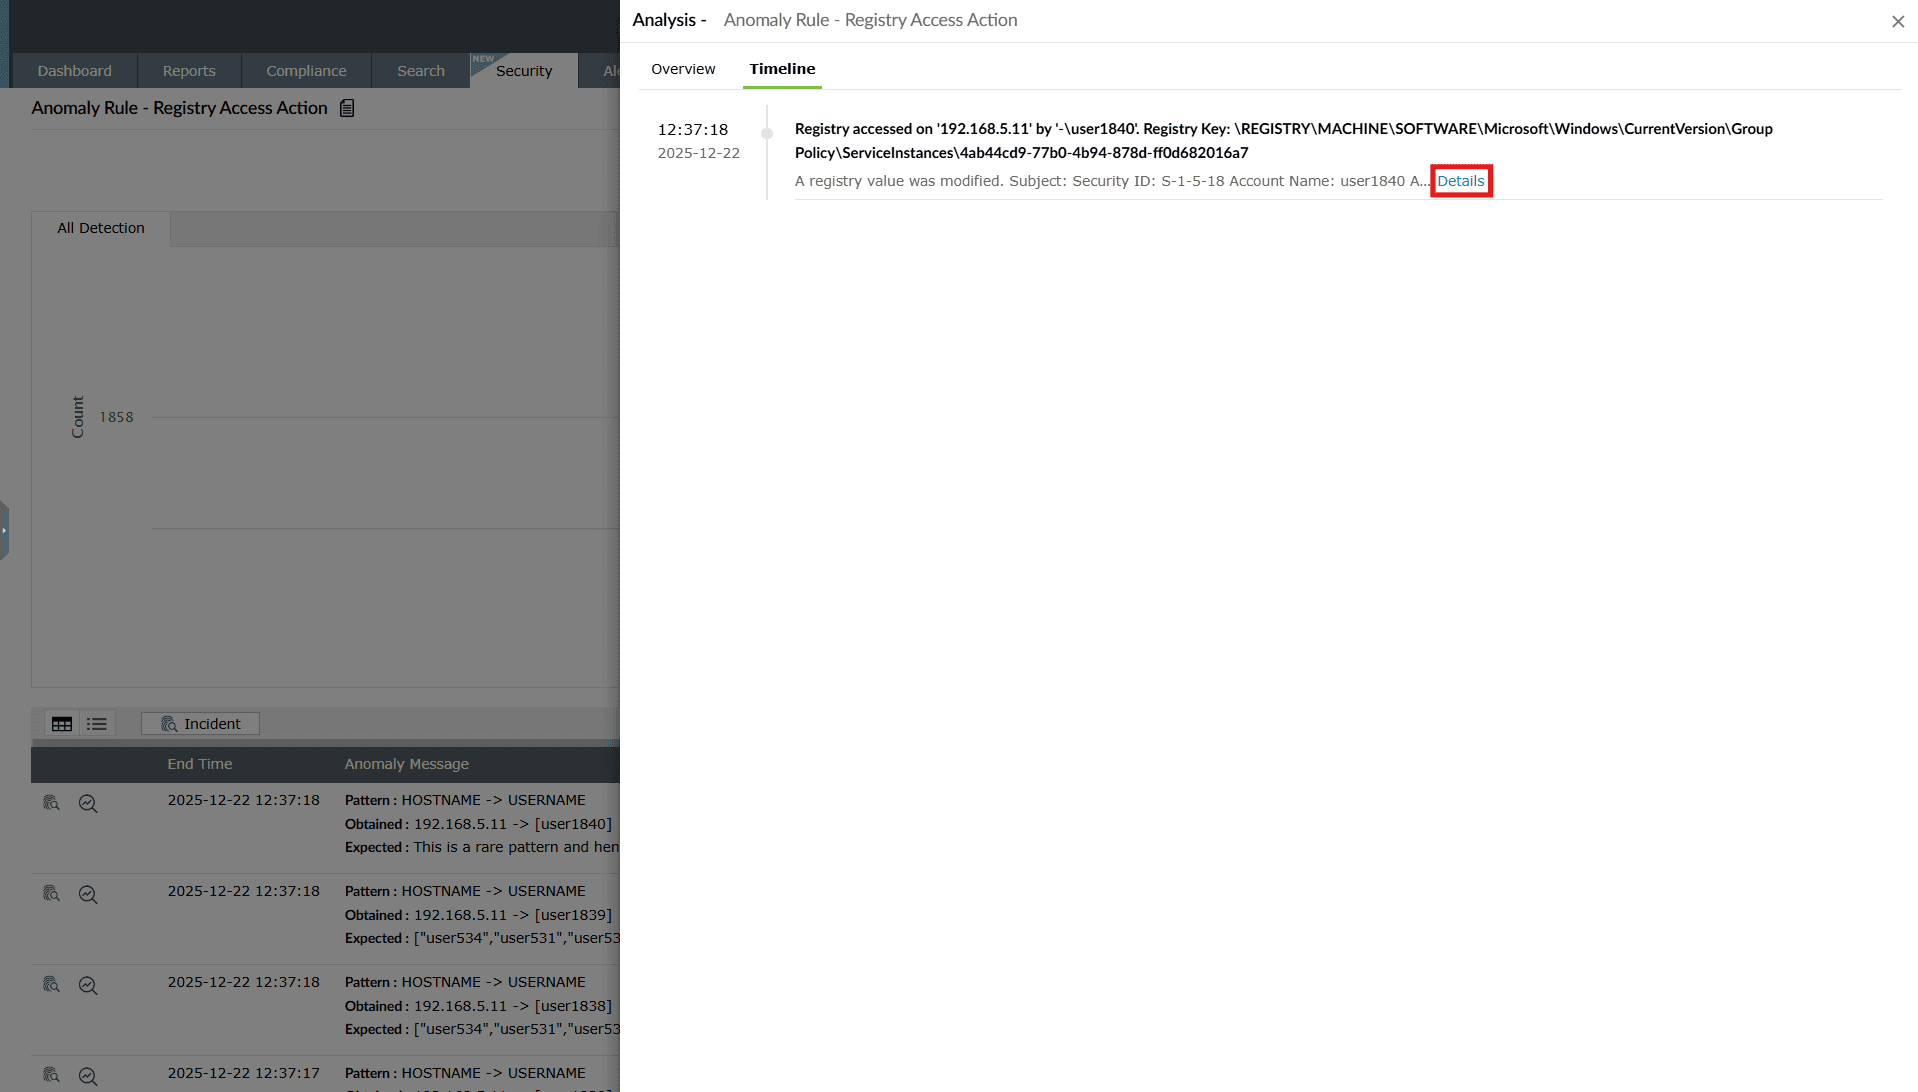
Image: Viewing event analysis for a rule detection - The Event Details pane slides open where you can view all the details of the detection flagged for that rule.
Standard rule detections
Once a standard rule is configured and enabled, the product continuously monitors incoming logs for events that match the predefined detection conditions. Standard rules are signature-based, meaning a detection is triggered whenever a single log event satisfies the configured criteria such as event ID, log source type, user, object name, or message pattern. All triggered detections are listed under Detections.
The detection view helps you understand which activity matched the rule, who performed it, and the full event attributes recorded in the original log. This enables quick validation and triage of security-relevant events.
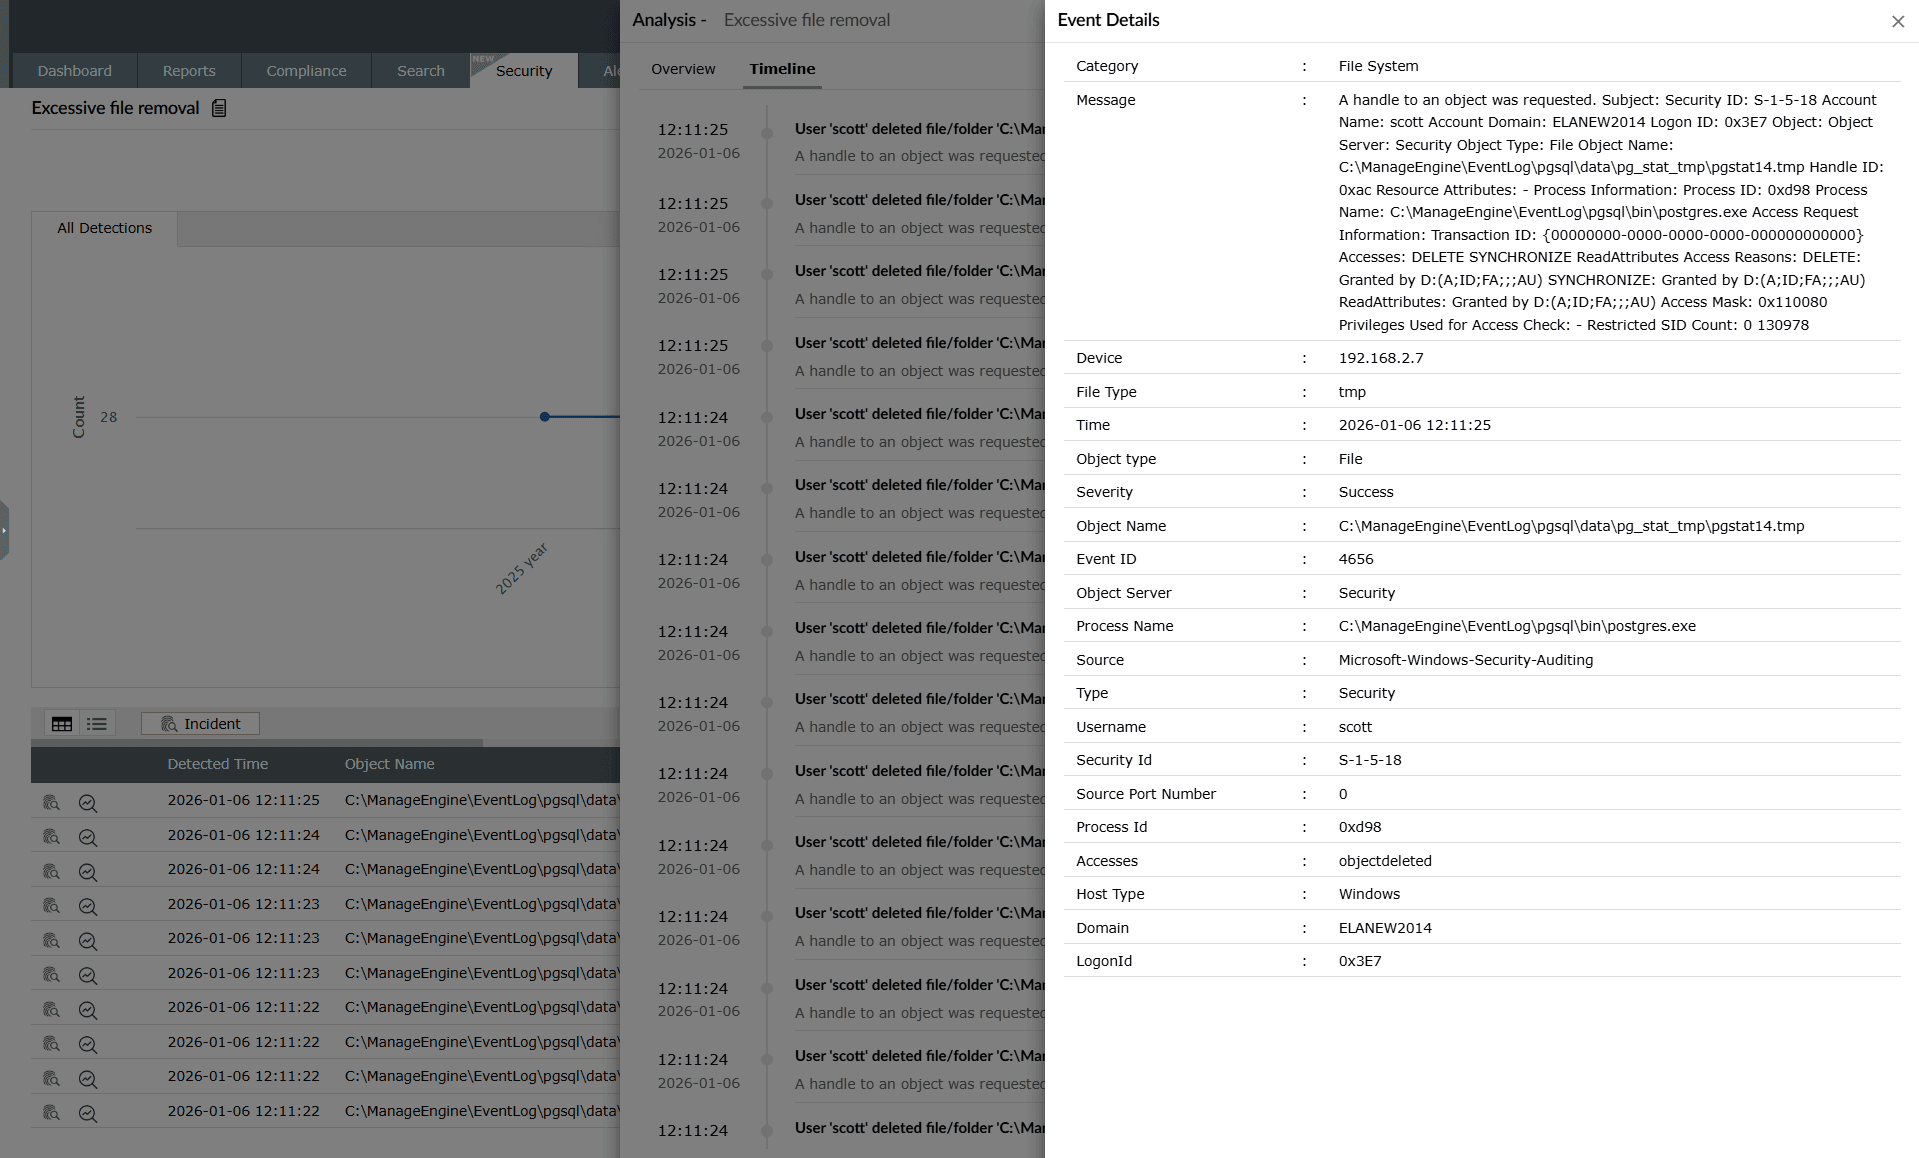
What gets detected
Each standard rule detection entry represents activity that matched the rule conditions. For non-HCR standard rules, this corresponds to a single log event. For HCR-based standard rules, the detection may be derived from multiple correlated events. The Event details panel displays the full raw context of the triggering activity.
When a standard rule detection is generated, the following details are shown:
- Message: A full description of the event as received from the log source. This typically includes
- user account details
- accessed object name
- process information
- access permissions and results
- Category and type: Indicates the log classification such as File System → Security, helping analysts immediately identify the nature of the activity.
- Time of occurrence: Displays the precise timestamp when the event was logged by the source system.
- Entity information: Key identity fields are captured, including:
- Username
- Domain
- Host name
- Security ID
- Object / resource accessed: Shows the exact file, folder, or resource referenced in the event. For example, in the screenshot this includes the full path of the deleted file.
- Event ID and source: Identifies the original log source event (such as Windows Security event ID 4656), supporting forensic traceability.
- Process information: Includes attributes such as:
- process name
- process ID
- object server
- Outcome and severity: Indicates whether the operation succeeded and the severity level assigned to the detection.
These fields collectively describe the detected event and provide sufficient technical detail to validate whether the activity is expected, suspicious, or malicious.
Interpreting standard rule detections
Use standard rule detections to:
- Identify security-relevant single events such as file access, logon attempts, privilege use, and configuration changes.
- Review the full raw event attributes for audit and investigation.
- Validate whether the detected action aligns with business activity.
- Quickly pivot to user- or host-level investigation when required.
Standard rules are ideal for monitoring known and clearly defined security-sensitive actions, where a single event is sufficient to justify alerting.
Anomaly rule detections
Once an anomaly rule is configured and enabled, the product continuously monitors incoming logs for behavioral deviations that match the conditions defined in the rule. When a deviation is detected, the platform flags it as an anomaly and records it in Detections.
The detection view helps you understand what was detected, why it was detected, and which entity triggered it, thereby enabling faster triage and response.
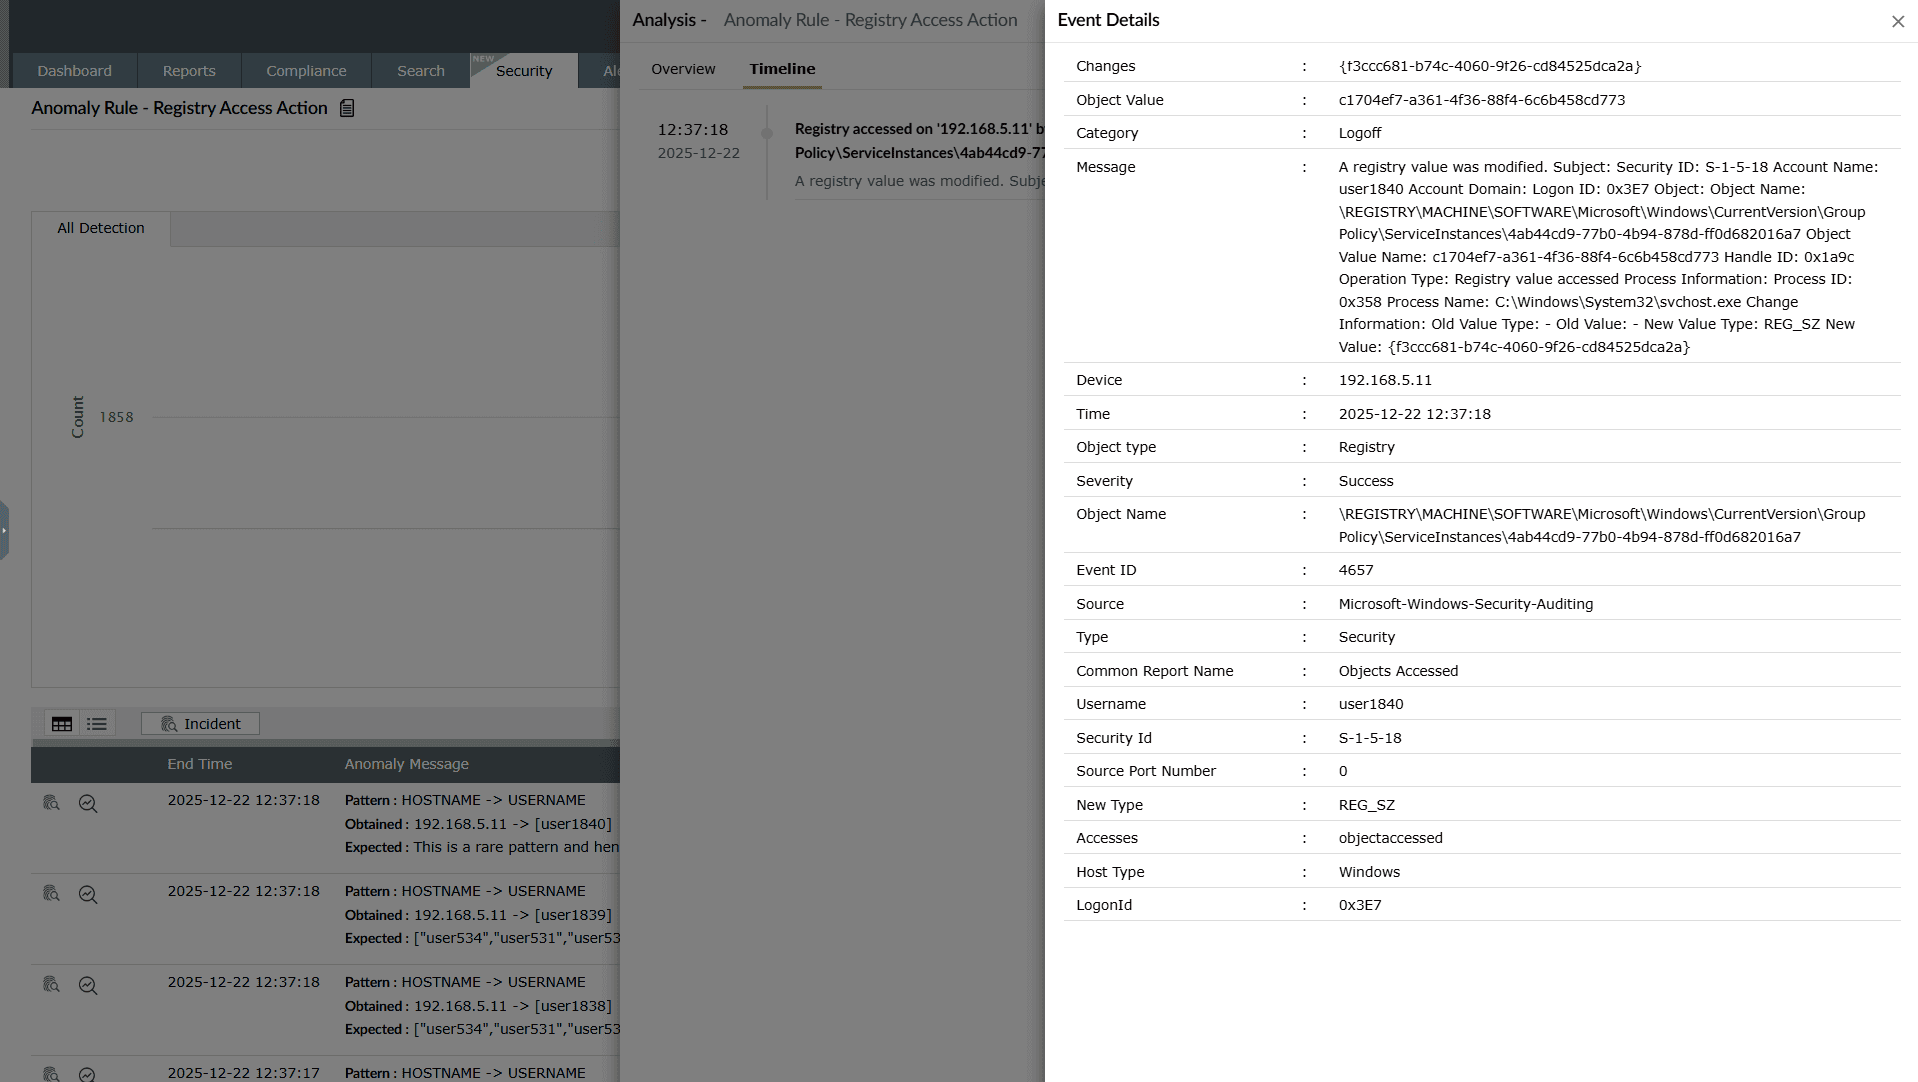
What gets detected:
Each anomaly detection entry displays the details associated with the triggered anomaly. The detection output is different from standard or advanced rules because anomaly rules rely on behavioral patterns, baselines, and threshold deviations, rather than static log signatures.
When an anomaly is detected, the following details are shown:
- Anomaly type: Specifies the category of deviation detected by the anomaly rule. Supported types include:
- Time: Activity occurred outside the normal time baseline.
- Count: The number of occurrences exceeded the expected threshold.
- Pattern: The activity did not match the expected/usual behavioral pattern.
- Anomaly message: Describes the reason for detection, including the deviation pattern and the expected baseline behavior. For example:Pattern: HOSTNAME -> USERNAME Obtained: 192.168.23.12 -> [username]Expected patterns and historical baselines are also shown, enabling analysts to understand how the event differs from normal user or system behavior.
- Entity type: Indicates whether the anomaly was triggered by a user, host, application, or service account. Entity classification helps in correlating repeated anomalies from the same source.
- Entity name: Displays the identity of the anomalous entity. For example, the user or host responsible for the deviation. This helps in quickly pivoting to user- or asset-centric investigations.
- Event details: The raw event context captured from the log source (for example, Windows security logs). This includes source IP addresses, timestamps, account domain details, security IDs, logon identifiers, and event IDs.
These details collectively explain the anomaly and enable you to determine whether the deviation is malicious, suspicious, or business-driven.
Interpreting anomaly detections
Use anomaly detections to:
- Identify unusual access patterns or privilege changes that might indicate account misuse.
- Track deviations from a user's historical behavior, such as abnormal login hours, unfamiliar machines, or irregular authentication locations.
- Detect unauthorized host-level configuration changes.
- Correlate multiple anomalies from the same user or machine to build an incident hypothesis.
Advanced rule detections
Once an advanced rule is configured and enabled, the product continuously evaluates incoming logs against the static conditions defined in the rule. When an event matches the configured logic (for example, repeated authentication failures from a single source), the platform flags it as a detection and records it in Detections.
The detection view helps you determine what was detected, why it was triggered, and which user or system was involved, enabling faster security analysis and response.
What gets detected:
Each advanced detection entry includes an Event details view, which displays the full raw log attributes associated with the triggered event. Unlike anomaly detections that rely on behavioral deviations, this view reflects a direct match against a predefined rule condition, such as a specific authentication activity or logon event.
When an advanced rule detection is triggered, the following event-level details are shown:
- Risk level: Indicates the risk rating of the individual log event (for example, Low, Medium, or High). This helps analysts assess the criticality of the detected activity.
- Category: Specifies the type of event. In this example, the event falls under the Logon category.
- Authentication package: Shows the authentication mechanism used during the logon attempt (for example, Kerberos). This is useful for distinguishing between authentication flows such as Kerberos and NTLM.
- Message: Displays the complete raw audit message from the log source. This includes key contextual fields such as security identifiers, account name, process details, network address, and impersonation level. The raw message provides full forensic context for validation and investigation.
- Event name: Indicates the event type generated by the operating system. For example: Windows Logon Success.
- Device: Displays the device or host on which the event occurred.
- GUID: Represents the unique identifier associated with the logon event.
- Time: Shows the exact timestamp when the event was recorded.
- Severity: Indicates whether the logon event resulted in Success or Failure.
- Event ID: Displays the operating system audit event ID. For example, 4624, which corresponds to a successful logon event in Windows.
- Source: Specifies the log source type, such as Microsoft-Windows-Security-Auditing.
- Remote device IP: Shows the IP address of the remote machine that initiated the authentication request.
- Logon type: Displays the logon session type (for example, 3 — network logon). This helps analysts distinguish between local, network, batch, or service-based authentication.
- Caller logon ID: Indicates the logon session identifier of the process that initiated the authentication.
- Username and security identifier: Displays the user account and corresponding SID involved in the logon.
- Impersonation level: Shows whether the account is being used for delegated access.
- Additional network and host attributes: These include details such as source port, host type, and domain information, which further describe how and where the logon was initiated.
These fields collectively recreate the complete authentication event context, helping analysts validate the detected activity and determine whether it represents legitimate access or malicious behavior.
Interpreting advanced detection event details
Use the Event details view to:
- Verify whether the detected logon was successful or failed
- Identify the originating device or IP used in authentication attempts
- Determine the authentication protocol and logon type involved
- Validate whether privileged accounts (such as administrators) were used
- Trace logon delegation or impersonation behavior
- Perform forensic correlation across related authentication events
By analyzing the Event details view, analysts gain precise, host-level visibility into authentication events — enabling faster validation, triage, and incident investigation.
Scheduled Reports
-
Click on the Scheduled Reports option as highlighted below.
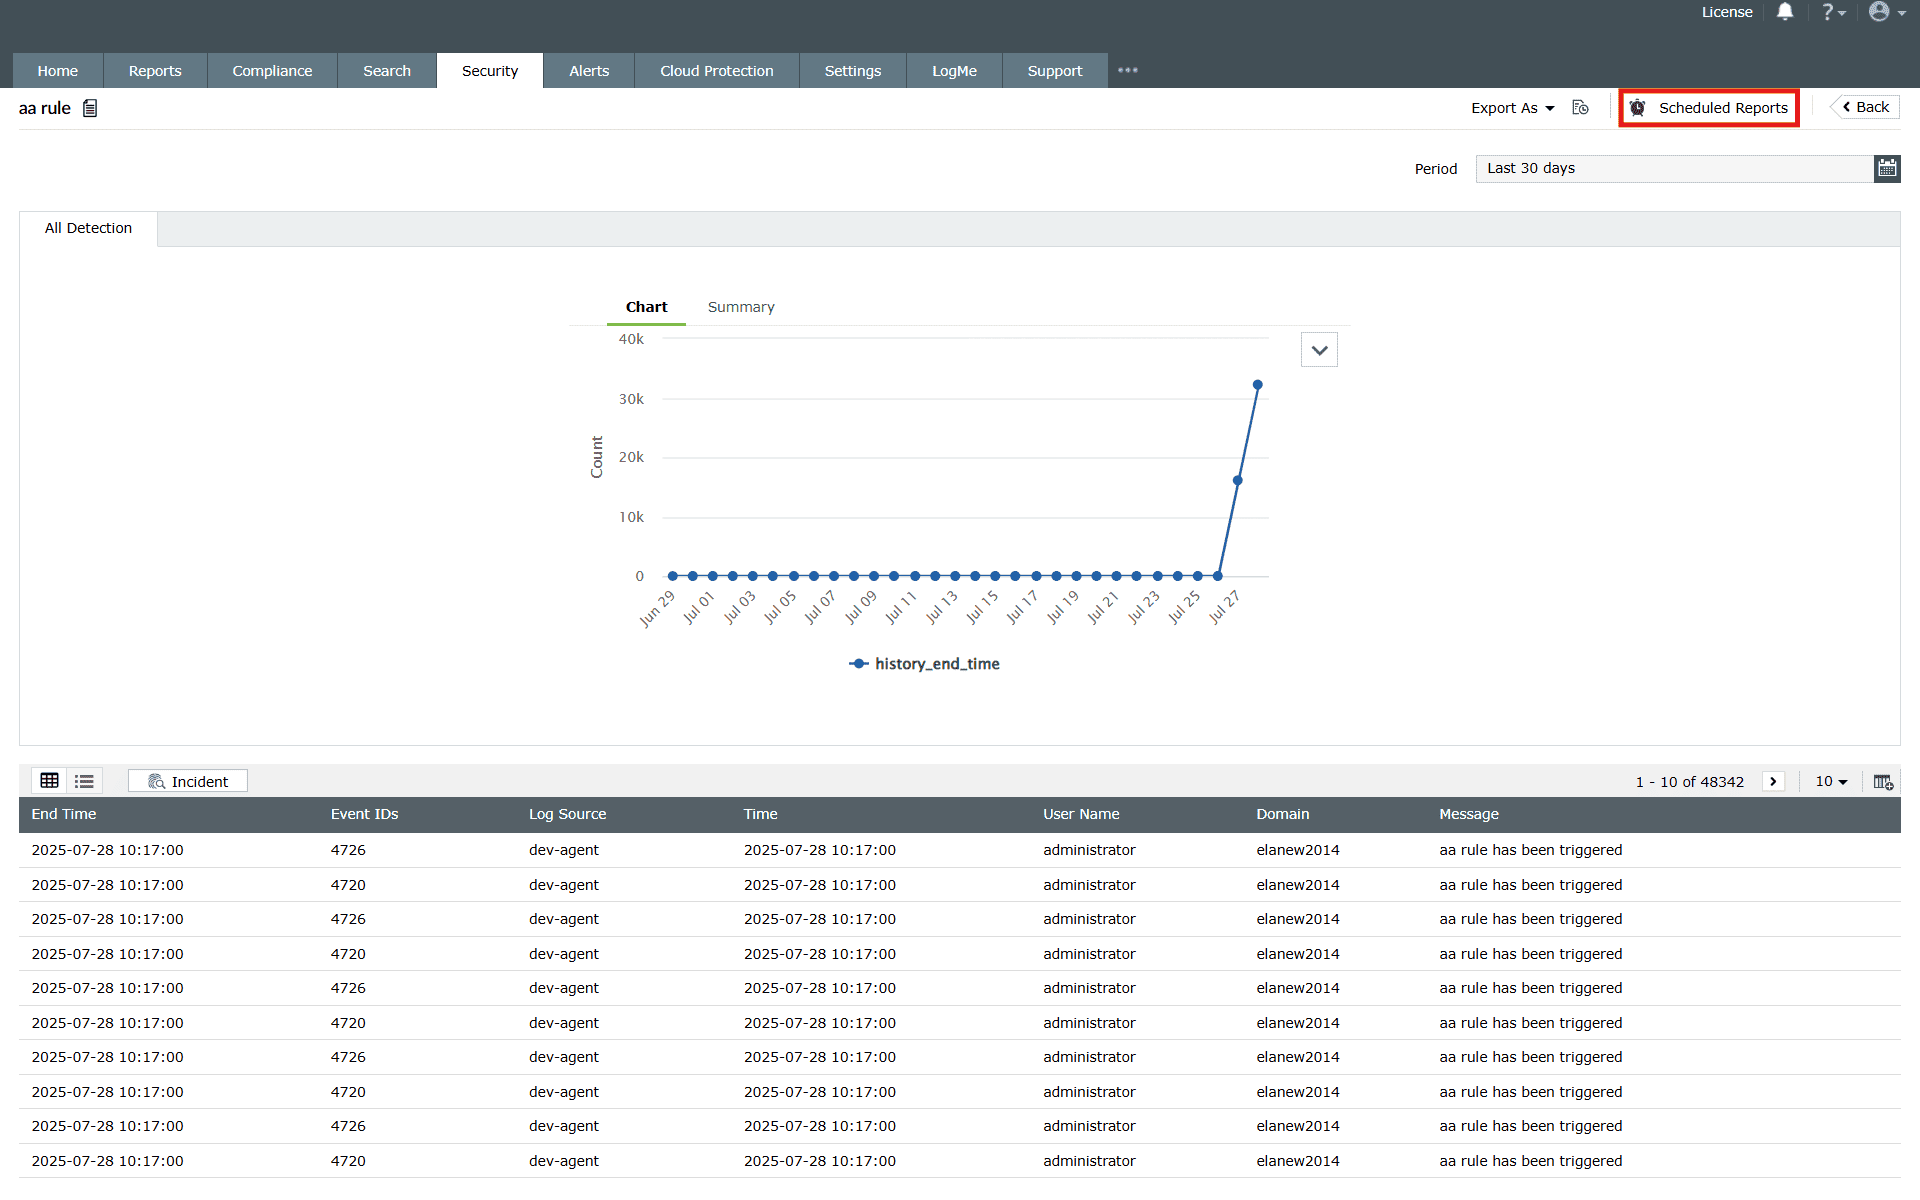
Image 27: Rule scheduled reports in the manage rules module - The available schedules for those rule reports (if any) will be shown on the screen.
-
You can create a schedule for a particular rule by following the steps below:
-
Click on Create Schedule as highlighted below.
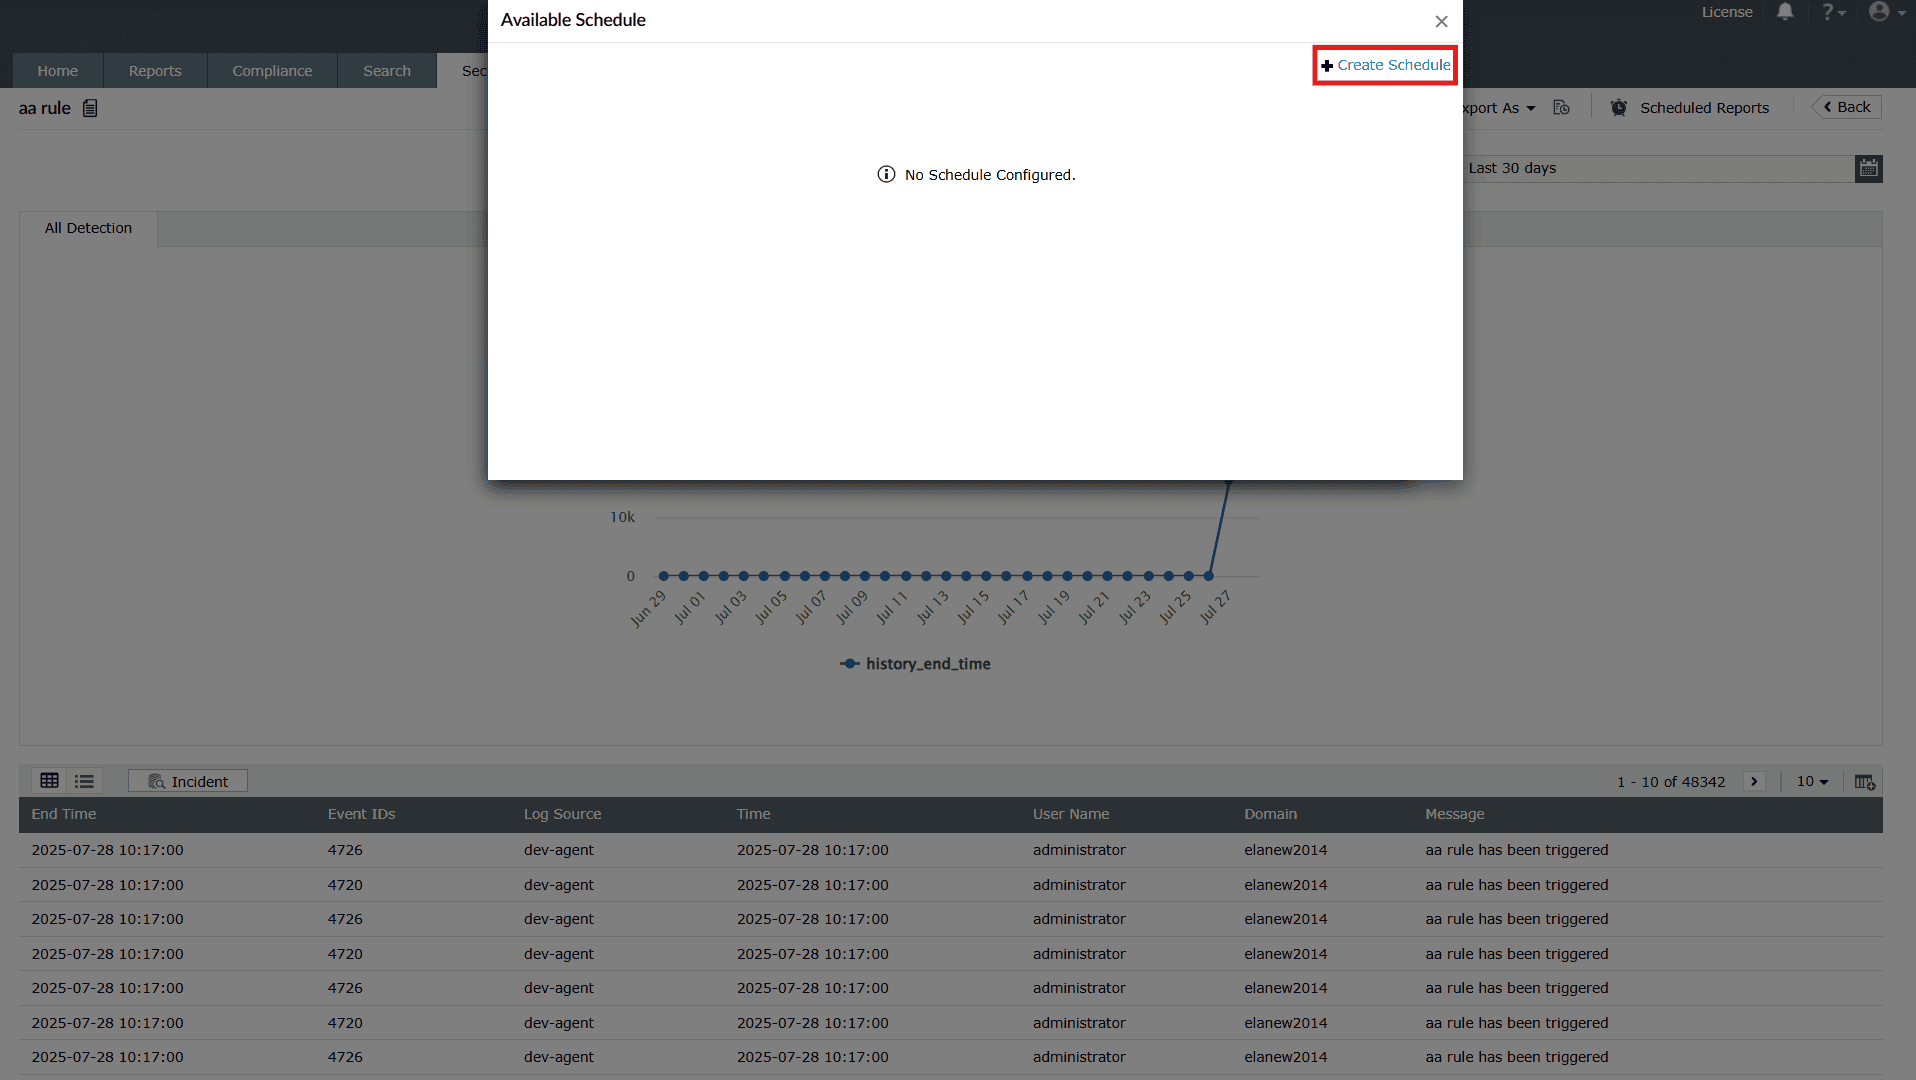
Image 28: Create scheduled reports in the manage rules module - Upon clicking, the pop-up will display the fields to Create
Schedule.
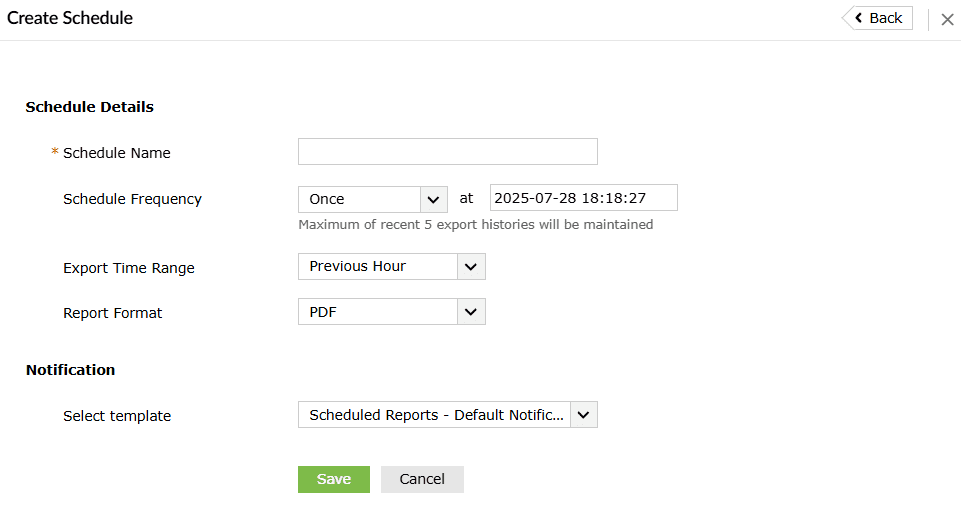
- Fill the necessary fields:
- Schedule Details
- Schedule Name: Assign a unique name to the schedule.
- Schedule Frequency: Define how often the schedule should run (hourly, daily, weekly, or monthly).
- Export Time Range: Specify the time range of data to include (e.g., last 24 hours, last 7 days, or custom).
- Report Format: Choose the preferred format for the exported report (PDF, CSV, XLS).
- Notification
- Select Template: Pick a predefined report template or customize one.
- Schedule Details
- After configuring the schedule, click on Save. Upon
successful
completion, the schedule is updated in the pop-up box, along with a
confirmation
message.

- You can also edit the schedule by clicking on the edit
icon in
the pop-up box. The same
fields appear for editing.
- Edit and click on Update. Upon successful completion, the
schedule is
updated in the pop-up box, along with a confirmation message.

-
Click on Create Schedule as highlighted below.
Read also
This document explained how to navigate the Manage Rules module, perform key actions on rules, view detailed rule summaries, tune performance, and generate detection reports for deeper analysis.