How to monitor risky sign-ins using Microsoft Entra ID workbooks
As one of the leading cloud-based IAM solutions, Microsoft Entra ID is widely adopted by organizations to manage identities and secure access to resources. Ensuring secure sign-ins is a critical priority, as identifying compromised accounts is essential to mitigating security risks. Monitoring your Microsoft Entra ID sign-in behaviors can uncover patterns indicating unauthorized access, including logins from unusual IP addresses, unfamiliar locations, odd hours, or unregistered devices.
Proactive monitoring is key to addressing these risks before they escalate into incidents. While using audit logs to track Microsoft 365 risky sign-ins provides valuable insights into specific incidents, they often lack the broader context needed to identify recurring issues or trends. Microsoft Entra ID workbooks solve this challenge by turning log data into customizable, interactive reports. By aggregating and displaying patterns such as the frequency of risk detections, user behavior anomalies, or geolocation-based risks, workbooks allow you to move beyond reactive troubleshooting. Instead of addressing one-off issues, you can uncover widespread causes and plan common preventive measures to mitigate recurring risks.
In this page, you will learn how to use a Microsoft Entra ID workbook to track risky sign-ins more efficiently and what insights can be derived from each report in the workbook.
How to access the Sign-In Analysis workbook in Microsoft Entra ID
The Sign-In Analysis workbook is one of the Public Workbook Templates available in Microsoft Entra ID. You can access this workbook by following these steps:
- Log in to Microsoft Entra ID with an account that has the permissions to access Workbooks.
- Navigate to Identity > Monitoring & Health > Workbooks and select Sign-In Analysis.
- You can filter the sign-ins displayed using the following filters:
- ADFS Data Enabled: View data from Active Directory Federated Services and track hybrid data.
- TimeRange: Narrow down the search to a specified time period.
- Apps: Focus your search to only the selected applications.
- Users: Monitor the details of certain users in your environment.
- You will be able to view the following reports in the General Analysis tab of the workbook.
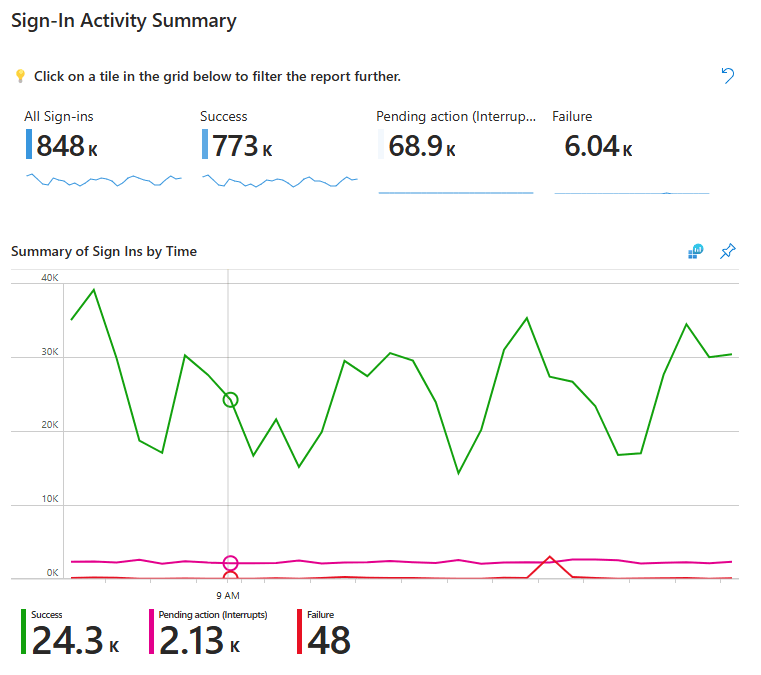
- Sign-In Activity Summary
This report shows the metrics and trends of all sign-ins, including successful, pending, and failed sign-ins. This helps to verify the consistency of sign-ins and identify if there are any peaks or risky variations to them. You can also view the trend of the same data across the specified time range using the Summary of Sign Ins by Time graph. Hover over the graph, and you can view the successful, failed, and interrupted sign-ins for that period in the selected date.
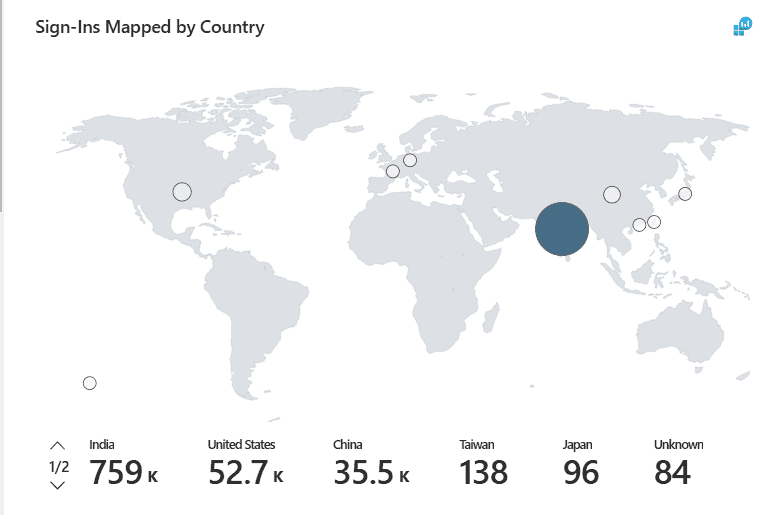
- Sign-in Analysis by Location
The heat map and report under this category show the number of total and failed sign-ins by the country or city from which the sign-in activities took place. This data can be used to analyze the geographic patterns of sign-in activity, identify potential unauthorized access attempts from unusual locations, and detect trends that may indicate security risks, such as repeated failed sign-ins from high-risk regions.
The Sign-Ins Mapped by Country heat map shows the graphical data of the sign-ins from each country. Hovering over the country isolates the number of sign-ins from that specific location.
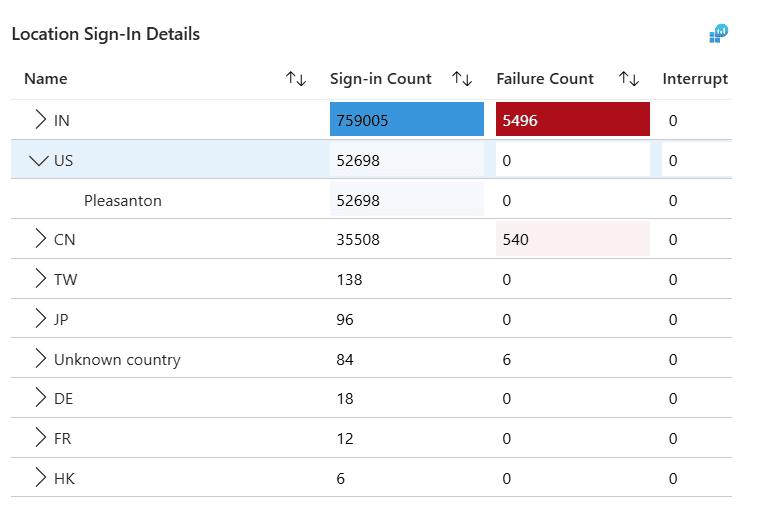
The Location Sign-In Details report displays the metrics of the sign-in data from each country. Clicking the > icon beside a country expands it to show the data for each city.
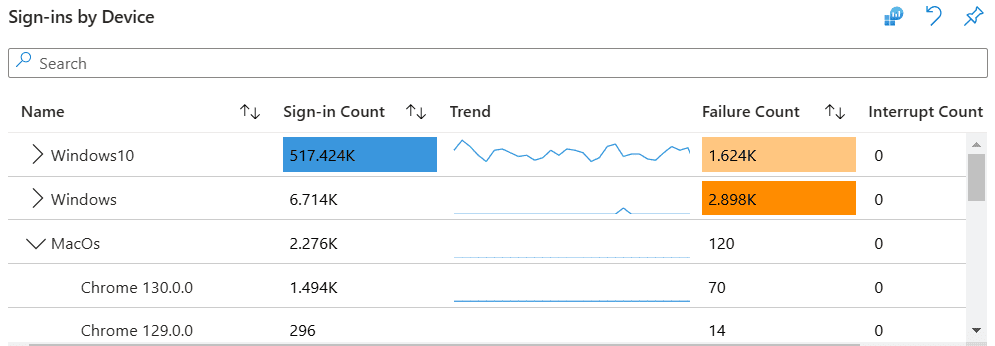
- Sign-in Analysis by Device
The reports under this category show the number of total and failed sign-ins in the platforms and user agents, and by the specific users. This can be used to isolate device-specific issues, identify unauthorized devices attempting access, and detect patterns of risky sign-ins associated with particular platforms or user agents.
The Sign-Ins by Device report displays the number of total, failed, and interrupted sign-ins by the platforms used to sign in to Microsoft 365 and the trend graphs for each metric. Clicking the > icon beside a platform expands it to show the data for each user.
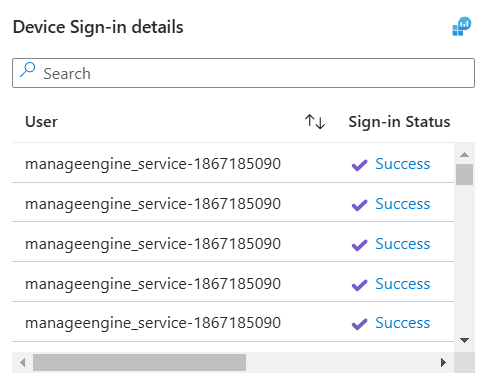
Clicking the platform shows all sign-ins and their status from the specific platform in the Device Sign-in details report.
- Sign-In Activity Summary
- You can click the Error Analysis tab to view the following reports.
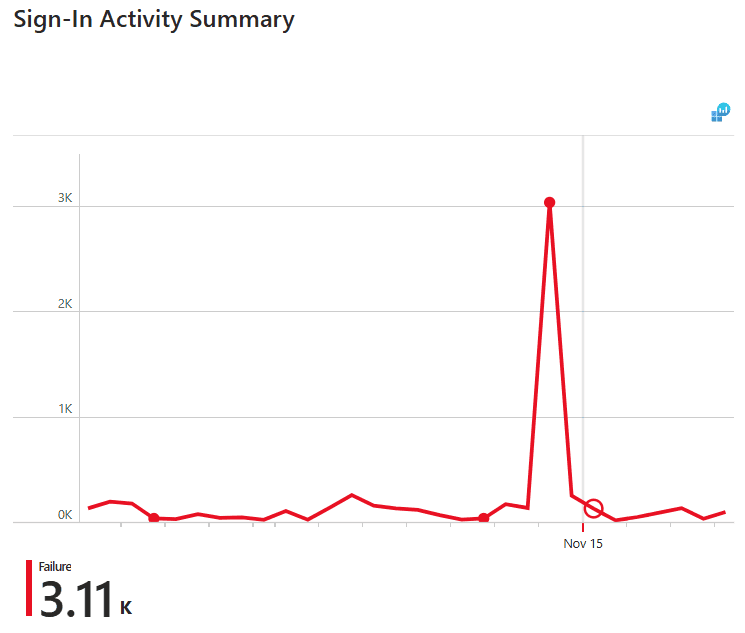
- Sign-In Activity Summary
This graph shows the metrics and trends of all failed sign-ins in your tenant. Hover over the graph, and you can view the failed sign-ins for that period in the chosen date.
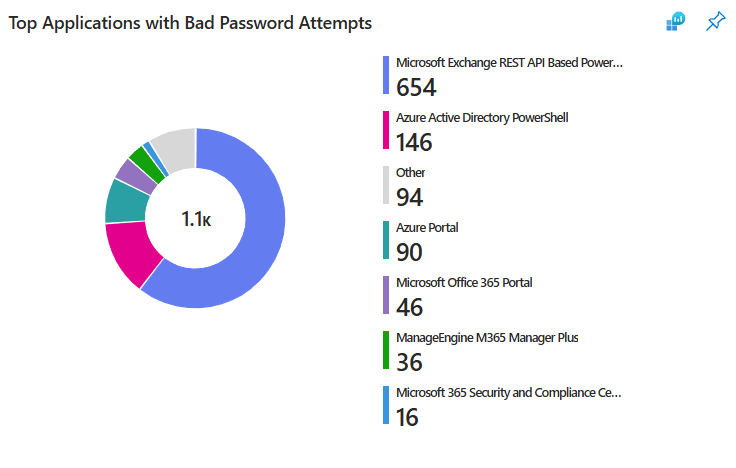
- Top Applications with Bad Password Attempts
This pie chart shows the applications to which users logged in with incorrect passwords. This data can be helpful to identify applications that are being targeted by users or bad actors and which applications require more protection via authentication methods using Conditional Access.
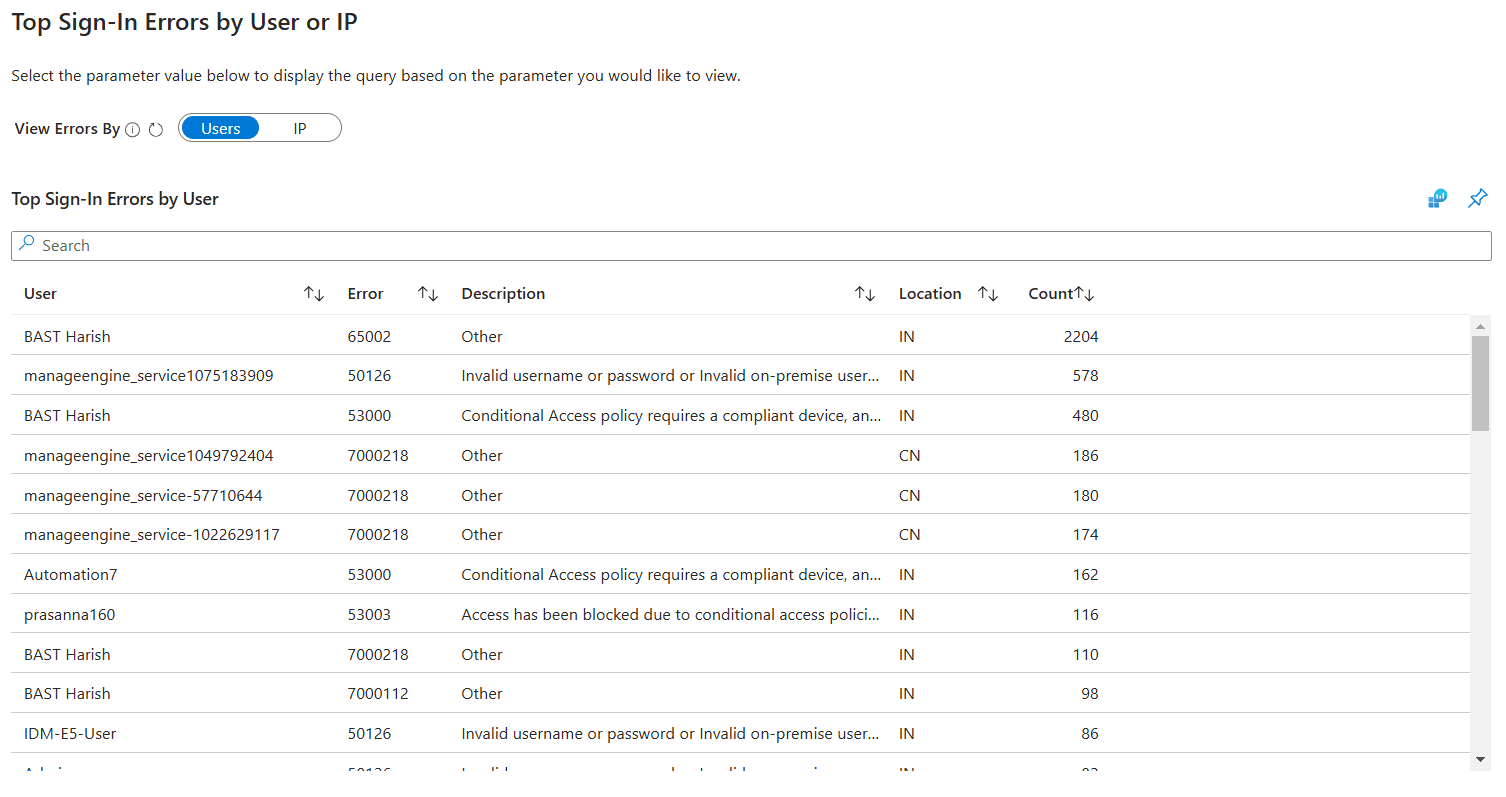
- Top Sign-In Errors by User or IP
This report displays the users or IP addresses (selected via the View Errors By filter) that have encountered the most failed sign-ins in your tenant. The report shows the main reason for their failed sign-in, the location, and the number of failed sign-ins. This helps identify your high-risk users and devices and skim them for any irregularities in sign-in patterns to identify budding threats.
- Sign-In Activity Summary
Get a clear overview of your Microsoft 365 environment with M365 Manager Plus
ManageEngine M365 Manager Plus is a comprehensive administration and security solution for Microsoft 365 used for reporting, managing, monitoring, auditing, and creating alerts for critical activities in your Microsoft 365 environments. You can gain a thorough understanding of your environment not just in Microsoft Entra ID, but also Exchange Online, SharePoint Online, OneDrive for Business, and other Microsoft 365 services, with detailed reports and intuitive visualizations, all from a single console.
Here are more benefits of using M365 Manager Plus to manage and monitor your Microsoft 365 environment:
- Filter your reports once and save them as custom reports that you can access in just a few clicks.
- Export reports generated in M365 Manager Plus in not just CSV, but also in other presentable formats such as HTML, PDF, and XLSX.
- Delegate granular permissions to technicians without elevating their Microsoft 365 privileges and create custom roles with any combination of reporting, management, and auditing tasks.
- Easily manage users, groups, contacts, mailboxes, teams, and sites in bulk without PowerShell scripting.
- Keep tabs on even the most granular user activities in your Microsoft 365 environment.
- Configure alert profiles in M365 Manager Plus to notify you of specific activities that take place outside of business hours or occur at unusual frequencies.
- Monitor the health and performance of Microsoft 365 features and endpoints around the clock.
Effortlessly schedule and export reports on your Microsoft 365 environment.
Try now for freeStreamline your Microsoft 365 governance and administration with M365 Manager Plus
Get Your Free Trial