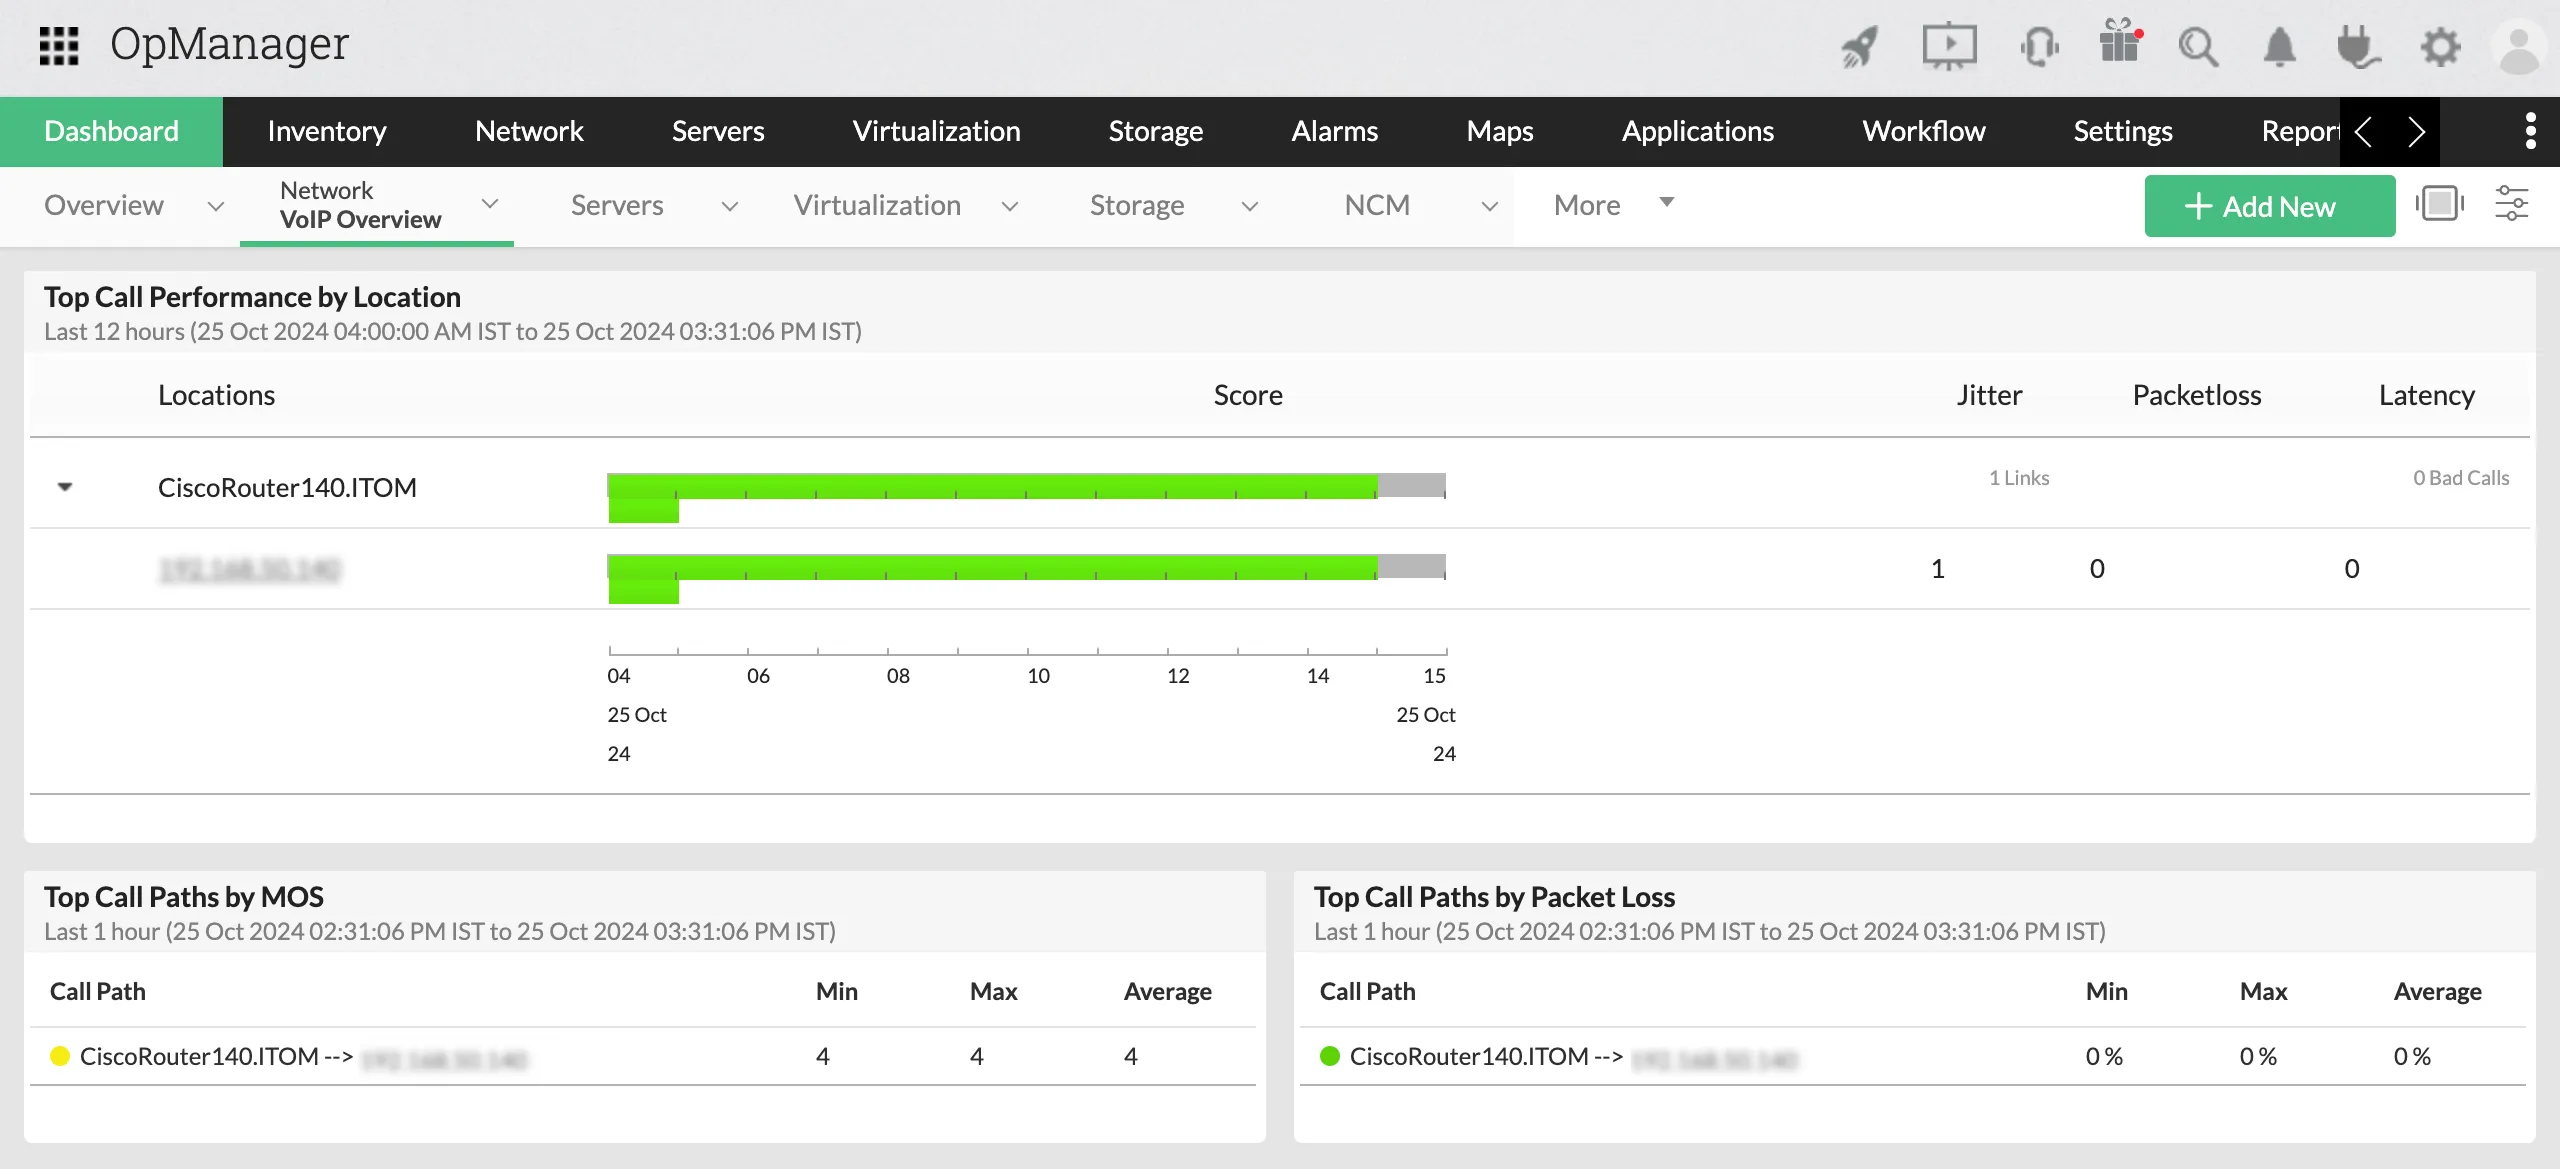
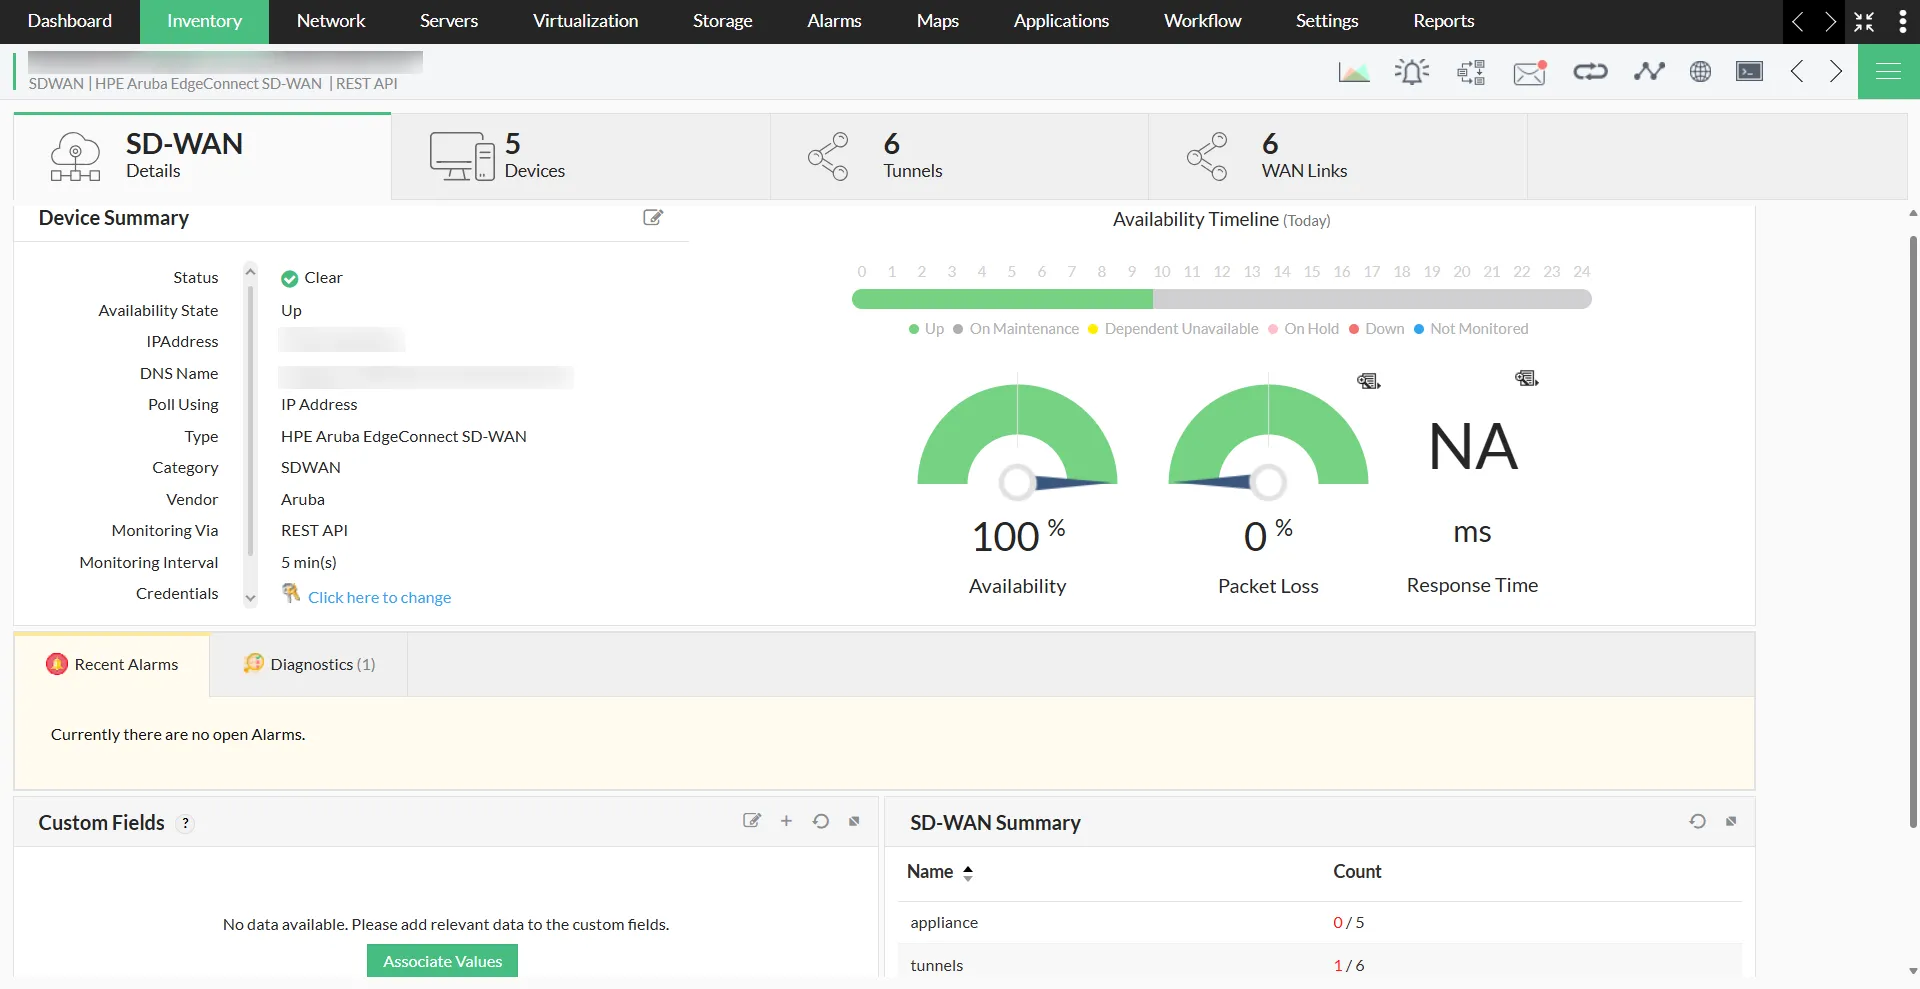
Transparent pricing you can see before the sales call
Motadata's pricing is not transparently published online, requiring direct sales engagement for a quote. In contrast, OpManager's pricing is fully published on our store page, starting at just $245/year for 10 devices. Licensing is clear: pay per device, with unlimited interfaces and sensors included. For perpetual licenses, an Annual Maintenance and Support (AMS) subscription covers product updates and technical support. Subscription editions include support and upgrades by default. Everything is outlined upfront—no unexpected add-ons, no last-minute cost escalations.