Simplify hybrid network monitoring with OpManager Nexus
Enterprise networks have evolved from simple on-premises network into a sprawling ecosystem of on-premises infrastructure, cloud platforms, virtual machines, and containerized applications.
Organizations are embracing hybrid and multi-cloud strategies to gain agility, scalability, and resilience. But with that evolution comes greater complexity and a new set of challenges for IT teams in maintaining the performance of the hybrid networks.
Challenges in monitoring hybrid networks
The convergence of multiple technologies, environments, and architectures introduces several hurdles that traditional monitoring tools weren’t designed to handle. Some of the common challenges are:
1. Heterogeneous networks and data siloes
In hybrid IT environments, organizations manage a heterogeneous mix of technologies such as cloud computing, SD-WAN, virtualization, containerization, and edge computing, each built on different architectures and managed by specialized teams like cloud, network, and server administrators.
Every team relies on dedicated tools such as vendor based cloud dashboards, virtualization consoles, network and application monitoring tools to manage their respective domains.
However, this diversity of technologies and tools creates data silos and inconsistent visibility across the environment. Since each platform follows its own standards, metrics, there’s no uniform way to collect or interpret performance data.
This lack of standardization makes it harder to gain a complete, accurate picture of the hybrid network’s health. As a result, correlating performance data between layers becomes time-consuming, making root cause analysis difficult and slowing down issue resolution.
2. Alert fatigue
Hybrid IT environments generate massive volumes of performance data. Without intelligent correlation, this data merely becomes noise. With a huge number of alerts, IT teams often miss the most critical warnings.
So to identifying what truly impacts end-user experience and network performance you require more than raw data. With AI-assisted insights, ML based adaptive thresholds, and smart alerting mechanisms you can filter out the noise and identify the serious issues that IT teams can focus on.
3. Complex interdependencies between components
Modern business services are dependent on a diverse environment including a blend of physical, virtual and cloud native systems. Take an online purchase application, for example: when a customer places an order, the request might first go to a web server running on a virtual machine, then to a containerized microservice in a Kubernetes cluster that processes the order, and finally to a cloud database that stores transaction details.
If the order takes too long or fails, the slowdown could stem from any one of these layers the VM, the container, or the database. Without dependency mapping and comprehensive visibility into how these components interact, IT teams will find it difficult to identify the actual root cause.
4. Ensuring superior user experience
When workloads are distributed across on-premises data centers, cloud platforms, and edge devices, maintaining consistent performance for end users is a constant challenge. For example, in a video conferencing app, a small routing misconfiguration in a cloud region or a slight delay in one data center can cause lag, frozen screens, or poor audio for thousands of users who connect to the app.
Ensuring near-zero downtime and a consistent user experience across all environments requires unified monitoring and automated remediation capabilities that traditional, siloed tools are unable to provide.
OpManager Nexus: Desgined to meet the monitoring needs of modern networks
OpManager Nexus is a full-stack network monitoring solution that helps you manage your entire IT infrastructure from a single console. It provides complete visibility into your network stack, maps dependencies, delivers AI-powered insights for proactive issue detection, and empowers IT teams to maintain optimal performance with ease.
Comprehensive monitoring across all layers
1. Cloud and container monitoring
OpManager Nexus provides unified cloud and container performance monitoring, giving IT teams complete visibility into applications, services, and infrastructure across hybrid and multi-cloud environments from a single console. By automatically discovering cloud applications and services running on platforms like AWS, Azure, Google Cloud, and Oracle Cloud, it allows teams to track dependencies between applications, services, processes, and underlying cloud or on-prem components, ensuring holistic insights and seamless issue correlation.
OpManager Nexus enables you to monitor the databases hosted on premises, or cloud based databases, ensuring high availability and optimal performance by tracking metrics like resource utilization, active and failed connections, query execution times, blocked queries, and overall health. IT teams can quickly isolate and resolve problematic queries, maintaining seamless communication between applications and associated databases.
In containerized environments, OpManager Nexus monitors Kubernetes clusters, nodes, pods, and persistent volumes, providing a clear view of microservices performance and interactions. It tracks service status, container health, and network connectivity to the host, detecting anomalies in real time and ensuring smooth application delivery.
OpManager Nexus also monitors load balancers to prevent slow response times and service failures. It checks traffic distribution, data path availability, frontend and backend health, and key metrics such as SNAT (Source Network Address Translation) port usage, health probe status, packet counts, and data throughput.
2. Bandwidth management
With NetFlow Analyzer module in OpManager Nexus, organizations can gain deep visibility into network traffic patterns.
The module supports multiple flow technologies including NetFlow, sFlow, IPFIX, J-Flow, and more to provide detailed insights into who’s using the bandwidth, which applications are consuming it, and where potential bottlenecks exist. IT teams can drill down into top talkers, conversations, and protocols, helping them make data-driven decisions for capacity planning and traffic optimization.
With real-time alerts and threshold-based notifications, administrators can also detect unusual traffic spikes or malicious usage before it impacts performance or security.
3. Configuration management
The Network Configuration Manager (NCM) module of OpManager Nexus enables users take configuration backups, gain visibility into all configuration changes made.
OpManager Nexus ensures that all configuration changes are version-controlled and centrally stored. If an error or misconfiguration occurs, administrators can roll back instantly to a previous version. Built-in compliance templates help maintain adherence to industry standards like PCI DSS, HIPAA, or SOX, while configuration change alerts enable proactive response to unauthorized updates.
4. Firewall management
OpManager Nexus enables IT teams monitor firewalls for rule usage, detect anomalies, and optimize policies for better security posture. The tool also generates detailed reports on VPN usage, bandwidth consumption, and user activity, ensuring that administrators stay informed about every access attempt and configuration change.
OpManager Nexus supports multi-vendor environments, providing uniform reporting for firewalls from Cisco, Fortinet, Palo Alto, Check Point, and others.
5. IP address and switch port management (IPAM/SPM)
In hybrid networks, managing IP addresses and switch ports across vast and dynamic environments can be overwhelming. OpManager Nexus integrates robust IP Address Management (IPAM) and Switch Port Mapping (SPM) tools that simplify this process.
The IPAM module automatically discovers subnets and IP addresses, tracking availability, usage, and status in real time. It prevents IP conflicts, assists in capacity planning, and offers detailed reports for better utilization insights. Meanwhile, Switch Port Mapper provides a visual map of devices connected to each port, making it easier to trace endpoints.
AI-powered features in OpManager
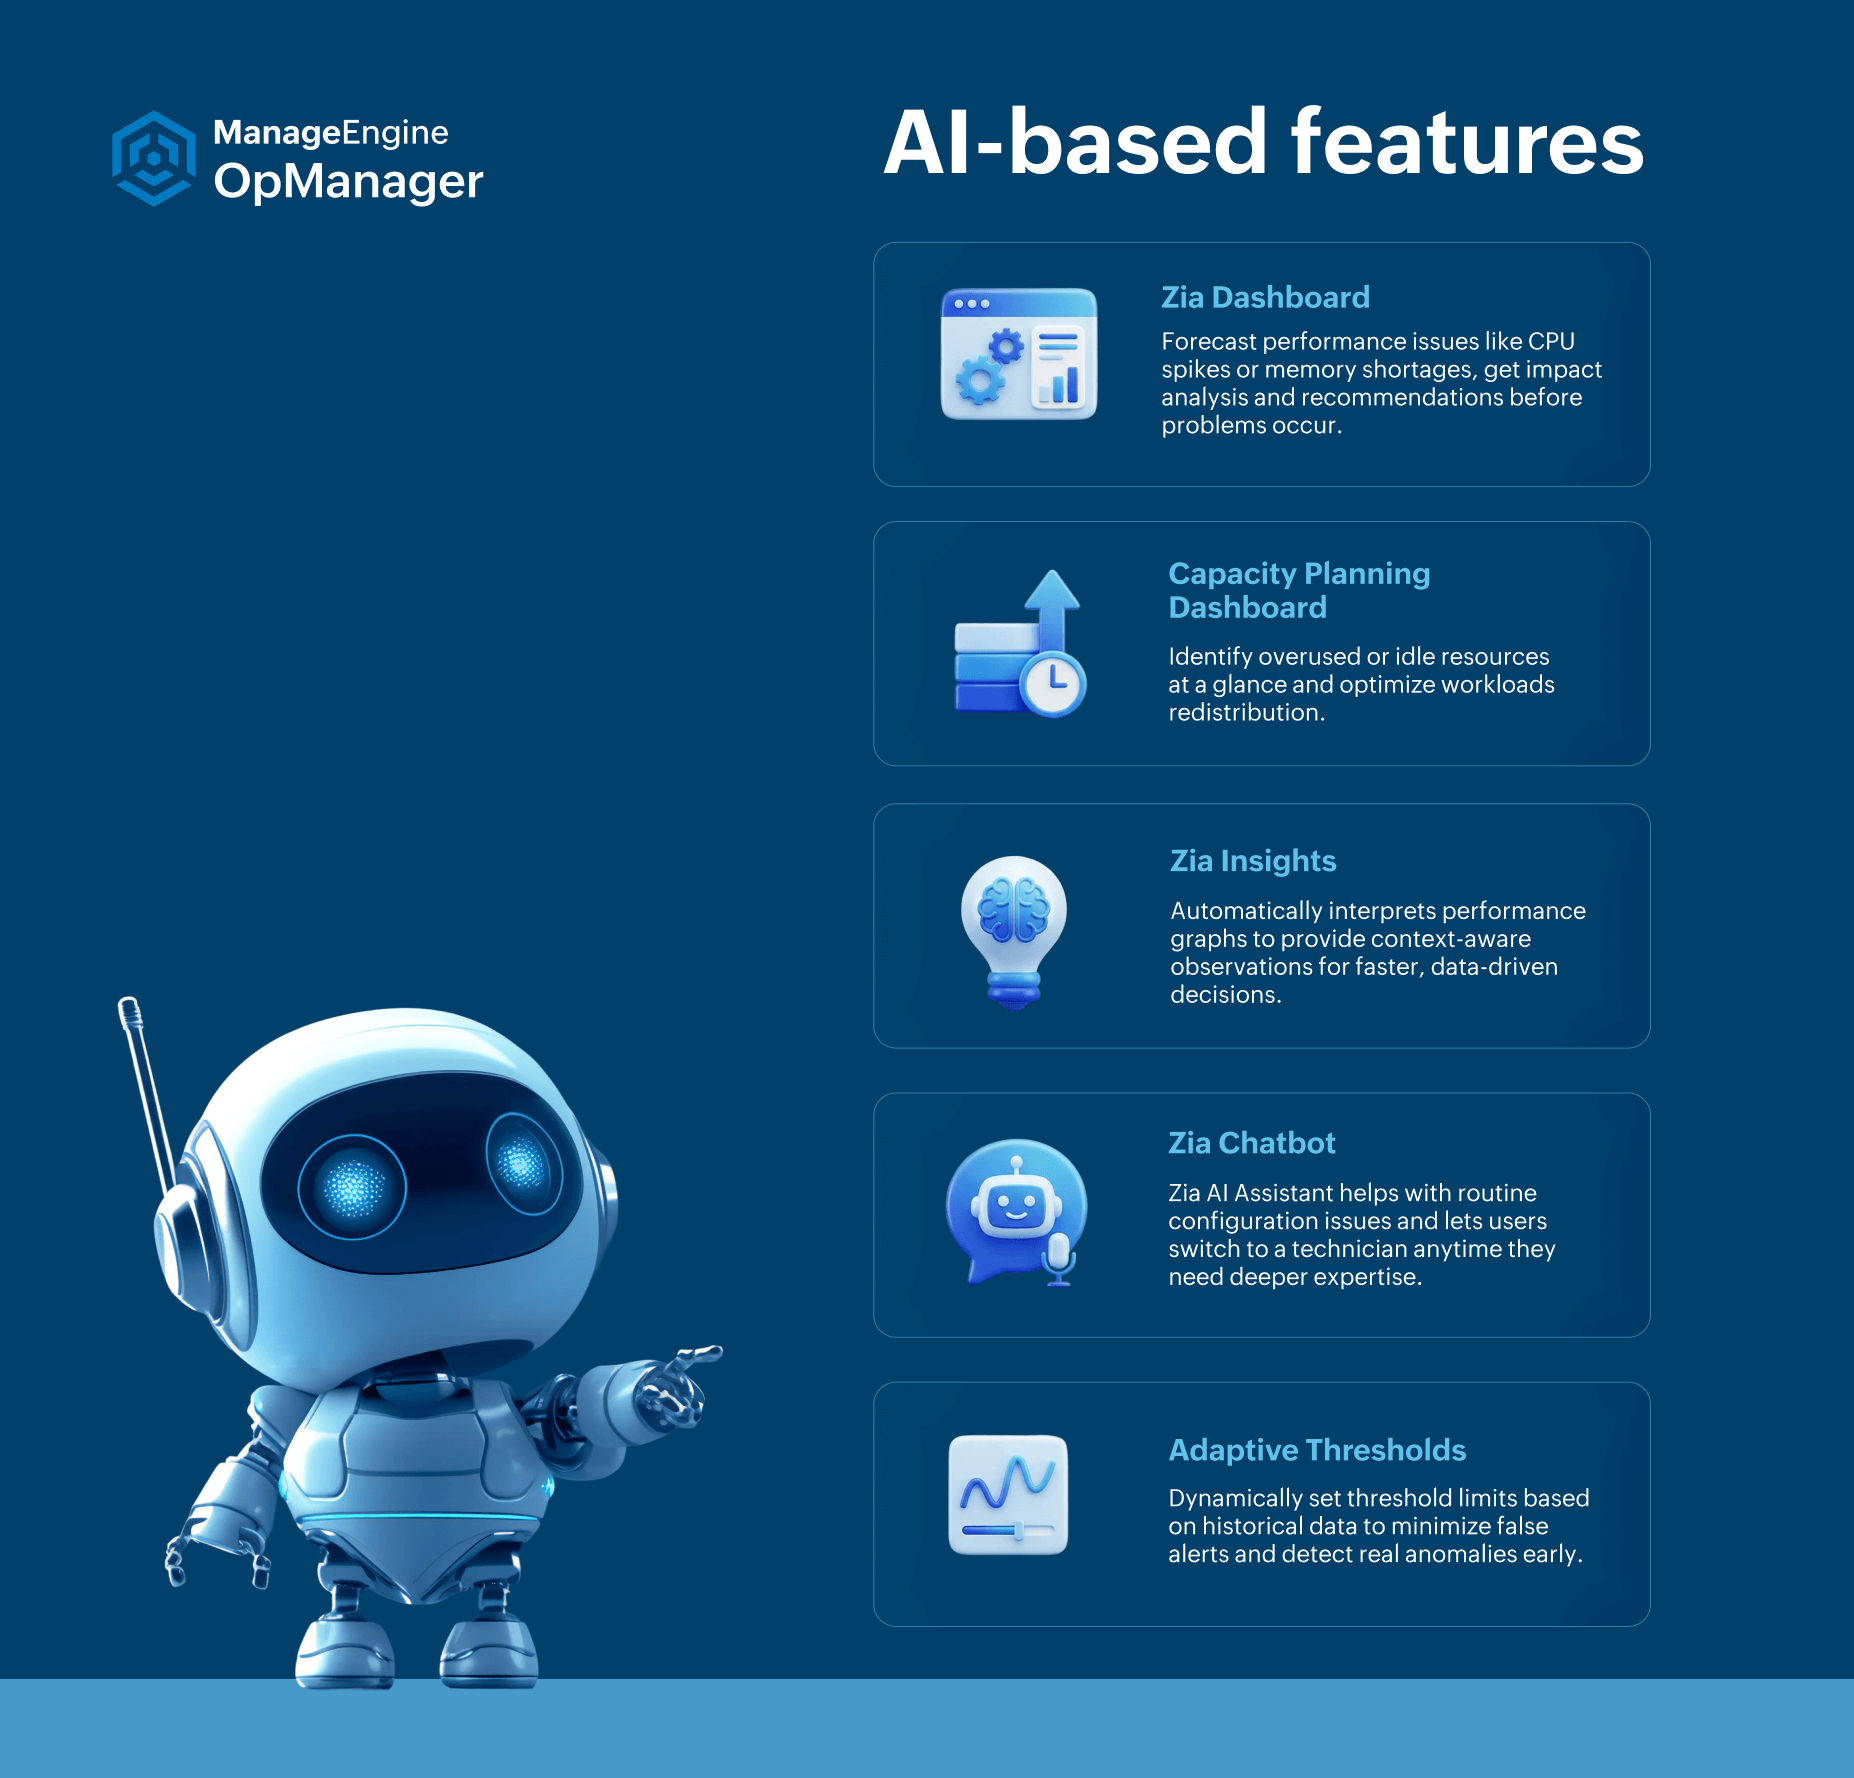
Robust incident response with automation
In large hybrid environments, repetitive operational tasks such as restarting devices, running diagnostic scripts can require significant human effort. The workflow automation feature in OpManager Nexus eliminates manual effort by automating these routine processes.
With its intuitive drag-and-drop builder, IT admins can design custom workflows for a wide range of tasks: device reboots, file transfers, service restarts, or even triggering custom scripts based on alert conditions. Workflows can be scheduled or executed automatically in response to specific events, ensuring faster remediation and consistent operational practices.
Visualization features
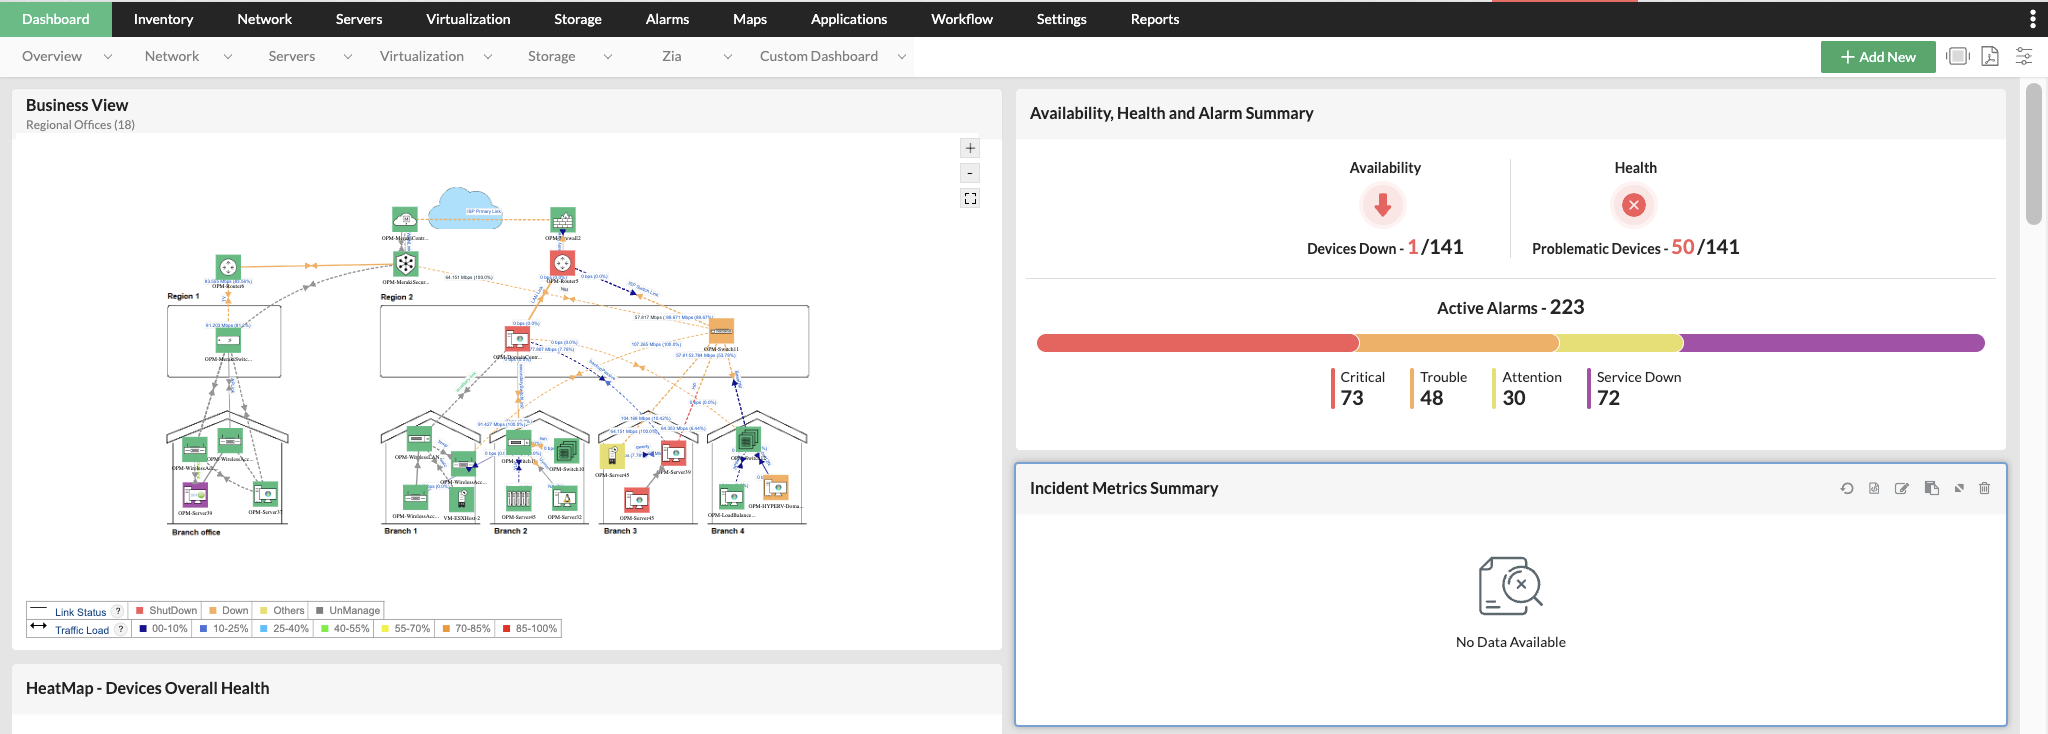
1. Real-time Dashboards
OpManager Nexus offers customizable, real-time dashboards that consolidate key performance metrics from across the infrastructure. Whether it’s network health, bandwidth utilization, server availability, or device alarms, everything is visualized on a single, unified console.
The dashboards also support role-based access, ensuring that network admins, NOC teams, and executives each see the metrics most relevant to them. This instant visibility helps prioritize actions and improves operational efficiency.
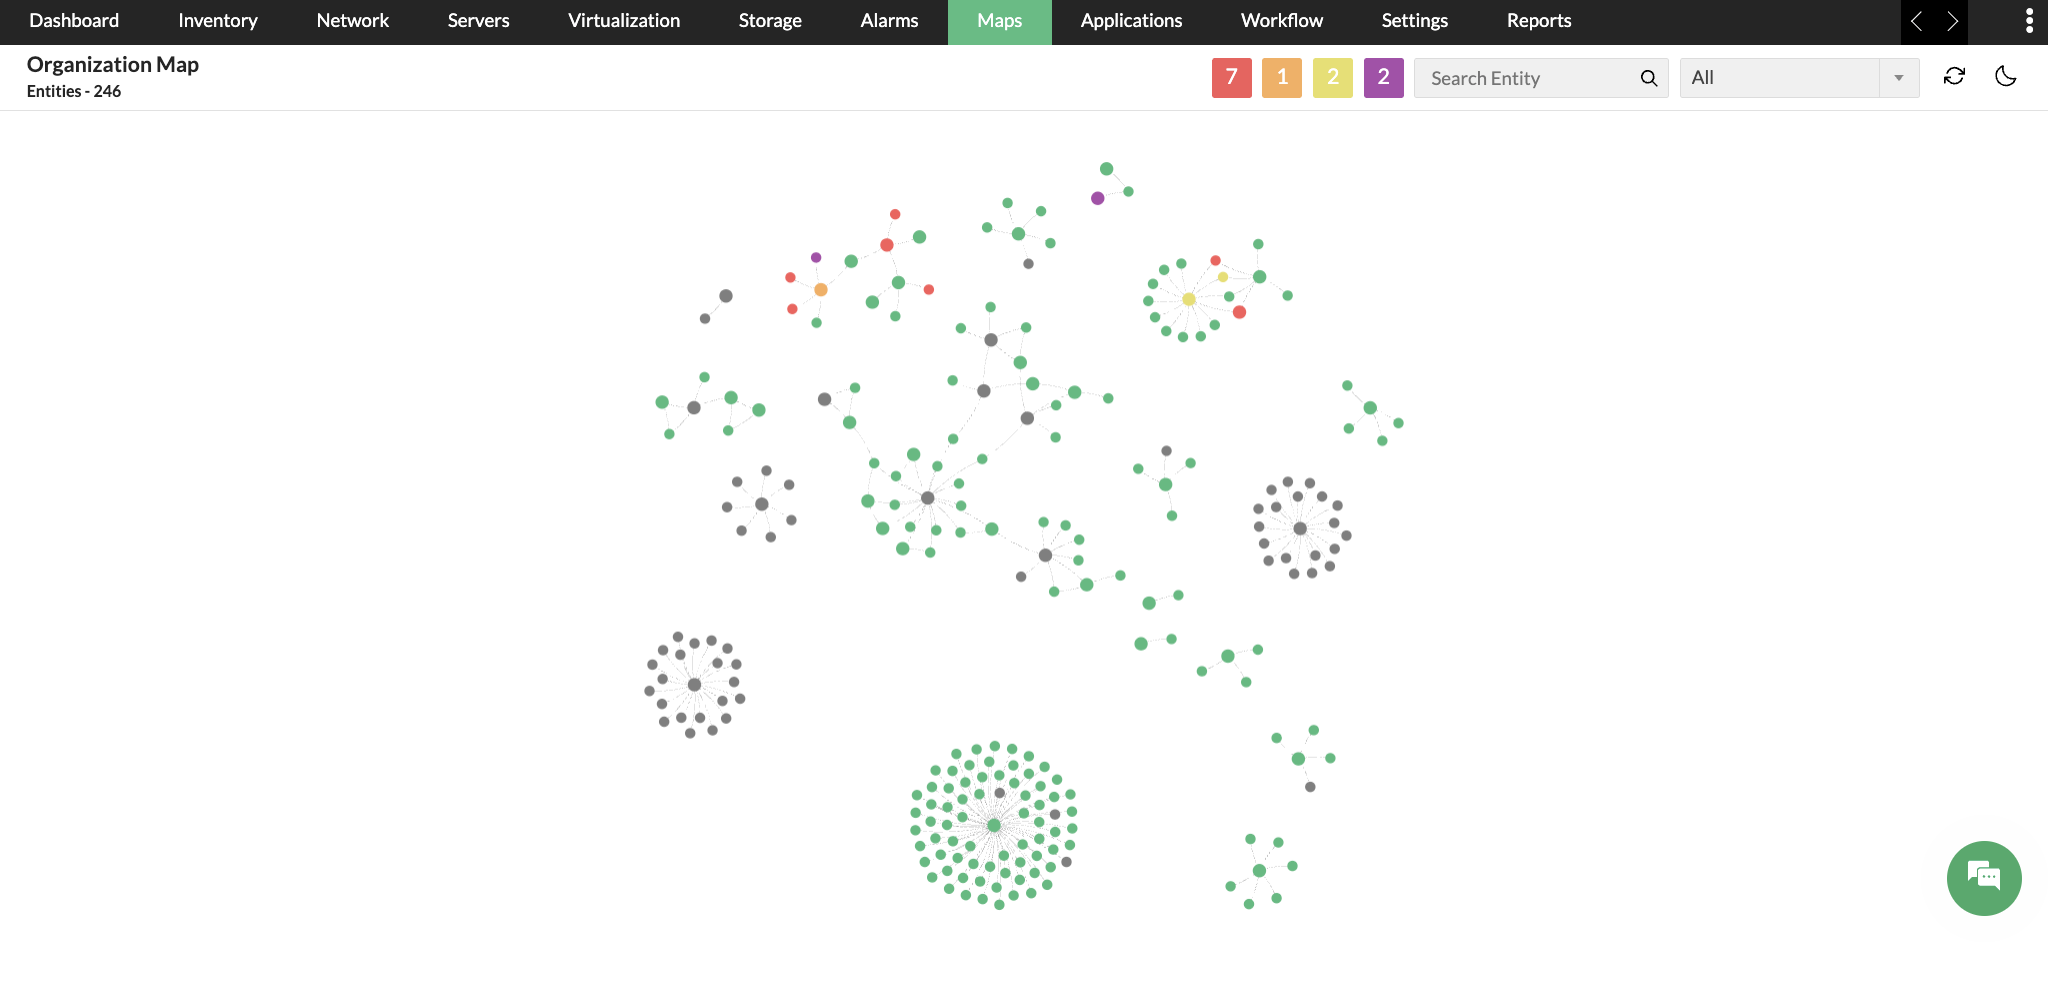
2. Organization Map
OpManager’s Organization Map provides a real-time, interactive view of your entire network, making it easy to understand how everything connects. It visually maps devices, servers, and applications across sites and data centers, giving IT teams a clear picture of network dependencies and relationships. This helps administrators quickly assess the impact of failures or performance issues and troubleshoot problems more efficiently—ensuring smoother, more reliable network operations.
Seamless Integrations for Unified IT Operations
OpManager Nexus integrates effortlessly with over 100+ third-party tools, ensuring smooth interoperability across your IT ecosystem. From ITSM platforms like ServiceNow, Jira, and ManageEngine ServiceDesk Plus to collaboration tools, CMDBs, and notification systems, these integrations help you unify monitoring, management, and response processes without silos.
Additionally, OpManager Nexus provides a robust REST API framework that allows IT teams to connect with any external or custom-built application. Whether you want to push alerts to a third-party dashboard, automate ticket creation, or feed monitoring data into analytics platforms, the flexible API support makes it easy to extend OpManager’s capabilities to fit your specific workflows.
These integrations empower IT teams to centralize visibility, automate cross-platform tasks, and enhance collaboration across departments—ensuring faster resolution and a more streamlined IT operations experience.
Wrapping up!
OpManager Nexus is built to meet the demands of modern hybrid networks, providing comprehensive monitoring and management across on-premises, cloud, and virtual environments. It is a vendor-agnostic software and ensures seamless compatibility with a wide range of devices, cloud/virtualization platforms, thus eliminating the need for multiple tools.
By consolidating network, server, cloud, and application monitoring into a single platform, OpManager Nexus helps organizations reduce tool sprawl, simplify operations, and cut down on licensing and maintenance costs significantly.