Why are network monitoring tools important in 2025?
Before we talk about network monitoring tools and why they matter, let's understand what network monitoring actually is. Networks encompass multiple diverse components from devices like servers, routers, switches to virtual machines and containers deployed in the on-premises and cloud based environments as well.
Much like how your car depends on a healthy engine to run smoothly, your business depends on a well-functioning network to operate seamlessly. So managing this entire network ecosystem is of utmost importance.
What are network monitoring tools?
Network monitoring tools act like your health report card. Just like medical check ups and scans tell you what is wrong with you and also warn you about potential health risks, network monitoring tools reveals existing problems in your network and highlight the vulnerable areas that can cause major problems like an outage in future.
This enables you to fix problem areas, quickly deploy corrective actions to resolve the issues and keep your networks in great health ensuring business continuity.
Benefits of network monitoring tools
Investing in a robust network monitoring tool delivers proven value by ensuring seamless business operations and many other benefits as listed below.
Uninterrupted business continuity
Network monitoring tools are essential for ensuring uninterrupted business continuity by providing deep visibility into network performance and enabling proactive issue detection. By continuously monitoring network health, identifying potential bottlenecks, and preventing premature device failures, these solutions minimize downtime, maintain seamless operations and ensure superior digital experience.
Resource optimization
Server resources like CPU, storage, memory and network bandwidth are critical for your IT infrastructure's smooth and efficient functioning. Network monitoring provides deep visibility into how your resources are being used, enabling you to identify inefficiencies and optimize usage for high performance.
For example, an IT manager of a bank reviews the bandwidth utilization reports and notices a trend that branches with less than ten employees, consume 1/3rd of the bandwidth actually allocated by the ISP. By identifying this trend the bank downsized the bandwidth allocation leading to a significant reduction in costs.
Compliance management
For many organizations, especially those in regulated sectors such as healthcare, BFSI, and government, compliance is non-negotiable. For instance, a leading corporate financial services provider was mandated by central authorities to:
- Report any technical glitch within 15 minutes of detection.
- Limit major technical disruptions to no more than five per year.
Violating such mandates could result in heavy penalties, loss of customer trust, and damage to brand reputation. Each industry or region follows specific compliance standards to ensure data protection, operational resilience, and service continuity.
For instance, HIPAA mandates the protection and secure processing of patient care data for healthcare organizations; GDPR mandates that personal data of European Union (EU) citizens be stored and processed within the EU DCs under strict privacy controls; FIPS sets security requirements for U.S. federal IT systems and cryptographic modules.
Network monitoring tools play a vital role in maintaining compliance by:
- Maintaining detailed network event logs for audits.
- Providing visibility into firmware versions and upgrades, raising alerts on unauthorized modifications, documenting upgrade activities as part of the audit trail.
Network monitoring tools collect and store a wide range of monitoring data, including:
- Device uptime and downtime records to verify service availability.
- Alert and incident history to demonstrate how quickly issues are detected and resolved.
- Access logs to trace user activity and ensure data integrity.
- Configuration changes to track network modifications and prevent unauthorized alterations.
Network security
Network monitoring tools play a crucial role in strengthening an organization’s security posture by continuously analyzing device activity, traffic patterns, and configurations across the network.
They bring abnormal activities to your attention in real time, helping you identify and thwart potential security attacks before they escalate. For example, by monitoring critical servers, you can instantly detect an unusual CPU spike during off-hours or a sudden surge in failed login attempts, both of which may indicate an attempted breach or DDoS attack.
Beyond detecting anomalies, network monitoring tools help enhance network security by:
- Monitoring redundant firewall rules that may open unnecessary access points, reducing exposure to external threats.
- Tracking and providing visibility of the end-of-life (EOL) or end-of-support (EOS) status for devices across network to identify outdated or unsupported hardware is replaced before it becomes a vulnerability.
- Performing vulnerability checks on firmware to detect outdated versions that could be exploited.
- Monitoring network traffic to spot anomalies such as unusual data transfers or bandwidth usage.
- Identifying rogue devices that connect to the network without authorization.
ManageEngine OpManager: Your one-stop-solution to all your network monitoring needs
OpManager is a robust network monitoring tool that enables you to monitor network health in real time, receive proactive alerts on potential issues, and improve operational efficiency and accelerate incident response through automation.
It acts as an extended arm of your IT team, helping them resolve issues faster, operate more efficiently, and ensure uninterrupted business service delivery. It enables organizations to discover quickly, monitor, and manage network devices, ensuring performance, availability, and security across complex and distributed environments.
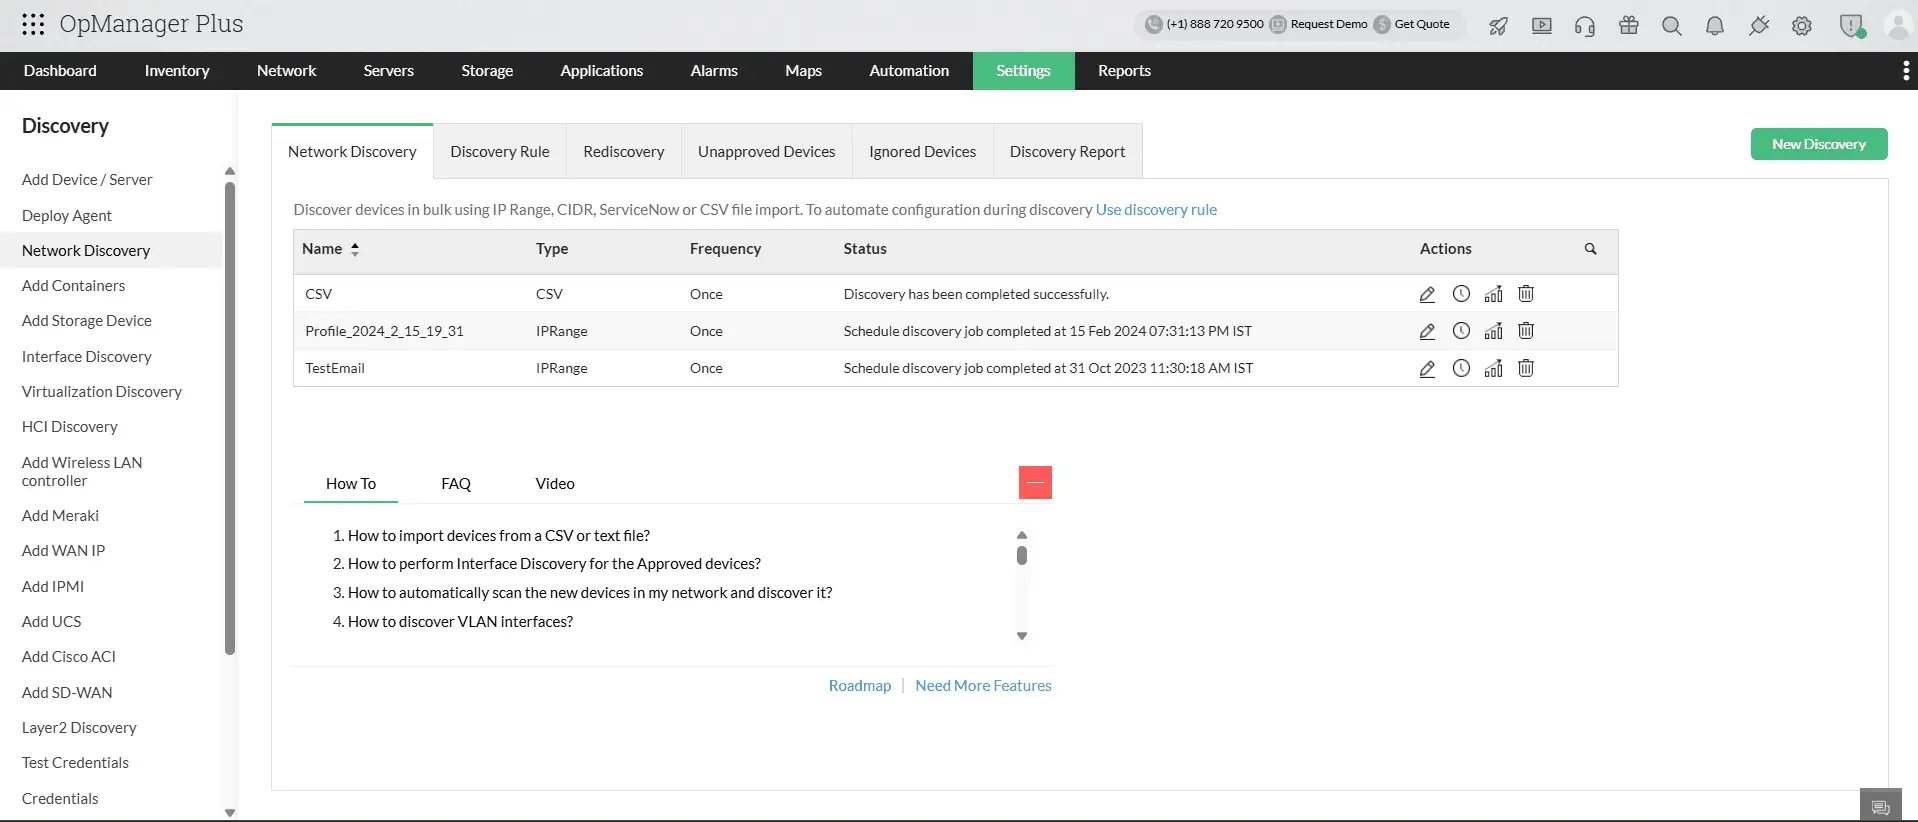
Auto-discover your entire network with a robust discovery process
OpManager simplifies device onboarding and monitoring through its comprehensive network discovery capabilities . It supports a wide range of devices with over 11,000 prebuilt device templates, ensuring seamless compatibility across vendors and technologies. Devices can be discovered by specifying an IP range or by importing details from Active Directory, CSV files, or virtualization platforms. Once discovered, they are automatically added to the inventory, providing centralized visibility and streamlined management of your network infrastructure.
With the Discovery Schedule option, OpManager performs automated, recurring scans to ensure all devices and interfaces are accurately detected and updated.
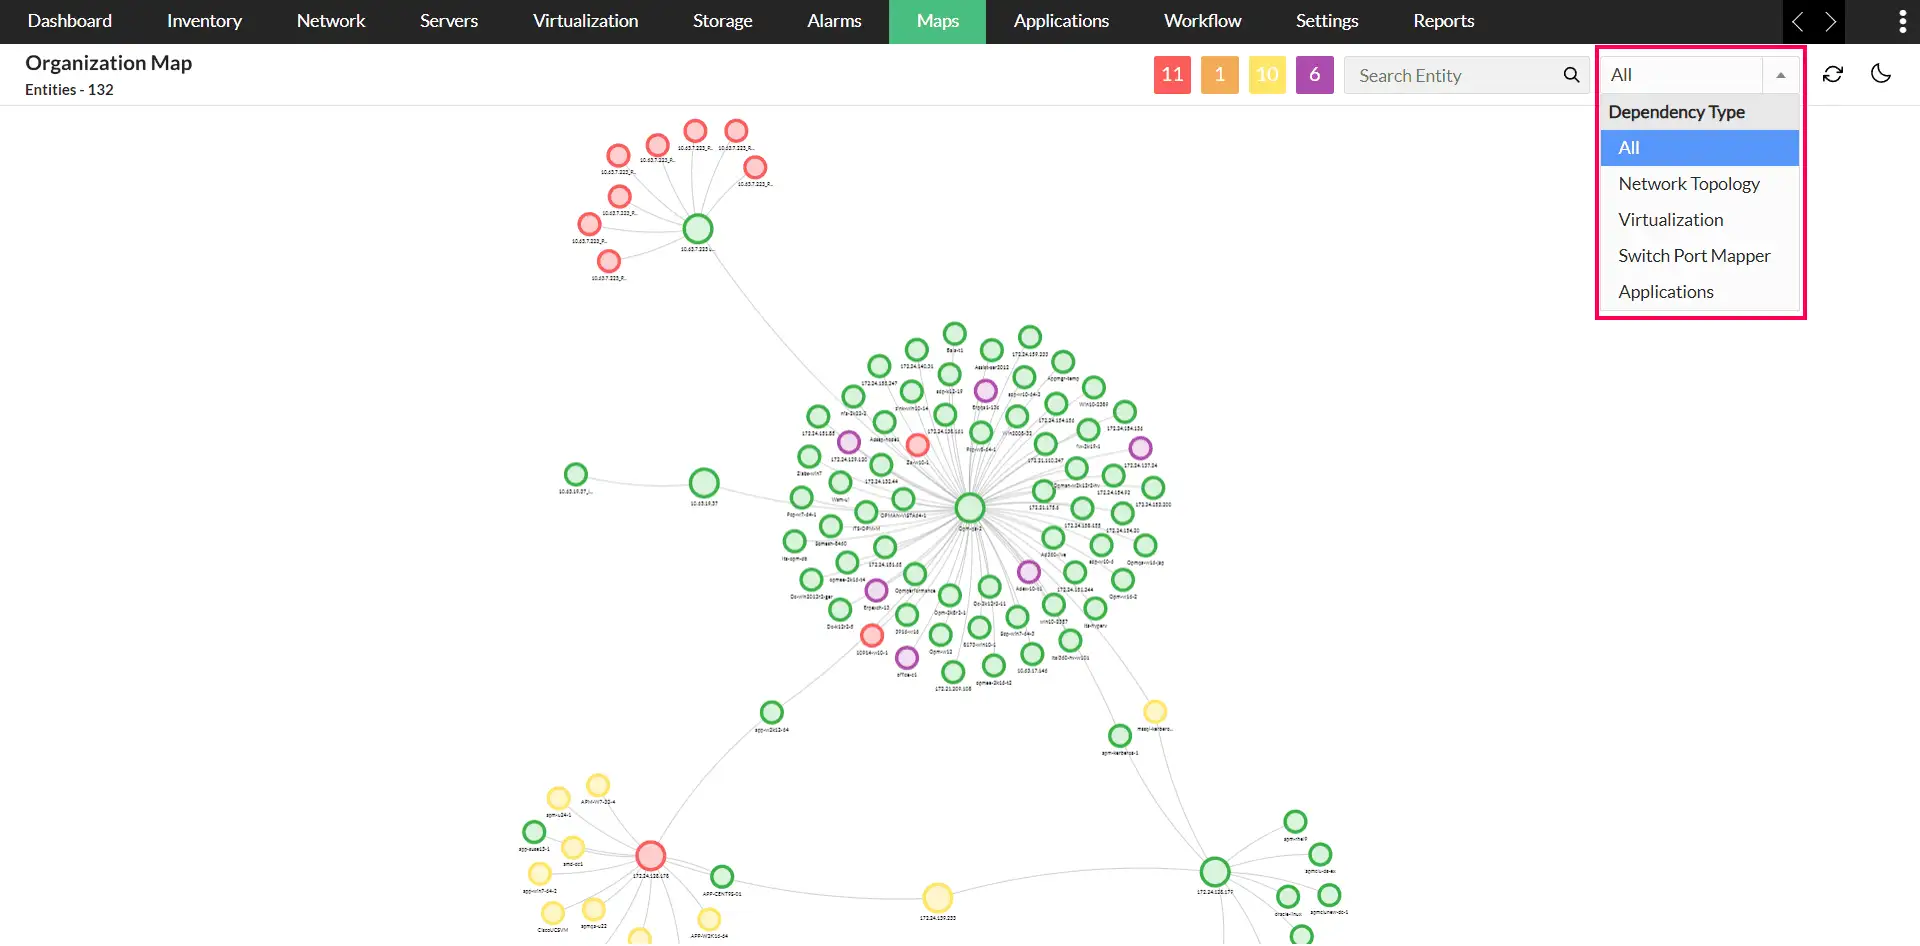
Map your network topology with Organization Map
Understanding your network’s structure is crucial for effective management, and OpManager’s Organization Map makes this effortless. The map visually represents your entire network topology showing how devices, servers, and applications interconnect across sites and data centers. This visualization helps IT teams quickly identify dependencies between workloads and their underlying infrastructure, making it easier to assess the impact of a failure or performance degradation.
With the organization map, administrators gain a clear, real-time view of network relationships, troubleshoot issues more efficiently.
Level up monitoring with AI-powered features
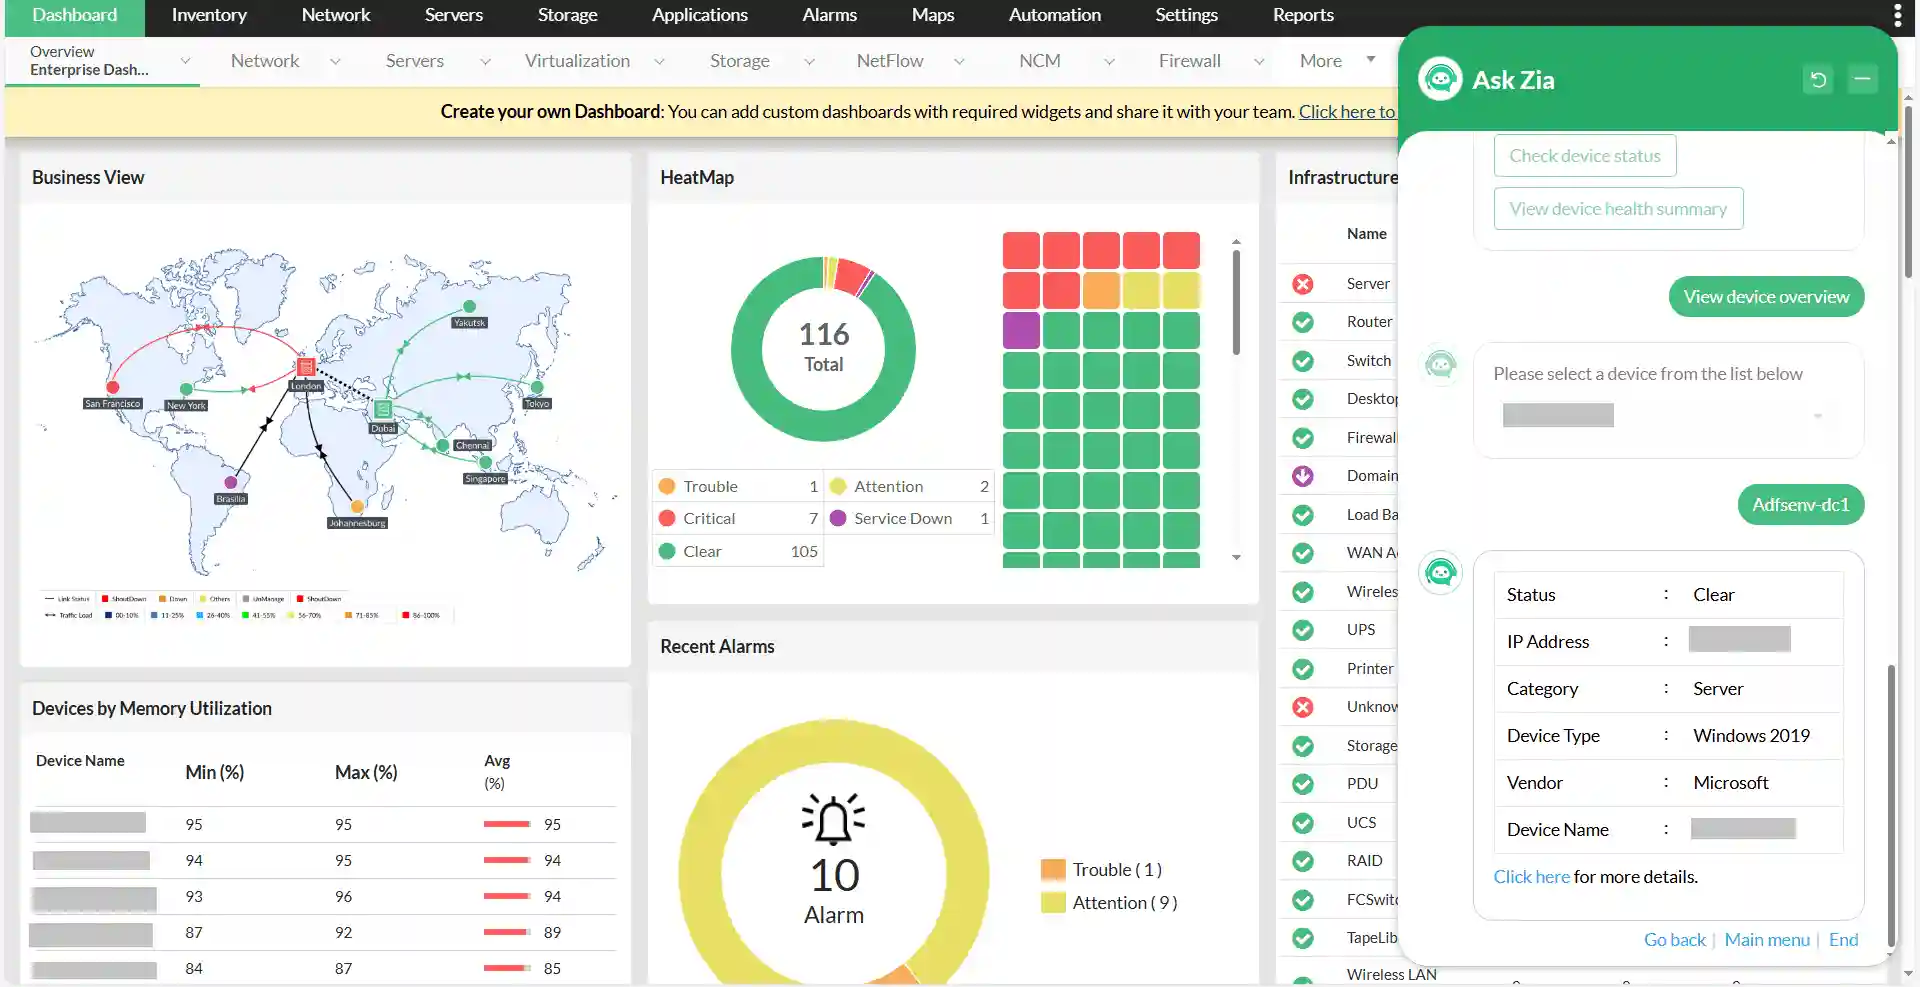
Zia features
OpManager leverages our in-house AI assistant, Zia, to bring intelligence into IT monitoring. The Zia Dashboard analyzes historical data and forecasts potential issues—such as CPU spikes or disk exhaustion—well before they affect performance. It not only predicts resource utilization trends but also provides actionable insights and impact analysis, helping teams take proactive measures to prevent downtime.
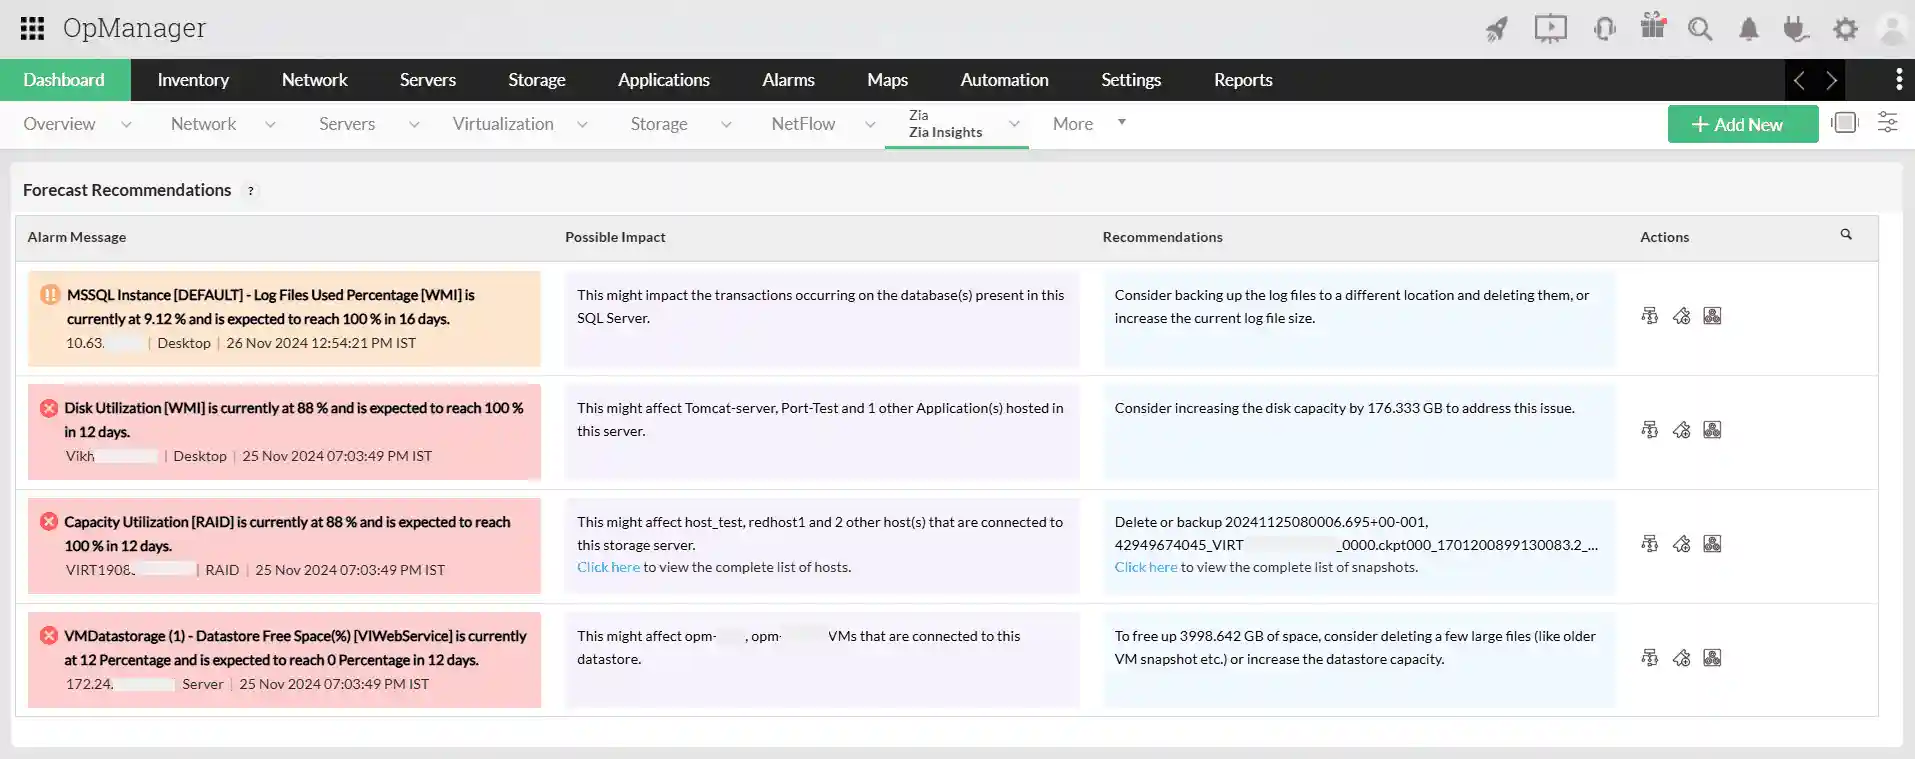
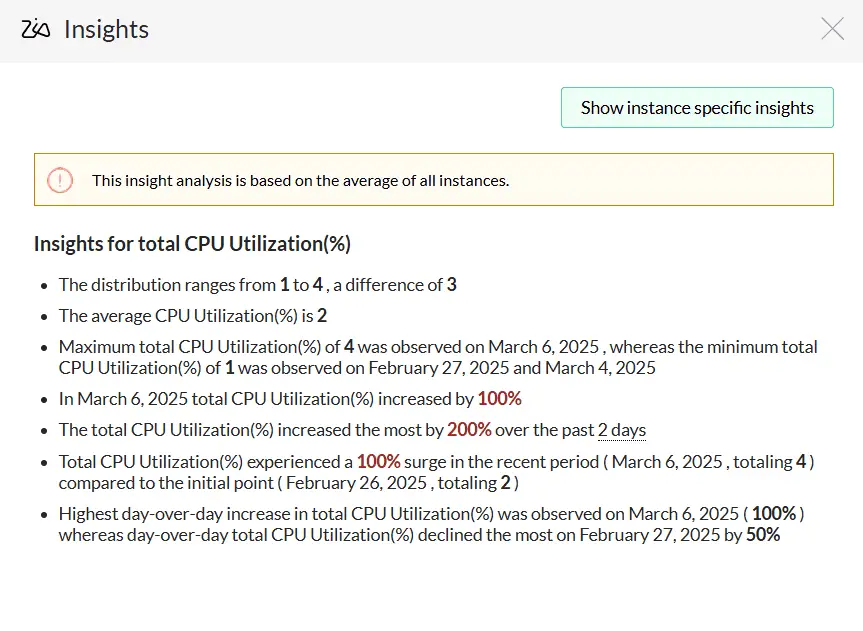
The Capacity Planning Dashboard, built with the data from Capacity Planning Reports, gives IT teams a clear, data-driven view into the overutilized, underutilized, and idle resources, helping quickly assess infrastructure health. The dashboard includes forecast alerts that warn of potential capacity breaches and provide actionable suggestions such as upgrading, redistributing workloads, or retiring unused assets. With Zia Insights, IT teams can derive context-aware observations directly from performance graphs.
The Zia Chatbot further enhances operational efficiency by offering conversational access to network information. Using predefined prompts, users can execute actions such as ping and traceroute, retrieve device status, or get quick performance summaries—all within seconds.
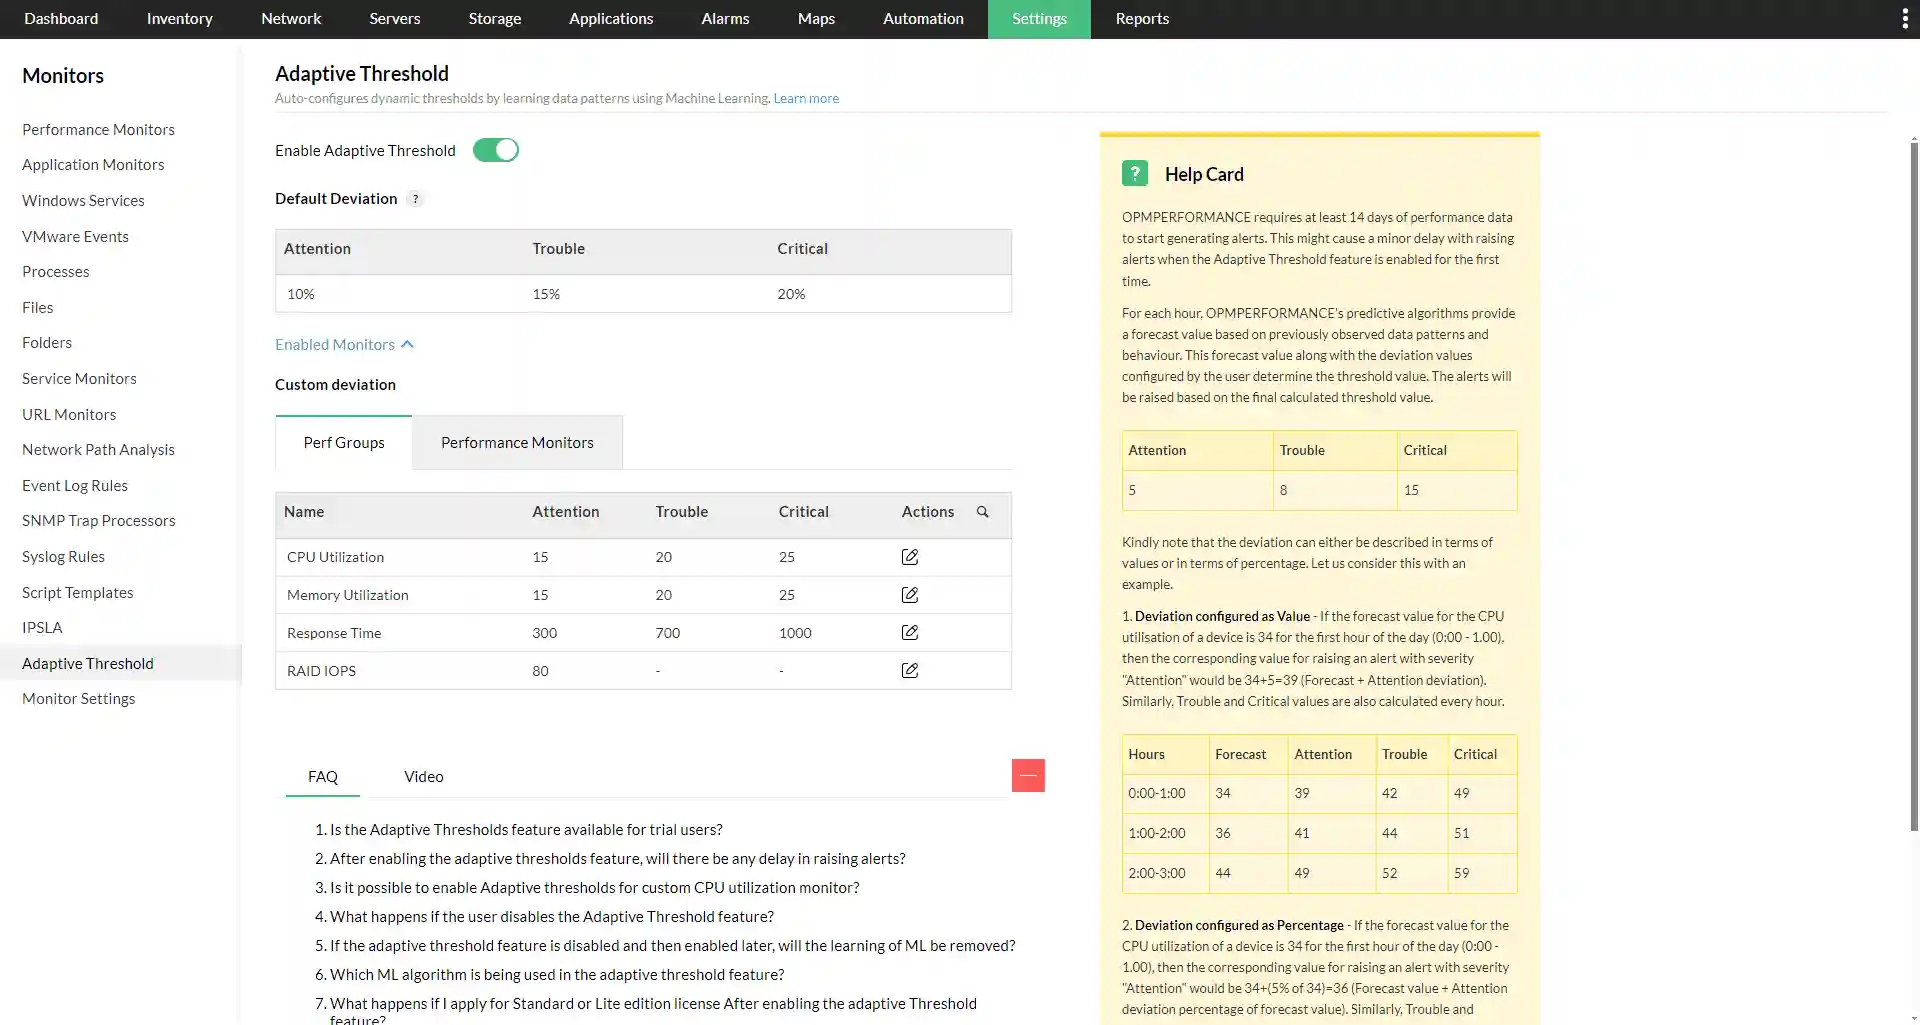
ML based threshold configuration
Adaptive Thresholds in OpManager use machine learning to automatically set dynamic performance thresholds for devices based on historical usage patterns. Instead of relying on static, predefined limits, adaptive thresholds learn normal behavior over time and adjust alert levels accordingly. This helps IT teams reduce false alarms, detect genuine anomalies faster, and respond proactively to potential issues before they impact network performance, ensuring more accurate monitoring and smarter resource management.
Accelerate troubleshooting with automation
The Workflow Automation feature allows teams to automate repetitive IT tasks with a simple drag-and-drop interface. Administrators can build custom workflows to perform actions like restarting services, clearing logs, or triggering scripts automatically when certain conditions are met. By automating routine operations, IT teams can focus on more strategic tasks, reducing manual effort, human error, and downtime.
Leverage Ansible Integration to enhance efficiency
Users can leverage the integration of OpManager with Ansible to improve incident response and overall IT efficiency. Alerts and events from OpManager can trigger Ansible playbooks to automatically remediate issues, reducing human intervention and minimizing errors. For example, if multiple routers experience performance issues, Ansible can execute predefined tasks to check configurations, update settings, or restart services automatically.
The integration also simplifies large-scale deployments: when new devices are added, teams can maintain an inventory in Ansible and use playbooks to configure, validate, and enforce compliance across all devices. By connecting real-time monitoring with automated actions, OpManager and Ansible together streamline workflows, accelerate problem resolution, and ensure consistent, reliable IT operations.
Visualize your network infrastructure with Dashboards
OpManager’s Dashboards provide a complete, real-time view of your IT environment from a single console. With customizable widgets, users can track key performance indicators such as recent alarms, devices sorted by CPU or memory usage, interface traffic, and more. These dashboards give NOC teams a bird’s-eye view of network health, helping them spot abnormalities instantly and take immediate action.
Seamless integrations with in-house and external applications
OpManager supports 100+ integrations with both ManageEngine and other third party applications. Among the integrations, IT Service Management (ITSM) integrations are particularly valuable. By integrating with ITSM platforms like ServiceDesk Plus (SDP), Jira, or ServiceNow, OpManager can sync and track tickets for network alerts and incidents, ensuring faster response and improved service continuity.
Key benefits of integrating with ManageEngine SDP include:
1 Automatic CMDB updates: OpManager continuously scans your network to discover new devices, update existing ones, and remove decommissioned assets from its inventory. With its integration with ServiceDesk Plus, any device addition, modification, or deletion in OpManager is instantly reflected in the CMDB.
This real-time synchronization ensures your configuration data remains accurate and up to date always, eliminating manual updates.
2 Easier ticket management :
With bi-directional asset sync option any changes in alert parameters on OpManager—such as severity updates—are automatically reflected in the corresponding ticket in ServiceDesk Plus. Moreover, when an alert is cleared in OpManager, the associated ticket is automatically closed in ServiceDesk Plus, and vice versa. In addition, tickets can be reopened automatically if an issue reoccurs, ensuring continuous visibility and seamless coordination between monitoring and incident management.
Interested in our solution? Get a free personalized demo! Or Try OpManager and get a first hand experience of our solution.
Frequently asked questions
1. What are the various protocols used for network monitoring?
Common protocols include SNMP (Simple Network Management Protocol) for device monitoring, ICMP (ping/traceroute) for connectivity checks, NetFlow/sFlow for traffic analysis, and WMI/SSH for monitoring servers and applications.