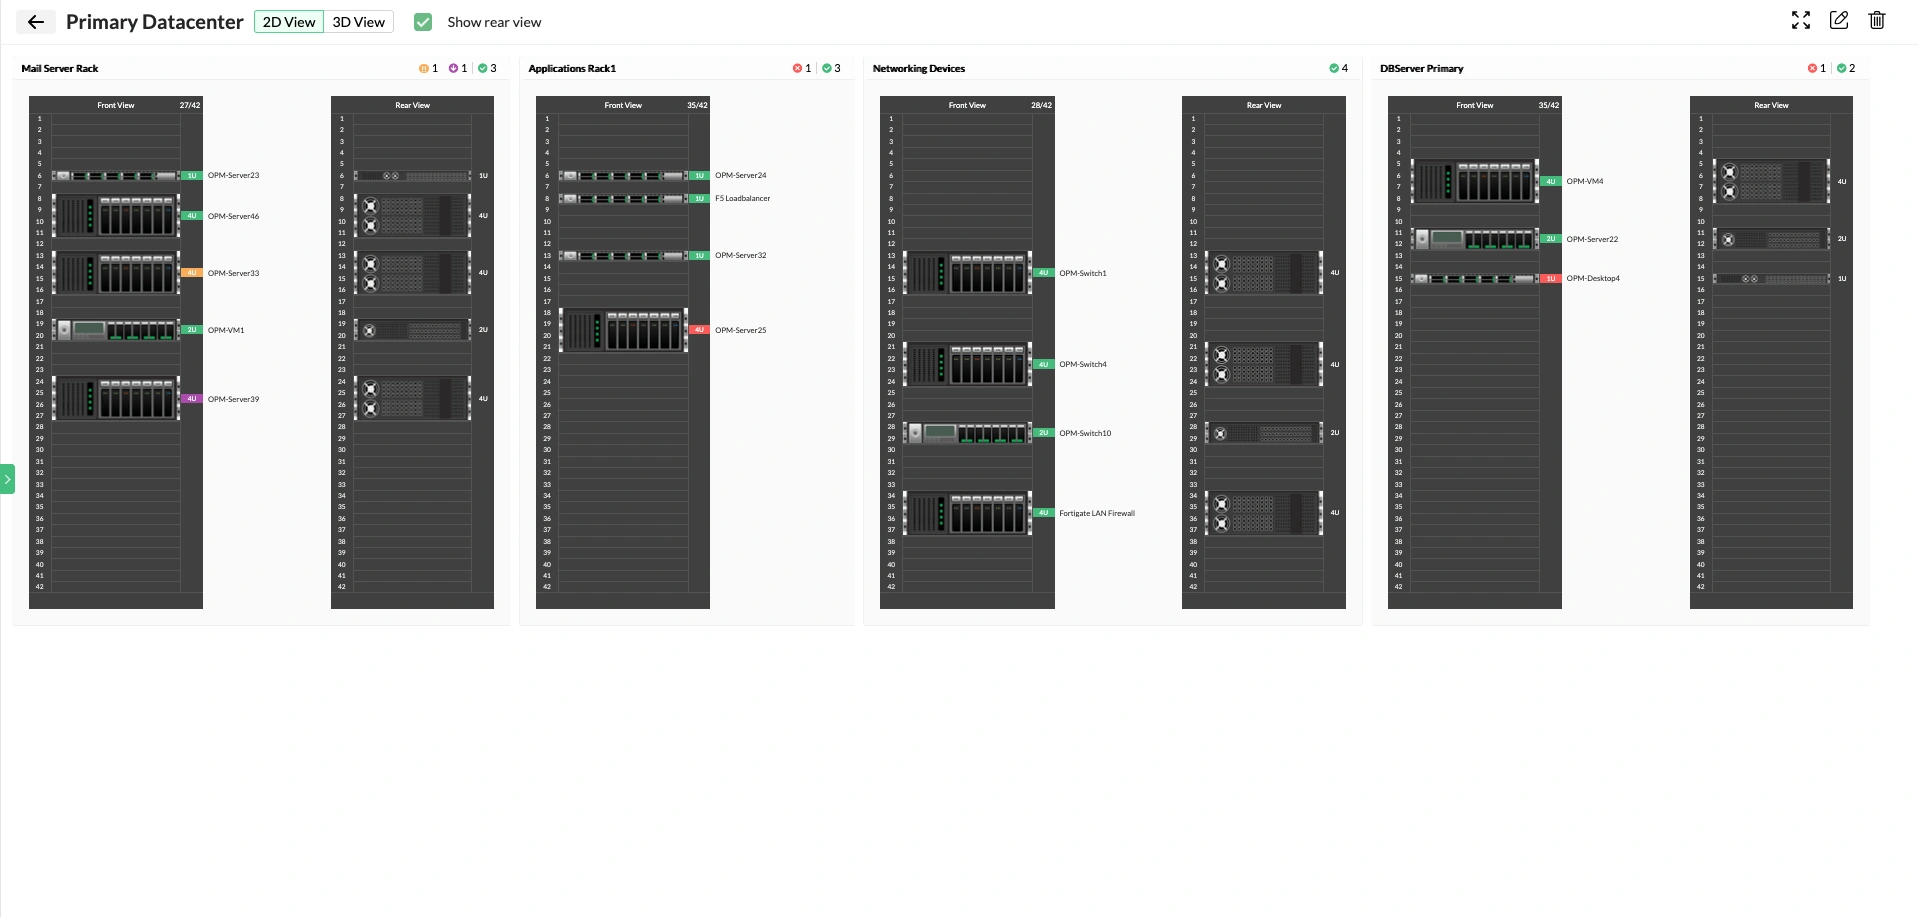
Datacenters are at the heart of operation for any enterprise that utilizes an IT infrastructure. They essentially host business applications and storage space for the entire business network. Data centers might be anything from just a single rack with a couple of servers, to those spanning across cities or even countries. Real-time data center monitoring becomes paramount when organizations want to ensure low downtime and improve the overall performance of their data center. However, there are several vital aspects to be monitored, which becomes virtually impossible as the size of the data center increases. Hence, a proper data center monitoring tool has to be deployed.

To ensure the best performance from your data center, it is crucial to implement data center performance monitoring based on three important parameters - network connectivity, server performance, and storage performance. The main setback admins face while executing this is the lack of an integrated data center monitoring solution that provides you visibility over all these three aspects.

ManageEngine OpManager: The ideal data center monitoring solution

ManageEngine OpManager helps you manage and monitor all the different aspects of your data center's performance, all from a unified console. By monitoring critical performance metrics of your data center in real time, OpManager functions as a complete data center monitoring system and enables you to maintain your data center resources at their peak performance levels.

Monitoring switches and routers for datacenter connectivity 

To begin with, data center monitoring solutions help monitor all network paths to and from the data center and ensure that all devices related to network connectivity are performing well. This primarily includes network switches and routers, followed by security devices like firewalls.

Datacenter monitoring - ManageEngine OpManager

OpManager monitors the health and performance of your switches and routers in real-time and alerts you if something goes wrong with your devices. Along with the regular alerts displayed in the web client, you can also configure OpManager's data center management software to intimate you over other media like texts or emails, making it more than just a regular data center monitoring tool. This is to ensure you don't miss out on these alerts, and that you're aware of the status of your devices at all times.

Monitor critical server metrics in your data center

On discovering your datacenter's network resources, OpManager's data center monitor automatically associates performance monitors based on your device type and starts monitoring them. You can monitor both physical and virtual servers in your data center, using SNMP/WMI/CLI protocols to fetch performance data from your devices.

Datacenter server monitoring - ManageEngine OpManager

You can even use multiple credential profiles to monitor your virtual servers intensively. For example, VMware API can only fetch a certain amount of performance data from your VM. Now, if the VM hosted is a Linux server, you can apply the suitable CLI credential over the VMware credentials to fetch additional metrics that are otherwise not accessible using just VMware API. You can apply suitable credential profiles whenever it is required; either during discovery itself or even after discovery. Other than the default monitors in OpManager, you can also set up custom monitors for your devices either using SNMP or WMI to monitor device metrics of your choice.

Monitor datacenter related hardware metrics 

One aspect data center admins find difficult is monitoring hardware metrics along with other performance data. This becomes especially tough when separate tools have to be used to monitor the hardware.

Datacenter hardware monitoring - ManageEngine OpManager

With OpManager's data center monitoring system, you can also monitor the hardware metrics of your devices from inside the web client itself. The Hardware tab in your Device Snapshot page lists all the hardware metrics from that device and their status. Alarms related to hardware are also displayed on the same page, making it easy for you to know everything about your device's hardware at a glance while monitoring the data center.


Real-time threshold-based monitoring

OpManager's data center monitor allows you to set thresholds for your performance monitors, enabling you to easily detect variations in the performance of your data center devices. There are three levels of alerts - Attention, Trouble, and Critical, to convey the criticality of the issue in the alert itself. The alerts are raised in the product's web client, where you can see all details on the issue and immediately take measures to resolve it.

Real-time Datacenter monitoring - ManageEngine OpManager

Dashboards - an all-in-one data center monitoring tool

OpManager's data center monitoring capabilities let you create dedicated dashboards to view all the information you need about your network in a single pane. You can use existing/default dashboards available as a base and improve the details in it, or you can create a new dashboard from scratch with all the widgets that you would need to know about your data center's health and performance. Monitor the data center effectively with OpManager, which also has a dedicated "Real-time dashboard" that helps you view the performance stats of your network devices in real-time.

Datacenter Performance dashboard - ManageEngine OpManager
Datacenter Monitoring - ManageEngine OpManager


Also, when it comes to data center monitoring, it must be made sure that the admin is always updated with the latest performance data of the network so that any performance issues detected can be instantly resolved. OpManager's CCTV views help you achieve it, by allowing you to create NOC views that refresh at a user-defined interval. That way, you can be sure that the performance data being displayed is up-to-the-minute.

Visualize your data center infrastructure using Racks and 3D views

When there is a large amount of data to be constantly monitored, there is an increased chance of data being misinterpreted or missed due to human error, which could translate to disaster in data center monitoring services. Visualizing the available network infrastructure is a great way to know the overall status of the resources at a glance.

Real-time Datacenter visualization - ManageEngine OpManager

With OpManager's set of datacenter monitoring tools, you can create 3D views of your data center to easily understand your network infrastructure. You can begin with creating Rack views to create a virtual representation of the arrangement of servers in individual racks, followed by placing those racks on the floor in the 3D floor view. The status of each server on the rack is displayed right next to it using OpManager's default color codes, making it a breeze to see the status of your servers and racks. This feature makes it possible to get a visual idea of the status of your data center, instead of just displaying numbers and stats like any other data center monitoring software.

Detailed reports to understand overall data center performance

OpManager's reports help you to understand the bigger picture about the performance of your data center. You can view historical data on the performance of your data center's devices under four wide categories - Performance, Availability, Response Time & Packet Loss, and Inventory. You can select the devices based on Groups or Business Views and even schedule the reports to be sent to recipients of your choice, at a particular interval.

Datacenter reporting - ManageEngine OpManager

Monitor data center's other critical devices 

With OpManager's add-ons, you can make sure that you're extensively monitoring all aspects of your data center, network-wise. OpManager has exclusive add-ons for firewall log management, network flow analysis, applications management and monitoring, network configuration management and monitoring, and so on. This way, you can also monitor secondary devices such as firewalls, security devices, or switches, thereby ensuring the overall health and performance of your data center.

Datacenter device monitoring - ManageEngine OpManager

Ensure effective server management with OpManager's datacenter monitoring.

Download 30-day free trial

Customer reviews

OpManager
OpManager - 10 Steps Ahead Of The Competition, One Step Away From Being Unequalled.
- Network Services Manager, Government Organization
Review Role: Infrastructure and OperationsCompany Size: Gov't/PS/ED 5,000 - 50,000 Employees
"I have a long-standing relationship with ManageEngine. OpManager has always missed one or two features that would make it truly the best tool on the market, but over it is the most comprehensive and easy to use the product on the market."
OpManager
Easy Implementation, Excellent Support & Lower Cost Tool
- Team Lead, IT Service Industry
Review Role: Infrastructure and OperationsCompany Size: 500M - 1B USD
"We have been using OpManager since 2011 and our overall experience has been excellent. The tool plays a vital role in providing the value to our organisation and to the customers we are supporting. The support is excellent and staff takes full responsibilities in resolving the issues. Innovation is never stopping and clearly visible with newer versions"
OpManager
Easy Implementation With A Feature Rich Catalogue, Support Has Some Room For Improvement
- NOC Manager in IT Service Industry
Review Role: Program and Portfolio ManagementCompany Size: 500M - 1B USD
"The vendor has been supporting during the implementation & POC phases providing trial licenses. Feature requests and feedback is usually acted upon swiftly. There was sufficient vendor support during the implementation phase. After deployment, the support is more than adequate, where the vendor could make some improvements."
OpManager
Great Monitoring Tool
- CIO in Finance Industry
Review Role: CIOCompany Size: 1B - 3B USD
"Manage Engine provides a suite of tools that have made improvements to the availability of our internal applications. From monitoring, management and alerting, we have been able to peak performance within our data center."
OpManager
Simple Implementation, Easy To Use. Very Intuitive.
- Principal Engineer in IT Services
Review Role: Enterprise Architecture and Technology InnovationCompany Size: 250M - 500M USD
"Manage Engine support was helpful and responsive to all our queries"


Case Studies - OpManager

OpManager

Hinduja Global Solutions saves $3 million a year using OpManager

Industry: IT

Hinduja Global Solutions (HGS) is an Indian business process management (BPM) organization headquartered in Bangalore and part of the Hinduja Group. HGS combines technology-powered automation, analytics, and digital services focusing on back office proces

Learn more

OpManager

USA-Based Healthcare Organization Monitor's Network Devices Using OpManager and Network Configuration Manager

Industry: Healthcare

One of the largest radiology groups in the nation, with a team of more than 200 board-certified radiologists, provides more than 50 hospital and specialty clinic partners with on-site radiology coverage and interpretations.

Learn more

OpManager

Netherlands-based real estate data company avoids system downtime using OpManager and Firewall Analyzer

Industry: Real Estate

Vabi is a Netherlands-based company that provides "real estate data in order, for everyone." Since 1972, the company has focused on making software that calculates the performance of buildings. It has since then widened its scope from making calculations

Learn more

OpManager

Global news and media company

Industry: Telecommunication and Media

Bonita uses OpManager to monitor their network infrastructure and clear bottlenecks

Learn more

OpManager

Bonita

Industry: Businesses and Services

Bonita uses OpManager to monitor their network infrastructure and clear bottlenecks

Learn more

OpManager

Thorp Reed & Armstrong

Industry : Government

Randy S. Hollaway from Thorp Reed & Armstrong relies on OpManager for prompt alerts and reports

Learn more


 Pricing  Get Quote