RCA Profile: A step by step guide
The root cause analysis (RCA) feature in OpManager enables you to visualize monitoring data of multiple entities such as devices, interfaces and URLs in a centralized window. This helps you to understand performance deeply and identify the exact trigger points of network issues quickly.
Creation of a new RCA Profile
There are three ways of creating a RCA Profile in OpManager. You can,
- Create a global RCA Profile
- Create a RCA Profile with the alarm data
- Create a RCA Profile for a group (of devices/interfaces)
Using this option, you can create a new RCA Profile for your network devices, interfaces and URLs.
- Navigate to Alarms -- Root cause analysis.
- Click on Create RCA Profile.
- Select the module: Devices, URLs, Groups (Please note you can create a RCA Profile for interfaces after you create an interface group. The created interface groups will be listed and you can select one.)
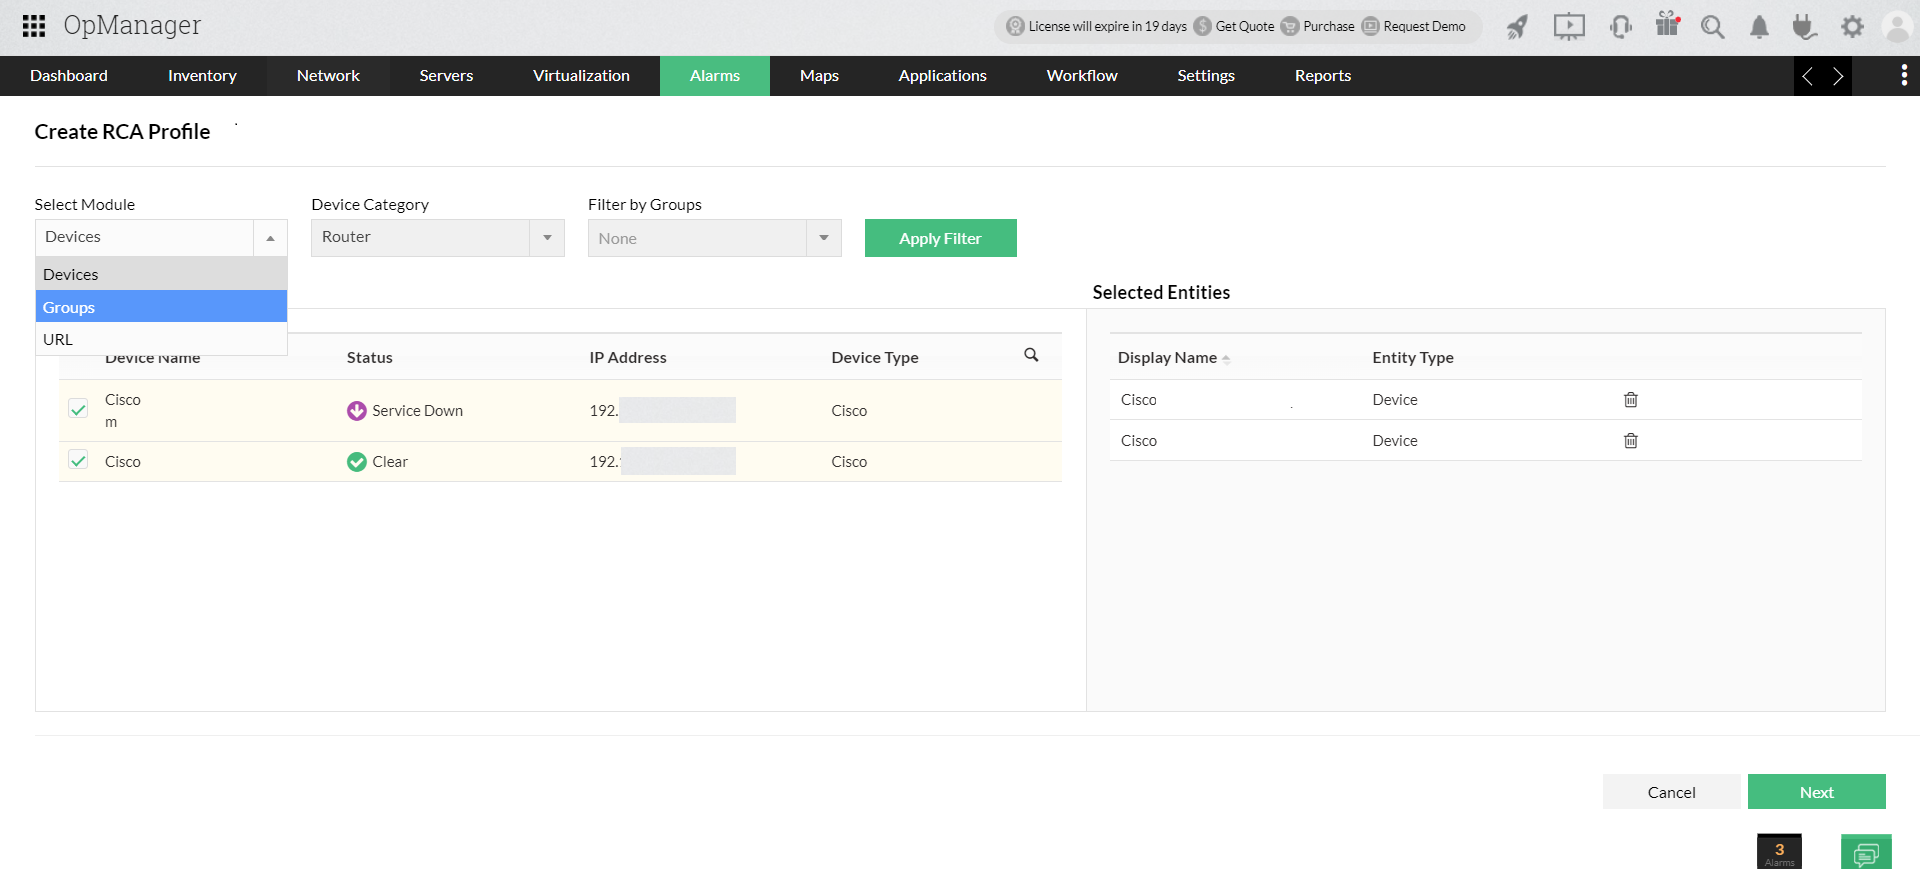
- Once you choose the module, you can find the entities listed under Available Entities.
- Check the box to move an entity from the Available Entities window to the Selected Entities window.
- Click on Next to create a RCA Profile.
Note: You can create a RCA Profile for multiple entities from different modules. That is you can perform RCA for a combination of a set of devices, interfaces and URLs.
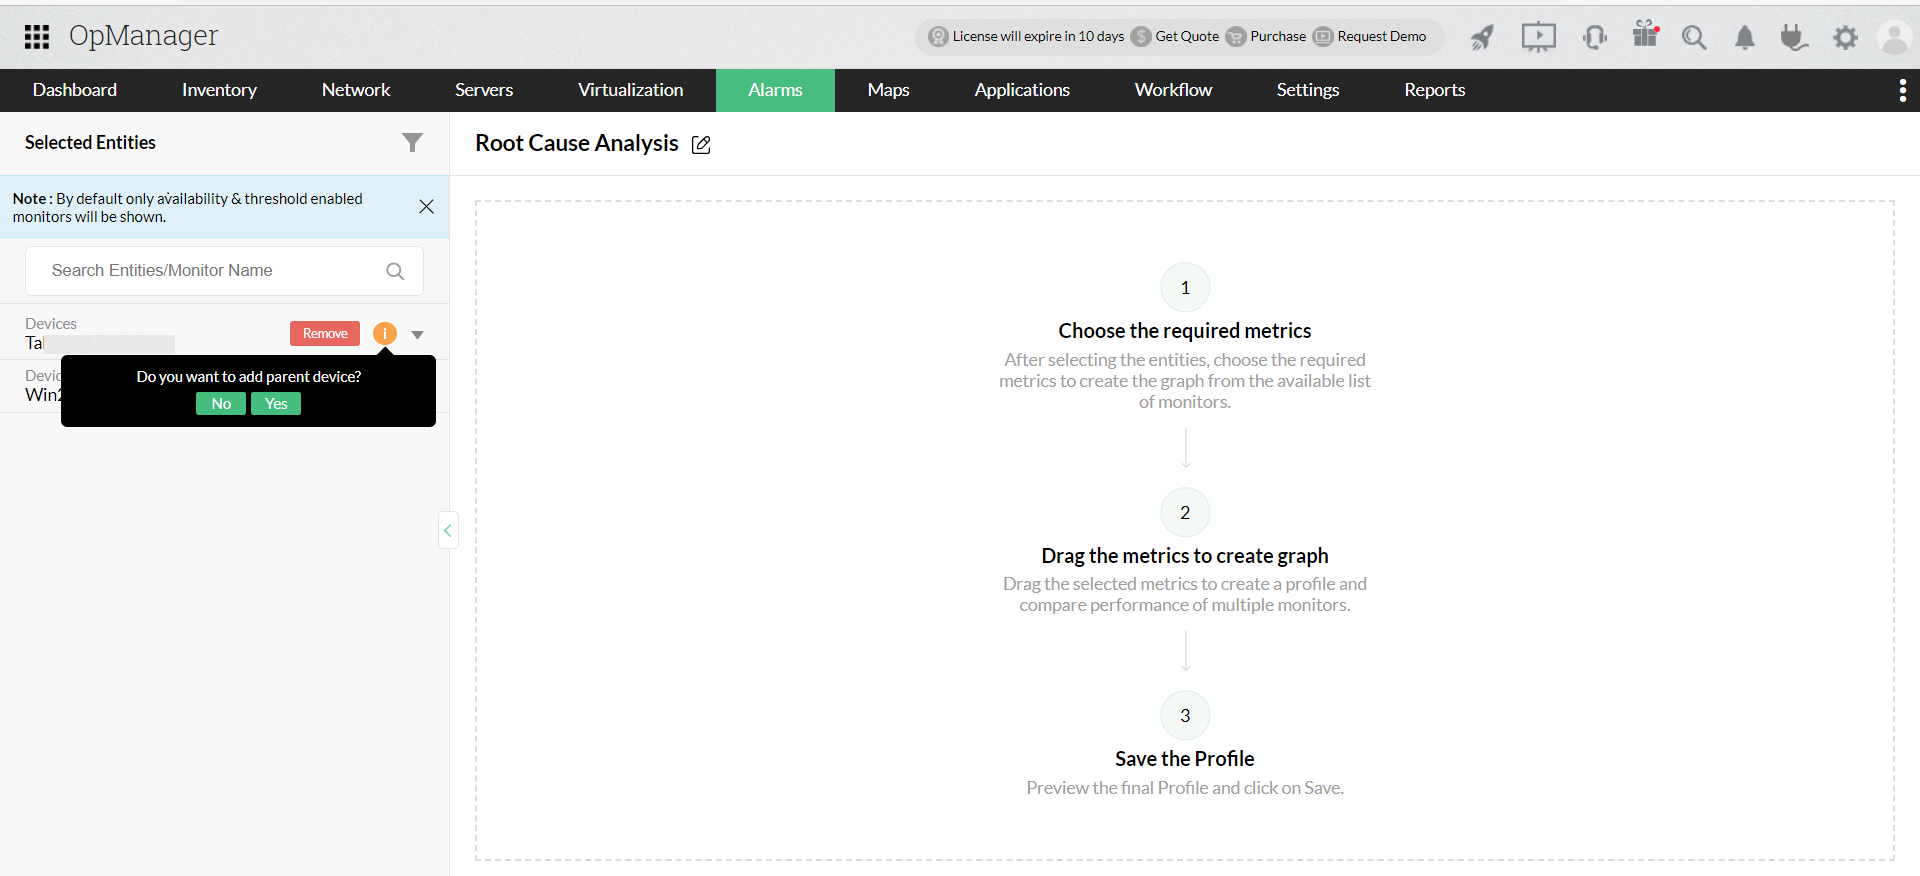
- The list of selected entities is available in the left pane.
- If you had selected a device with up link dependency configuration, you can choose to list the dependent devices using the 'i' icon.

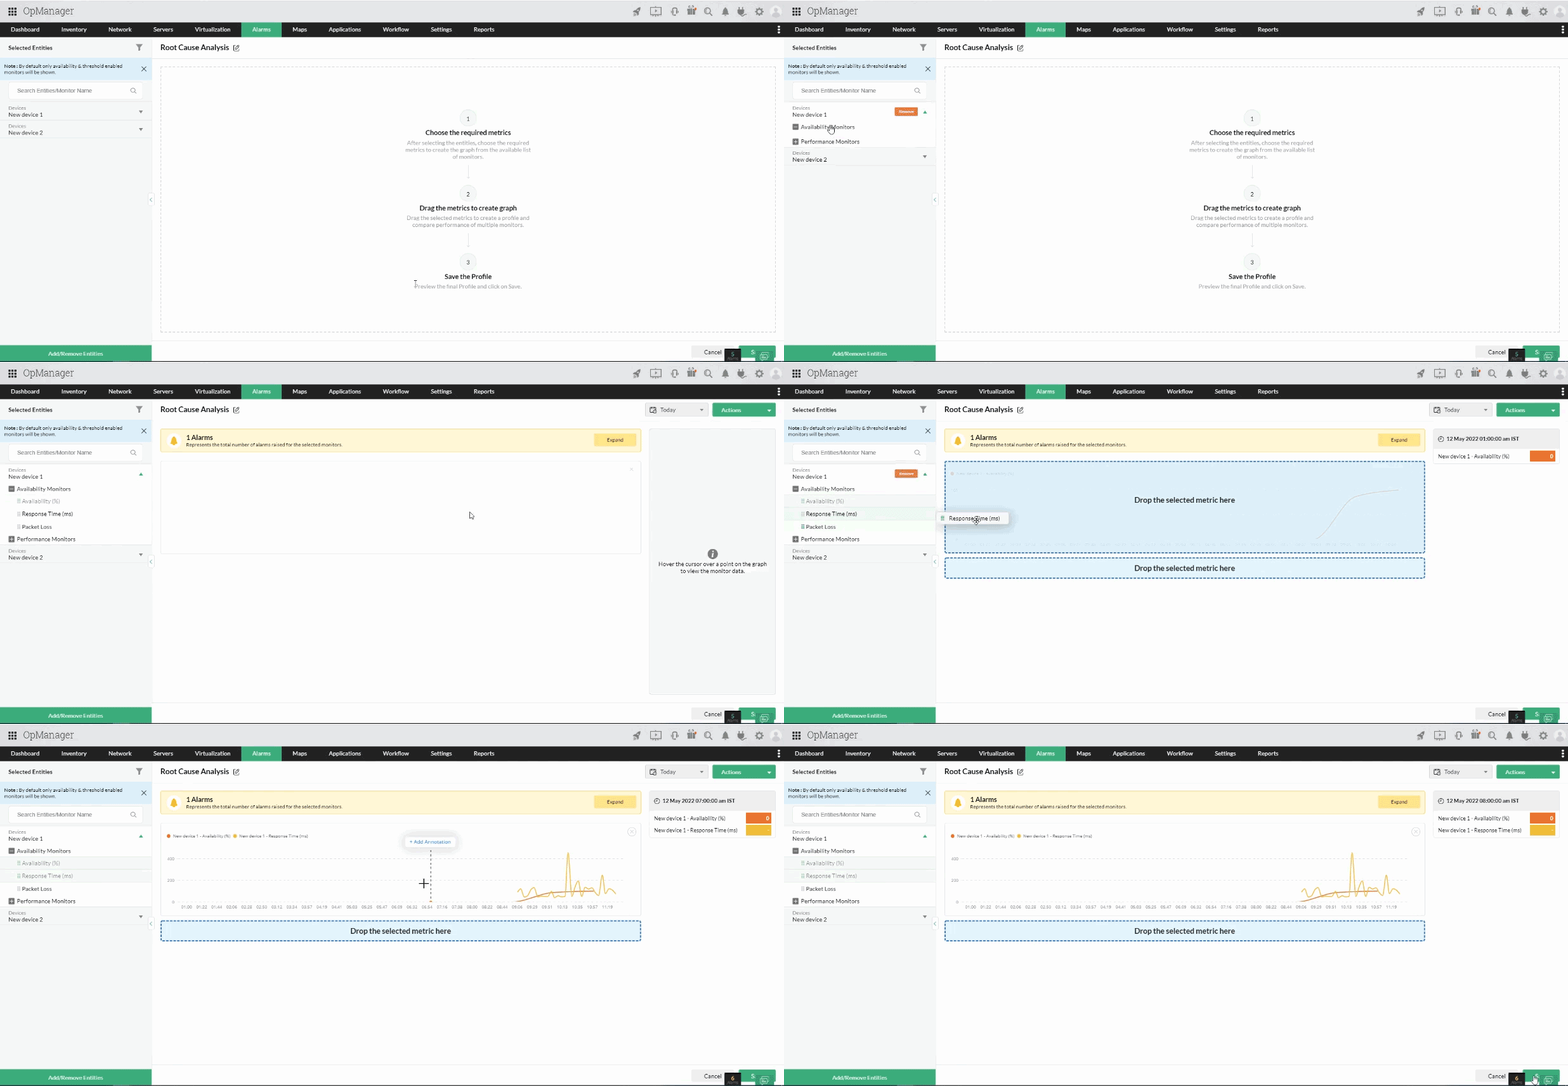
- Click on a particular entity and it lists down the monitors associated with it.
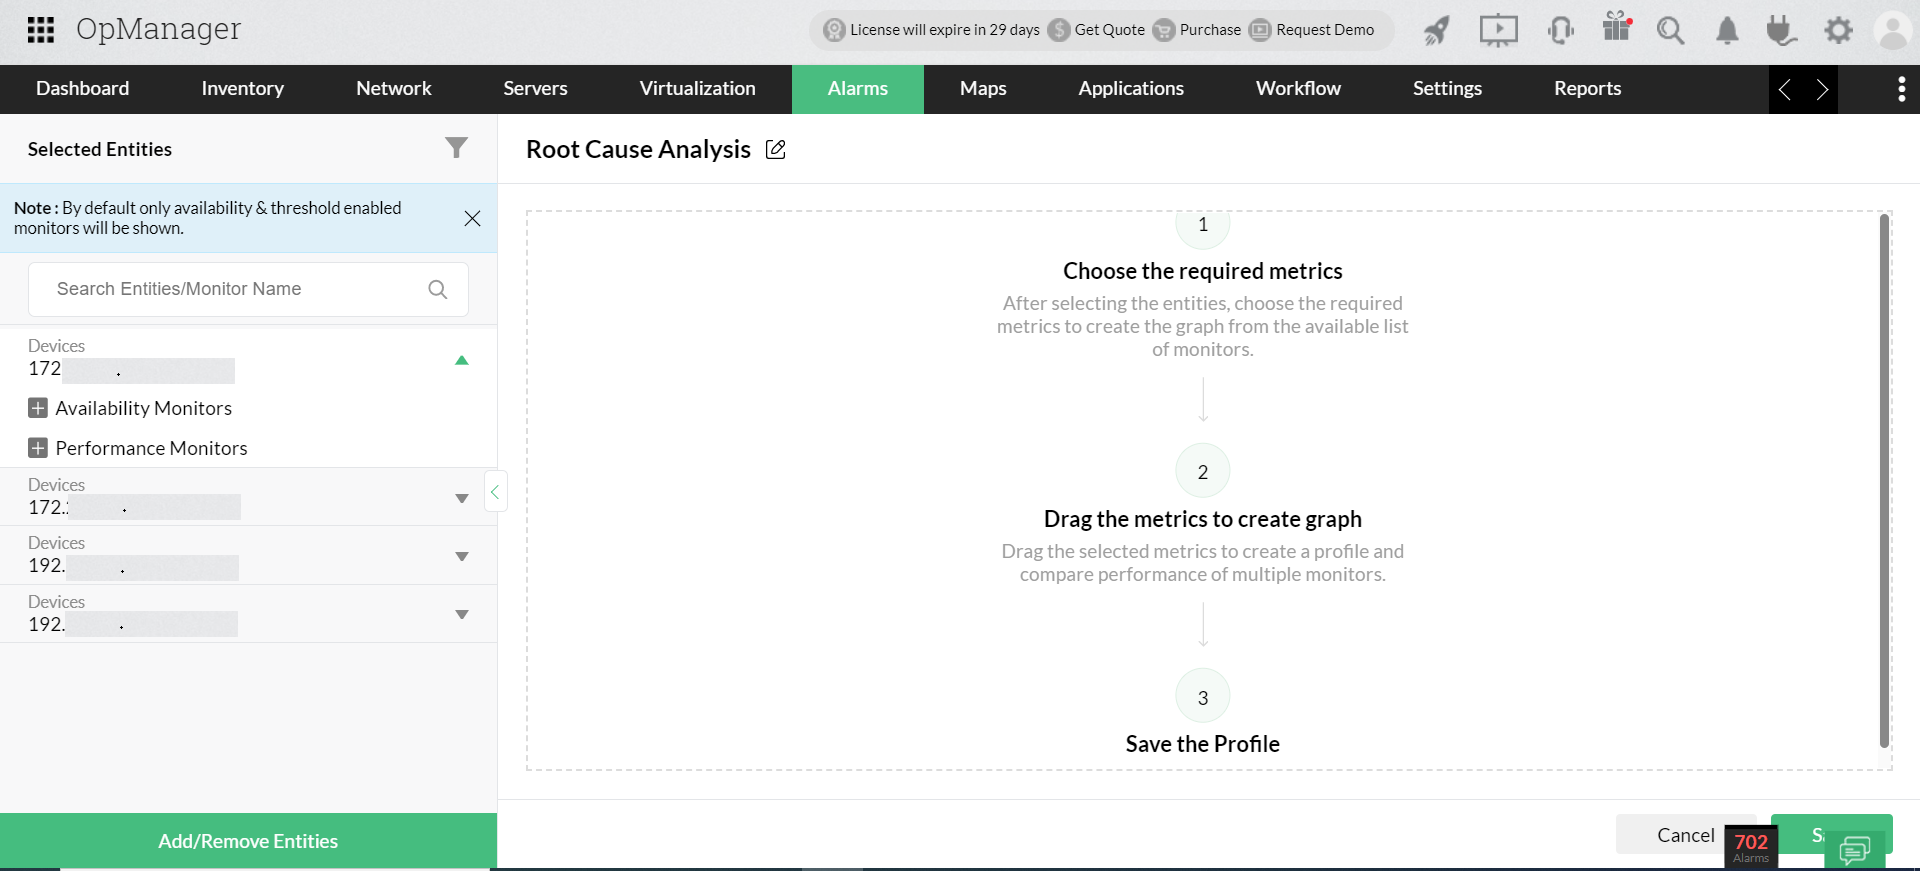
- Only threshold enabled monitors and availability monitors are listed by default. If you want to see all the monitors, hover the cursor on the filter icon at the top and select Show all monitors.
- Drag a monitor and drop at the center to form a performance graph with the monitor data. (Likewise, you can drag and visualize up to 20 monitors in this window.)

- Click on Save
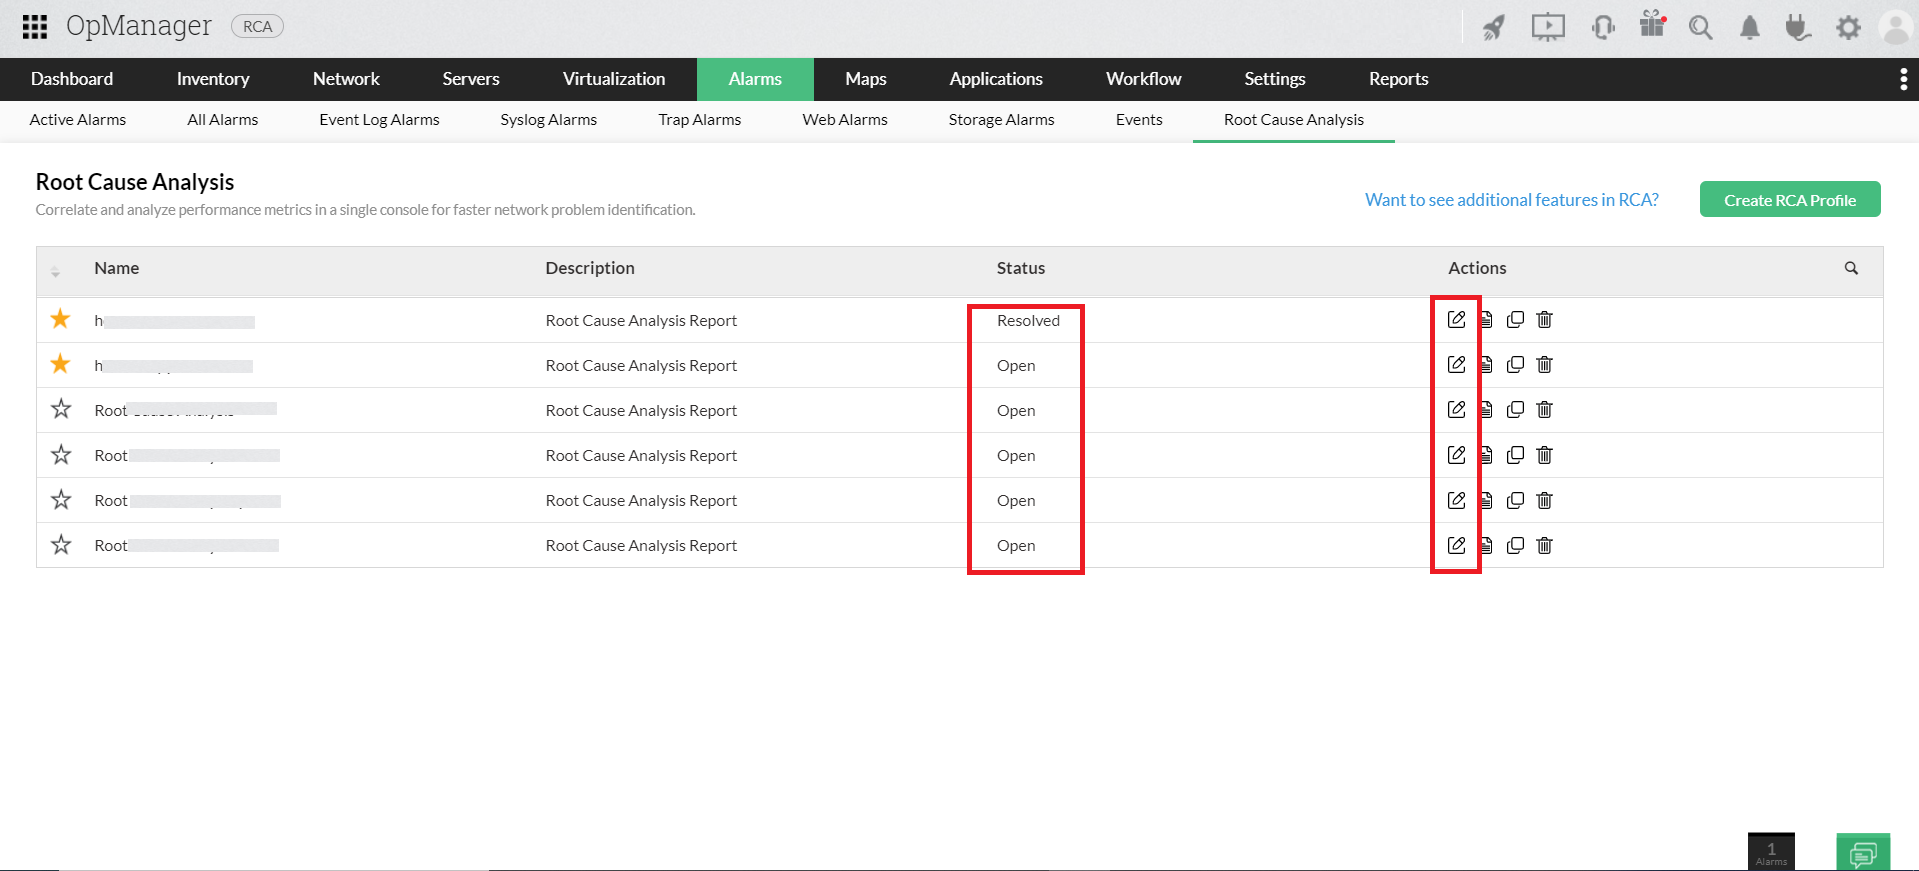
- Navigate to Alarms → Root Cause Analysis to find the list of RCA Profiles created.
You can record your inferences at different points on a graph using this annotation option.
- Hover your cursor over a particular point on the graph and click on Add Annotation.
- Choose a monitor.
- Enter your inference in the message box.
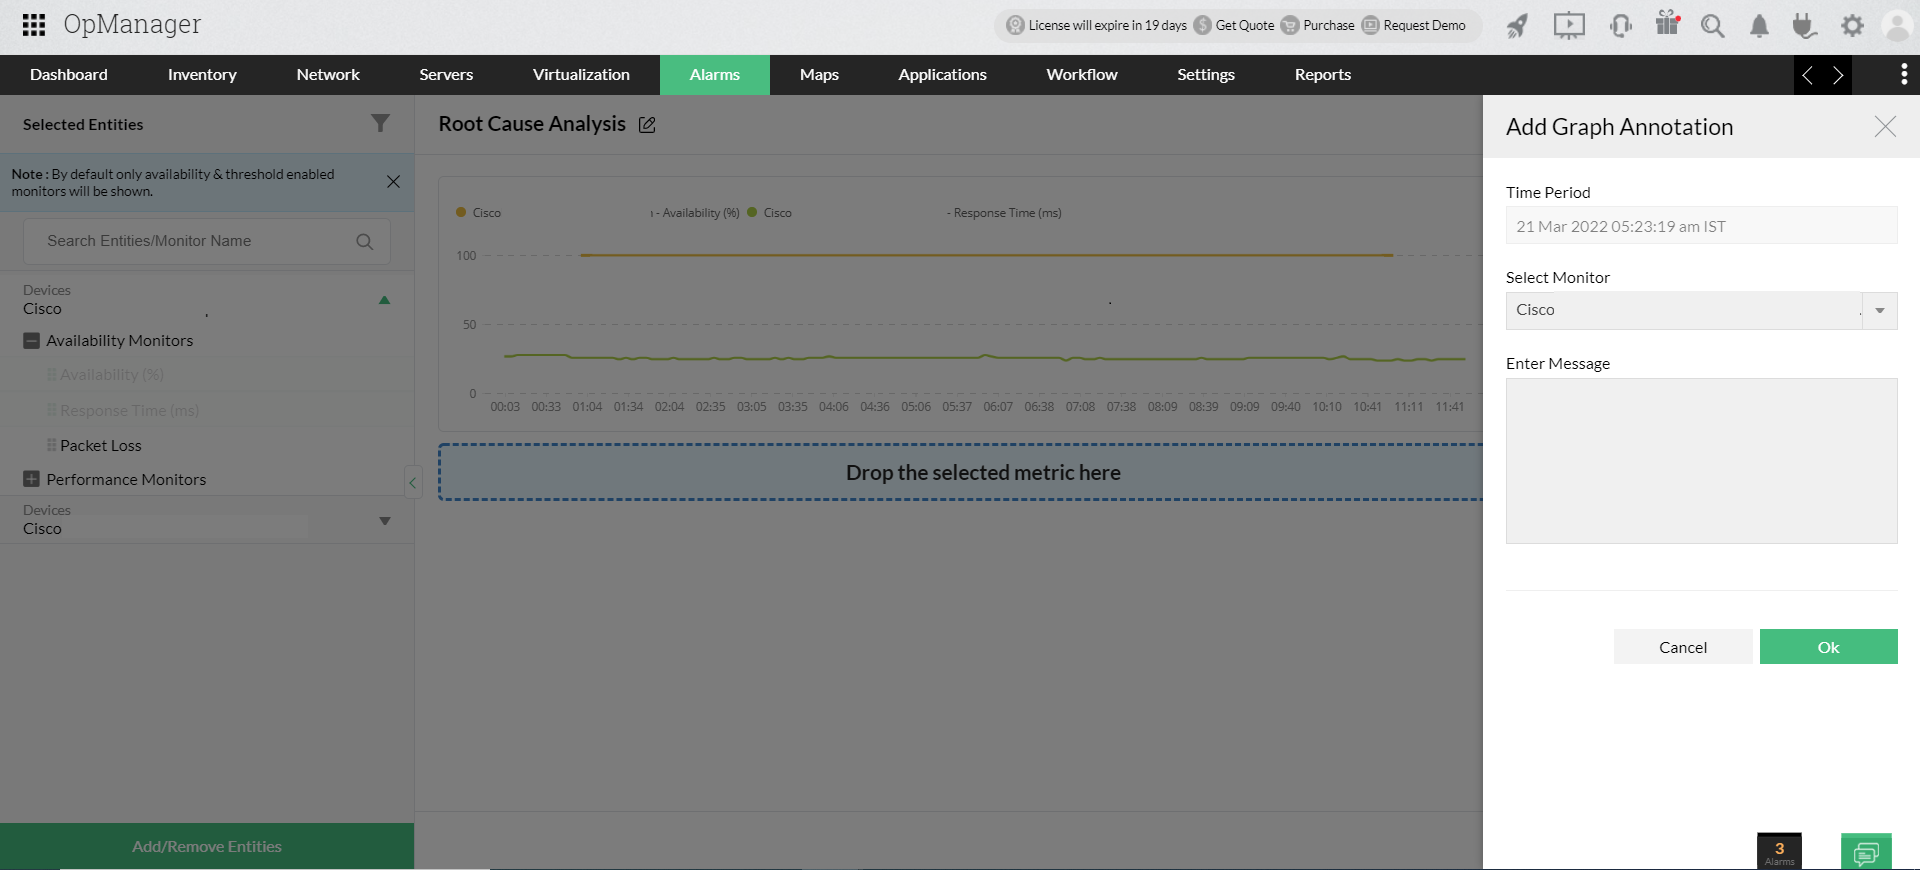
Note: The annotation message you record for a particular instant will be displayed in another RCA Profile wherever you drag and drop the same monitor.
Once you narrow down the root cause of an issue, you can close a RCA Profile by adding a resolve note.
- Click on the Mark as Resolved button.
- Write your notes.
- Click on Ok.
- Once you add a resolve note, the status of the Profile will be updated as Resolved.
- You can export a RCA Profile in a PDF.
- Copy a RCA Profile.
- You can reopen a RCA Profile that was already marked resolved using the edit button.
- You can click the star icon available right before a RCA Profile's name to mark as favorite.
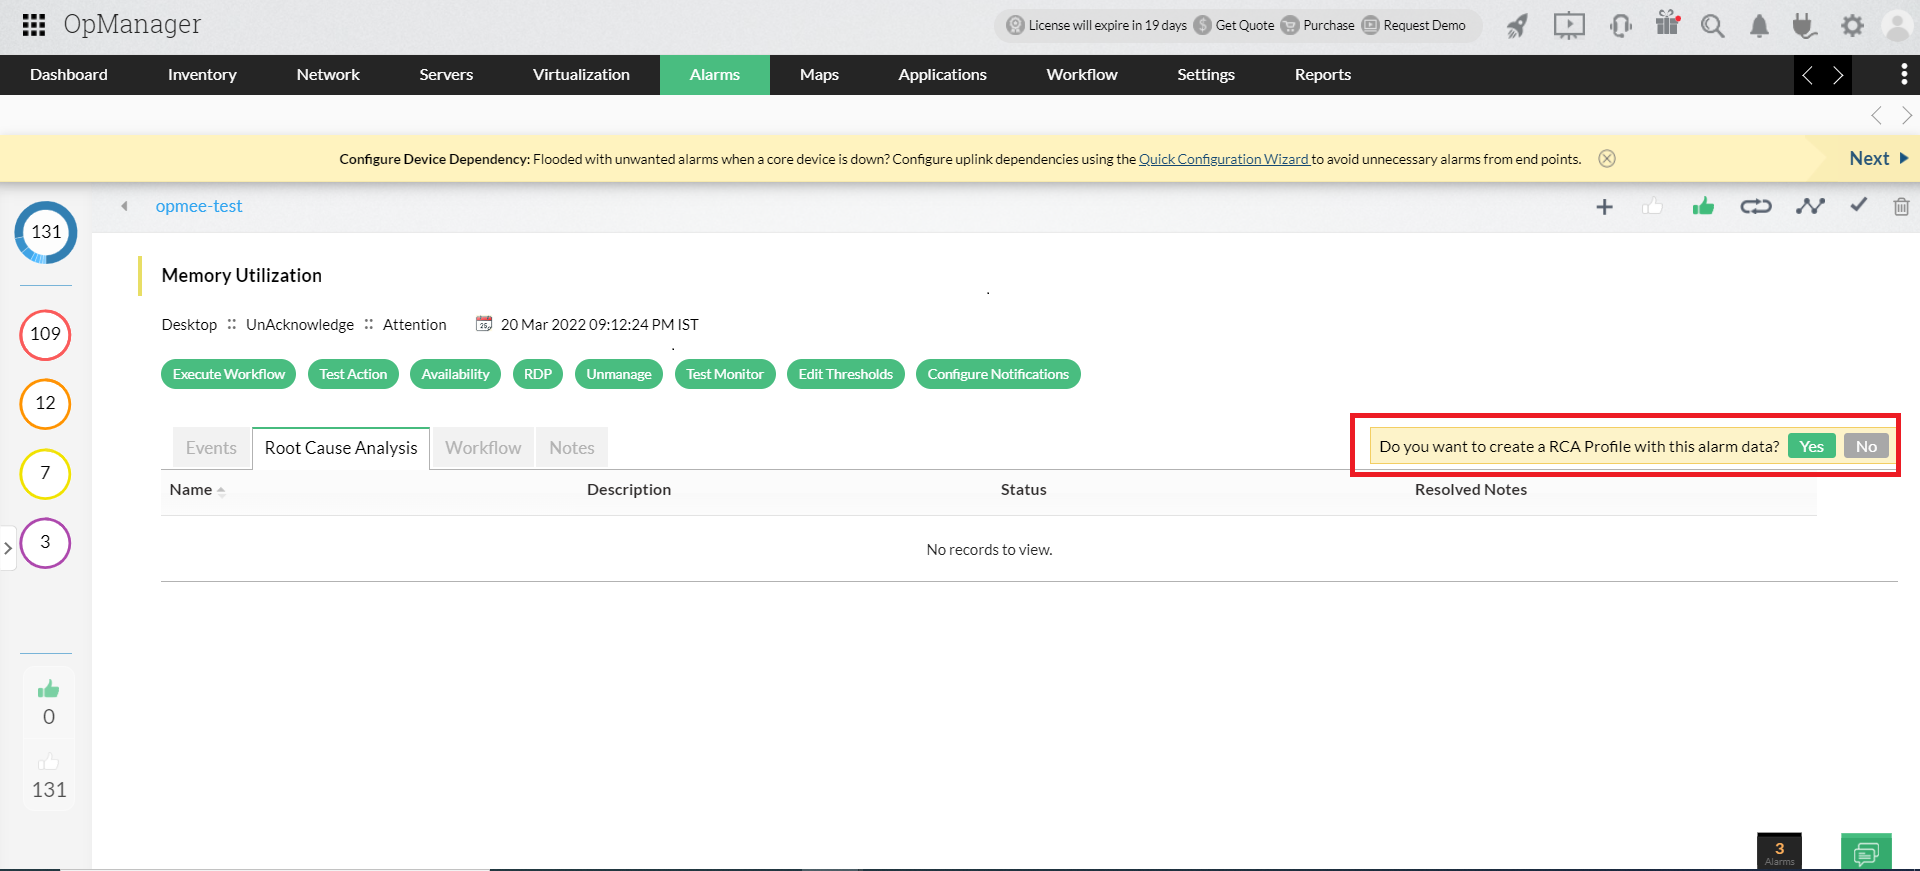
- Click on the Alarms tab.
- Click on an alarm to open the alarm snapshot page.
- Click on the Root Cause Analysis tab.
- On the right corner, click on the Yes button that is available next to the question.
- It will take you to the RCA Profile page, where you can see the list of entities (devices, URLs or interfaces) associated with the alarm.
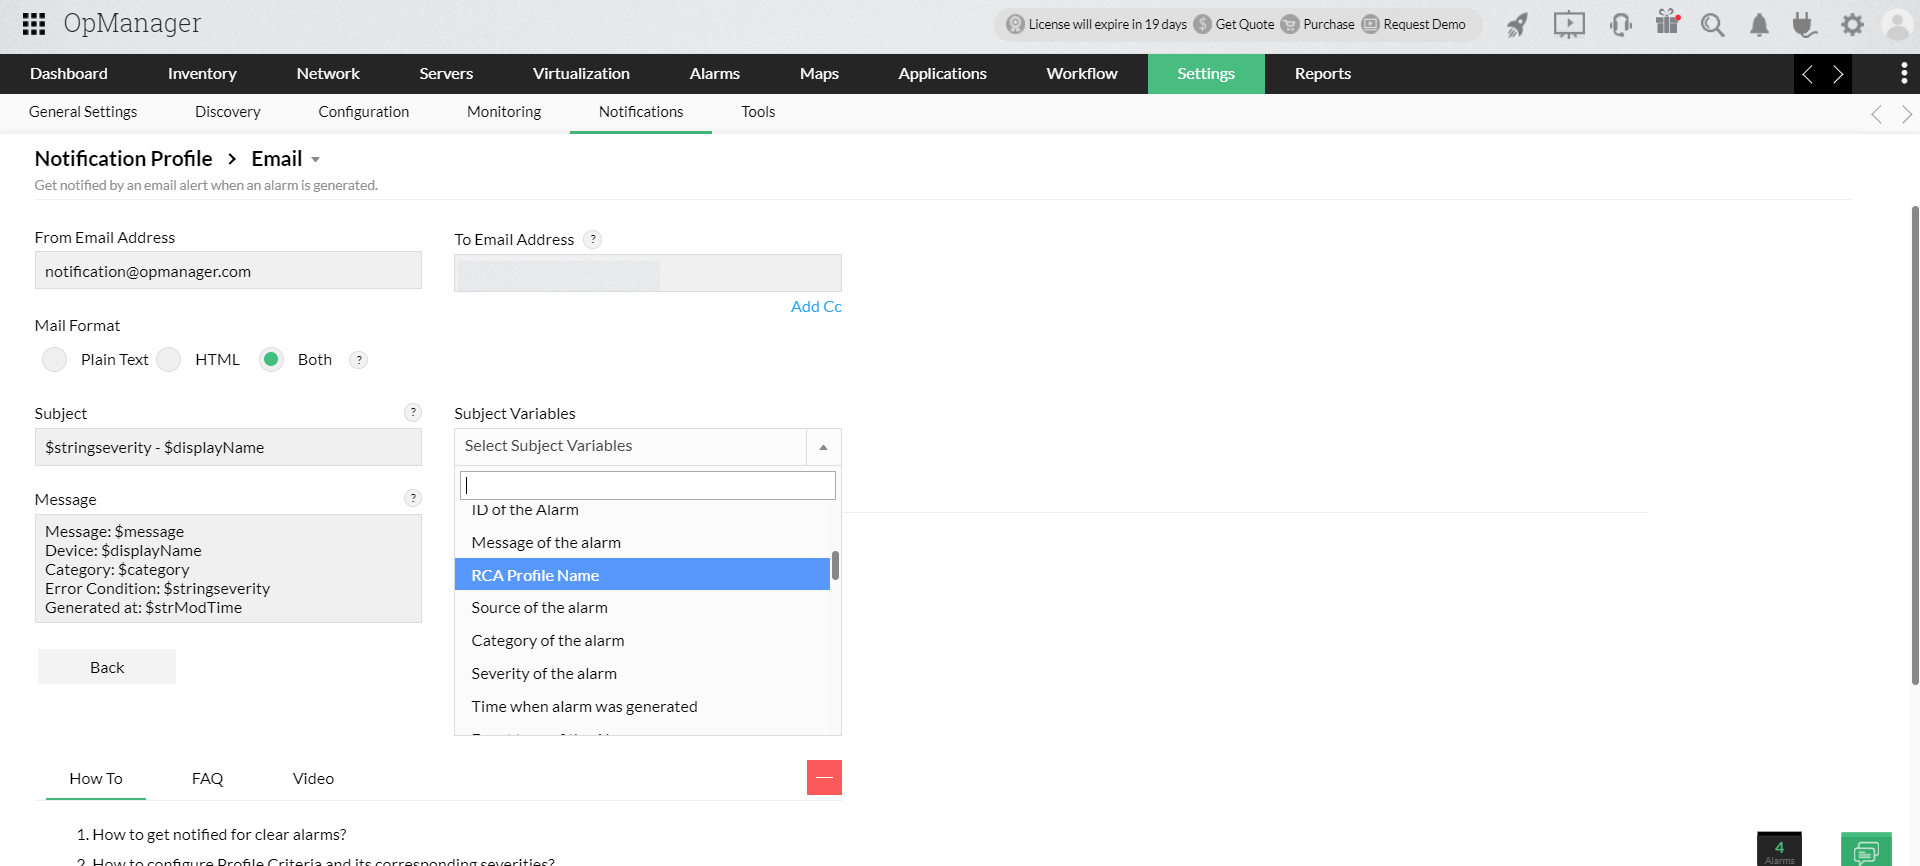
Note: When you
configure the Notification Profile to receive alarm notifications, you will have an option to insert the RCA Profile's alarm variable in the message and subject fields.
This feature is particularly useful when a network outage occurs on a particular site or a branch of your organization and you want to troubleshoot the issue.
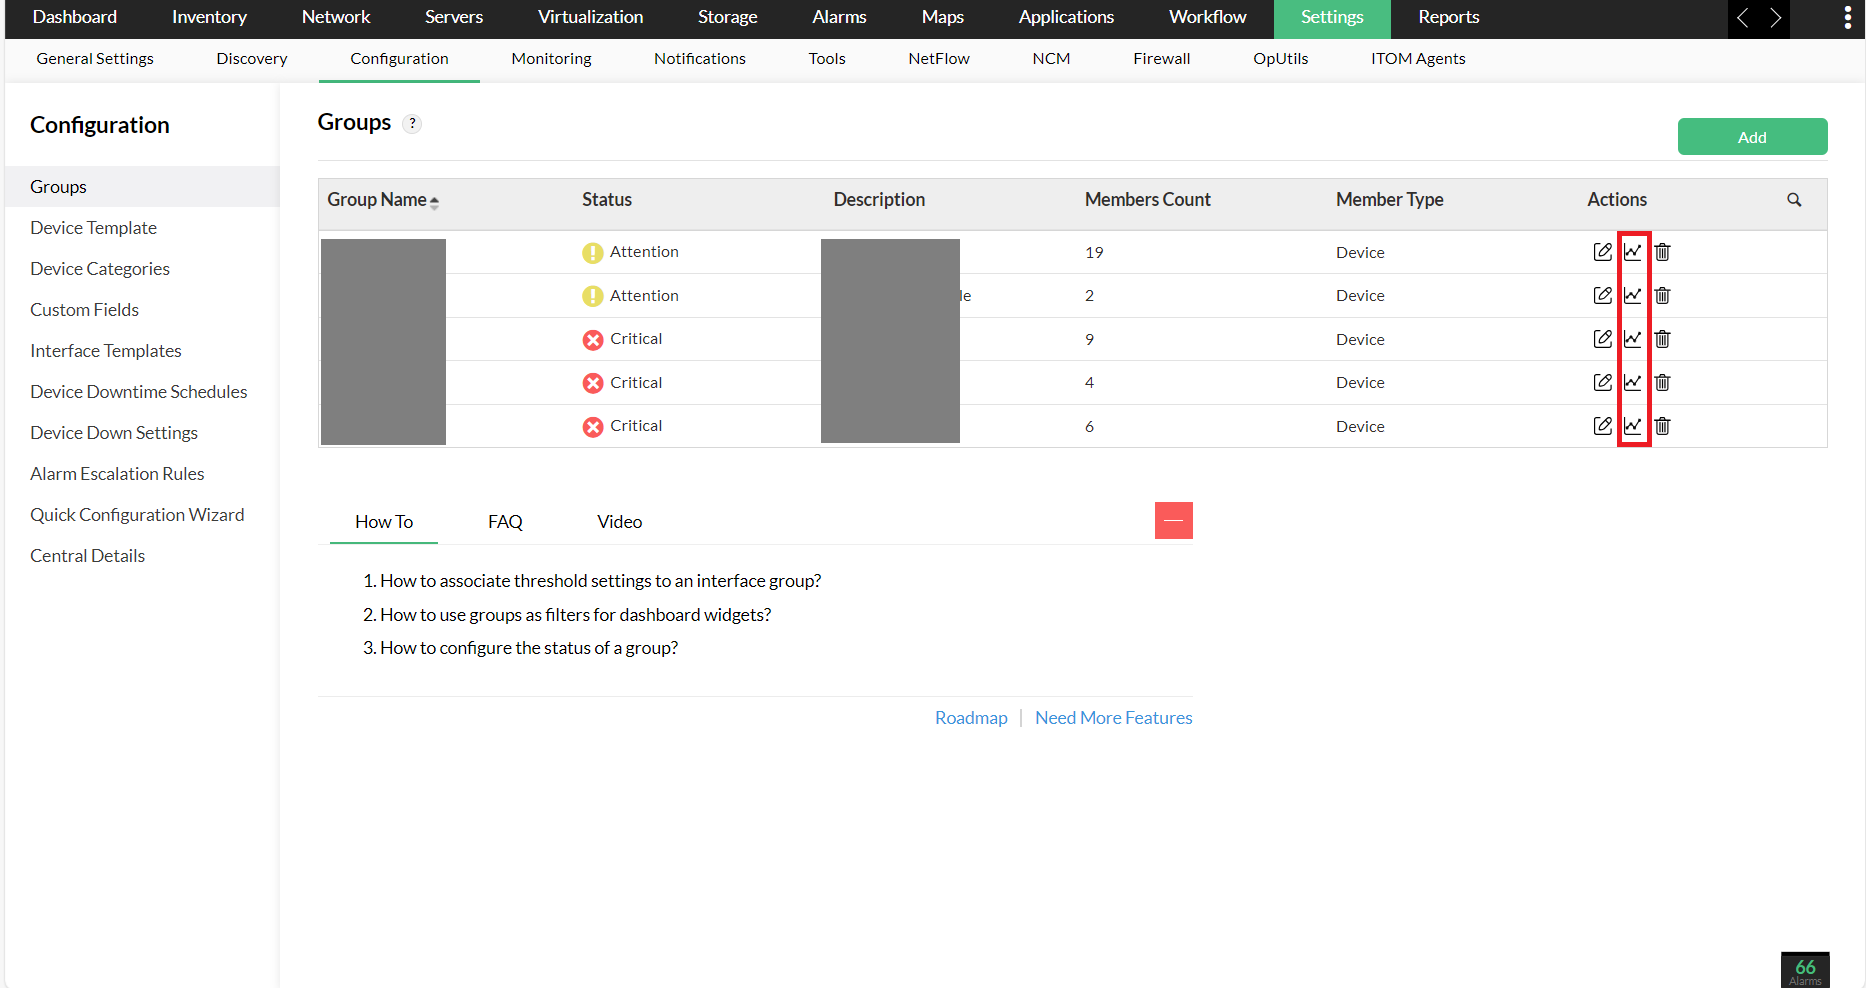
- Navigate to Settings --> Configuration --> Groups.
- Click on the graph symbol available under the Actions tab.
- It will take you to the RCA Profile page, where you can see the list of entities associated with the group.
- You can select the required entities and perform RCA.

Thank you for your feedback!
