What are server logs?
Server logs are files generated by a server to record its activities and events. Logs help you track important information like user requests, log in details, system performance, errors, and security events. This page explores the following topics on server logs:
- Types of server logs
- How to open and check server logs in Windows and Linux?
- Why do you need a log monitoring tool?
- Event log monitoring with OpManager
Understanding the different types of server logs
Logs generated by the server can be broadly classified into the following:
- Access logs: This type includes all user interaction details such as login attempts, resource access information like timestamp, IP and request types.
- Application and system logs: Includes events, traces, and errors associated with applications. These logs help during debugging.
- Security logs: These logs are useful to detect security threats or anomalies, by giving insights into authentication or login attempt failures, and policy changes.
- Errors: This includes record of exceptions, malfunctions and unusual behaviour of applications.
How to open and check server logs?
Server logs can be accessed by using the following methods:
- Manual: Using Native tools provided by the OS
- Advanced: Using a Centralized logging tool
Manual method
Generally server logs are stored in plain text. So, all you need is a text reader like NotePad or MS Word to access the log information. Some logs, which are available in HTML format and can be viewed directly with the help of a web browser. Apart from this, each operating system provides its own tools, and commands to access and read logs. Let us see how you can leverage the native tools available in Windows and Linux.
Windows
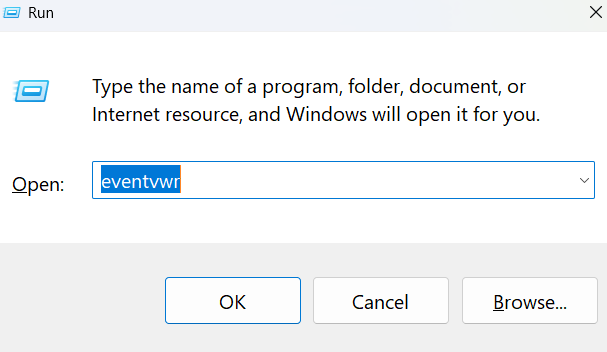
- Click start and open Event log viewer. Or, press Windows + R to open the Run dialog box, type eventvwr and hit Enter.
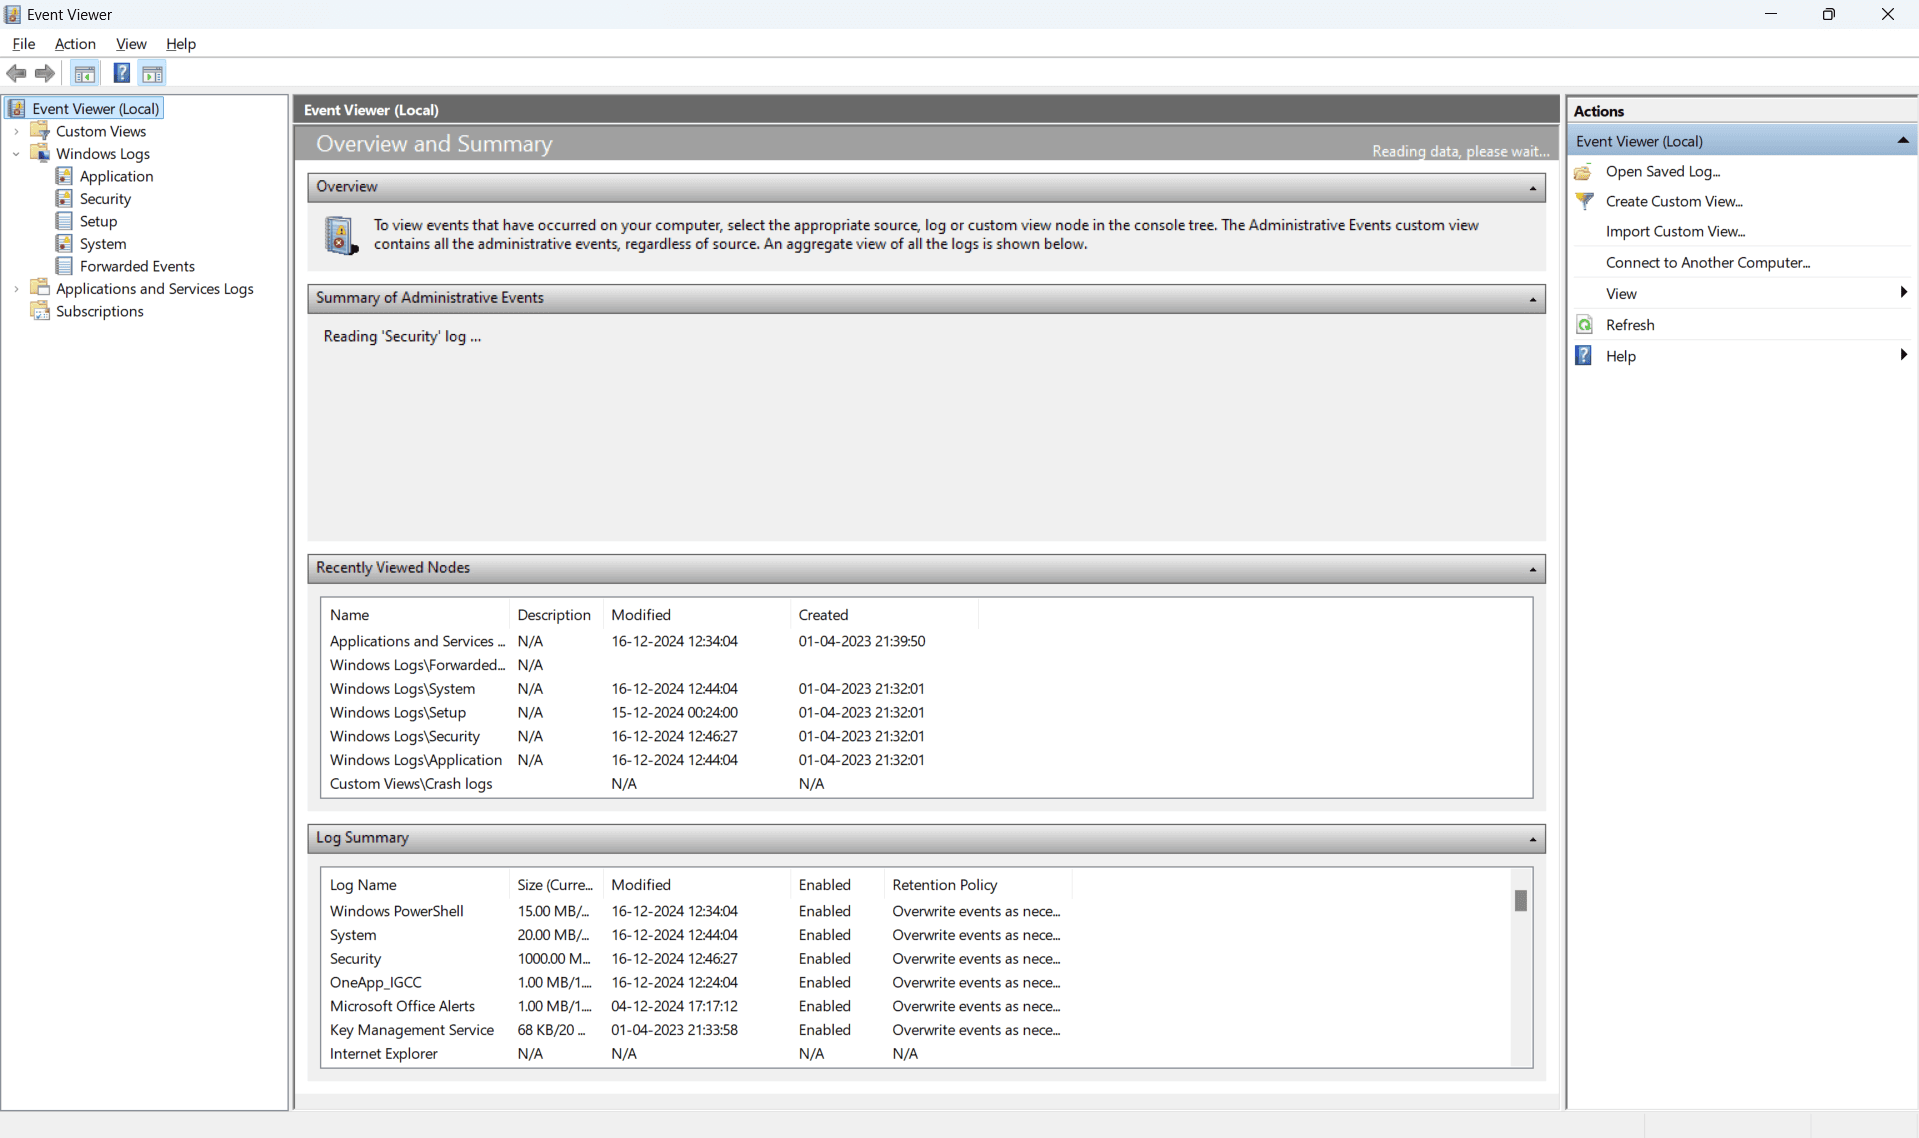
- Expand Windows Logs.
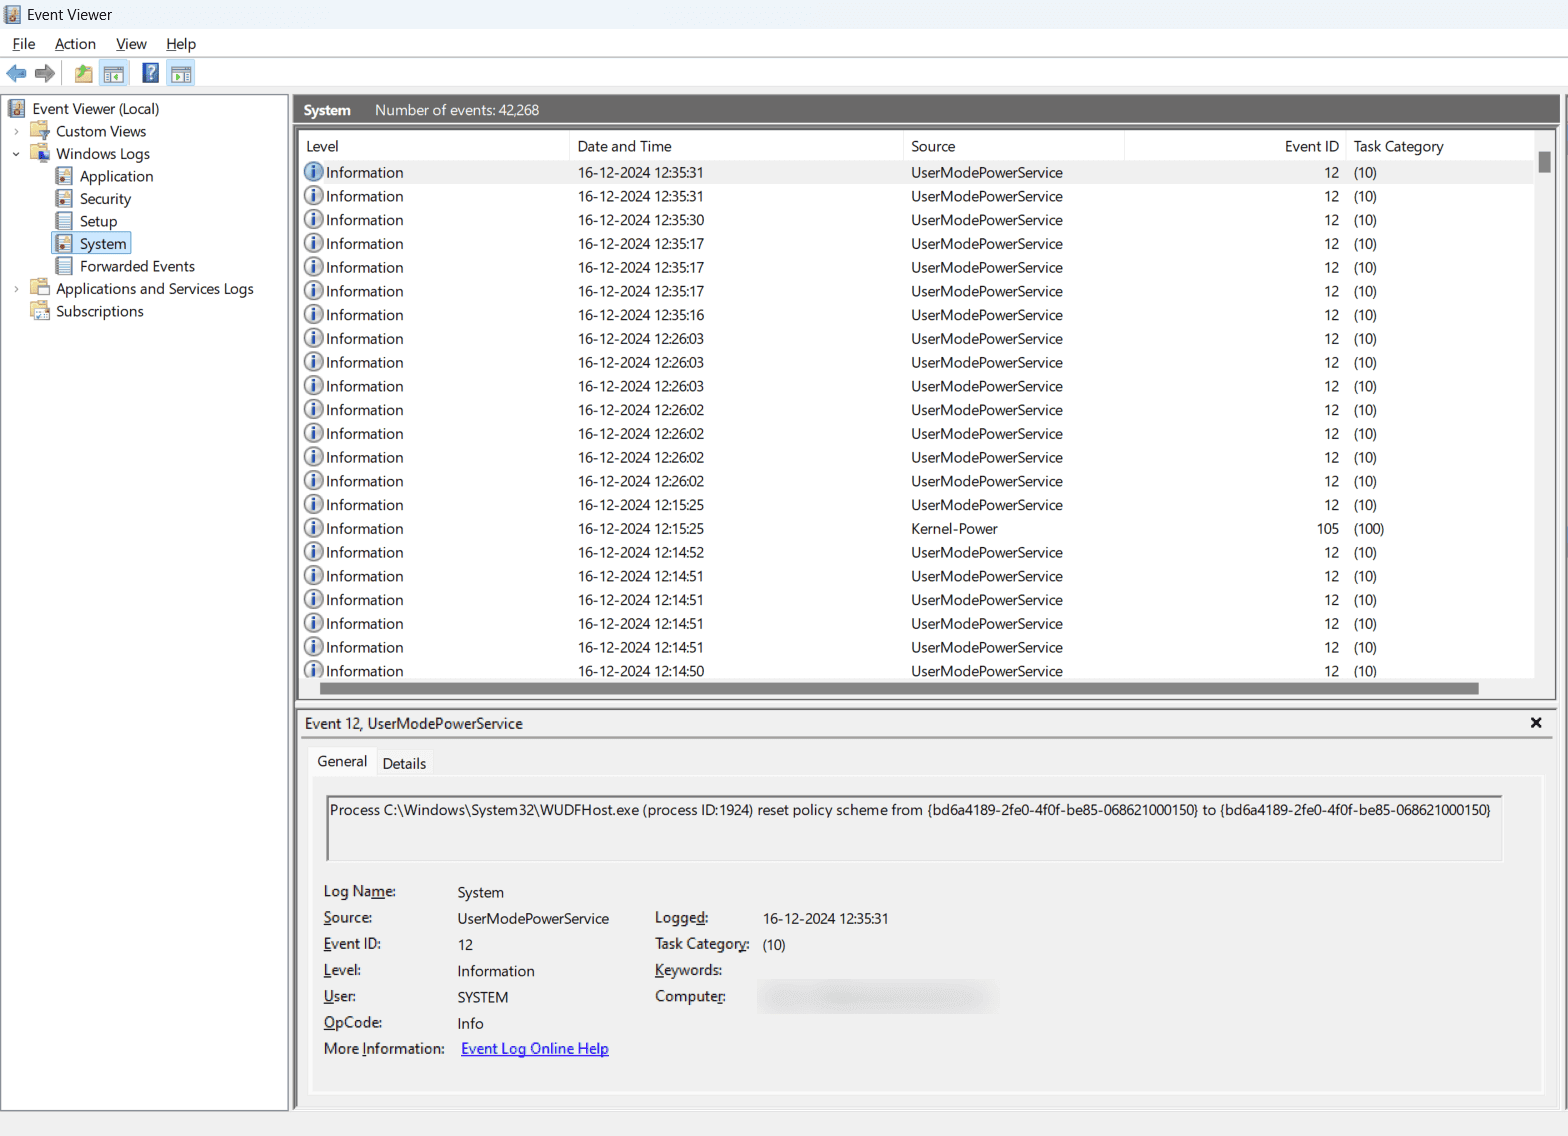
- Click on the log type (Application or System or Security) to view the log information.
Linux:
- There are different kinds of logs (such as System, event and application). Each log file has a different file path.
- Also, the files may vary based on the Linux version in use (Ubuntu/RedHat).
- Below, we have given some common commands and the type of information they provide. (Let's consider Ubuntu version for this example)
| Log file | Log type / Description |
|---|---|
| /var/log/syslog | Provides insights into system events, notifications from system services, and application errors. |
| /var/log/kern.log | Offers information about kernel (OS) related events such as hardware issues or memory problems. Useful for analyzing system reboots or hardware failures. |
| /var/log/auth.log | Provides details on user logins (both failed and successful) and other authentication-related events. |
| /var/log/apache2/access.log | Captures HTTP request IPs, URLs, and Apache-specific events. |
| /var/log/apache2/error.log | Captures runtime errors, records broken links and server errors. |
The following are some of the commonly used commands:
- tail -f <filename>
- Enables you to view the real-time data and gives you a glimpse of the most recent events - cat <filename>
- Gives you a full view of the specified log file - cat <filename>
| grep <search> - Enables you to search for a particular information from the large log file.
Advanced method: Why do you need a logging tool?
While the OS native tools like the Event Viewer for Windows provide visibility into logs, relying on separate tools for each system (or server type) creates data silos. This means, correlating the data across the servers becomes time consuming and increases the time taken to troubleshoot issues. However, a centralized logging tool enables you to overcome these challenges by giving you unified visibility. A centralized server log monitoring tool will derive data from multiple sources, and present in an unified dashboard. With real-time alerts for critical errors, IT teams can proactively address issues instead of manually checking individual log files.
Simplify server log management with OpManager
OpManager is an agent-based server log monitoring and management solution that supports both Windows and Linux server environments. It monitors server log files for text, regex (regular expressions), content patterns or phrases, to detect application errors or anomalies. For this purpose, a light weight agent is installed on the server. With real time alerting and a centralized view of logs from multiple servers, IT teams can quickly identify root causes by correlating logs across different systems. This also significantly reduces the manual effort for parsing and analyzing the logs.
Log management now made easy with OpManager! Experience it yourself!
Download 30-day free trialTo learn more about these features and how it can help manage your network better, take a free personalized demo or try our product for yourself with our free edition.
FAQs
Why should you monitor server logs?
+Can a log monitoring tool help with security?
+Make your server uptime monitoring simple and efficient with OpManager
Download OpManager nowCustomer reviews
More than 1,000,000 IT admins trust ManageEngine ITOM solutions to monitor their IT infrastructure securely
Case Studies - OpManager
Awards & Honors
- Recognized as a May 2019 Gartner Peer Insights Customers' Choice for Network Performance Monitoring and Diagnostics Software
- Recognised as an April 2019 Gartner Peer Insights Customers' Choice for IT Infrastructure Monitoring Tools.
- Network Management and Monitor Vendor of the Year 2018, 2019
- Entered the 2019 Gartner NPMD Magic Quadrant.
- Ranked #2 in the Infotech Research Software Reviews Data Quadrant 2018.
R
