Comprehensive NetApp monitoring software
- Monitor Storage Health: Track CPU, Latency, & Disk I/O
- Granular Volume Tracking: Watch Volume & LUN utilization live
- Prevent Capacity Crunch: Forecast growth & predict exhaustion
- Hardware Insight: Monitor Sensors, Fans, & Power Supplies

Trusted by over 15,000 happy customers globally
Gain in-depth visibility into NetApp storage
OpManager is a powerful NetApp monitoring software that combines storage APIs and SNMP to provide in-depth visibility into your NetApp storage systems. OpManager has in-built templates for NetApp monitoring that can monitor 40+ specialized storage key performance indicators (KPIs).
Storage capacity
Monitor NetApp RAID storage capacity at all levels by tracking metrics like: Configured capacity, capacity utilization, free capacity, and total capacity.
Latency and IOPs
Get instant alarms for spikes in storage latency. Track input and output speeds for read and write operations to ensure optimized storage performance.
Storage throughput
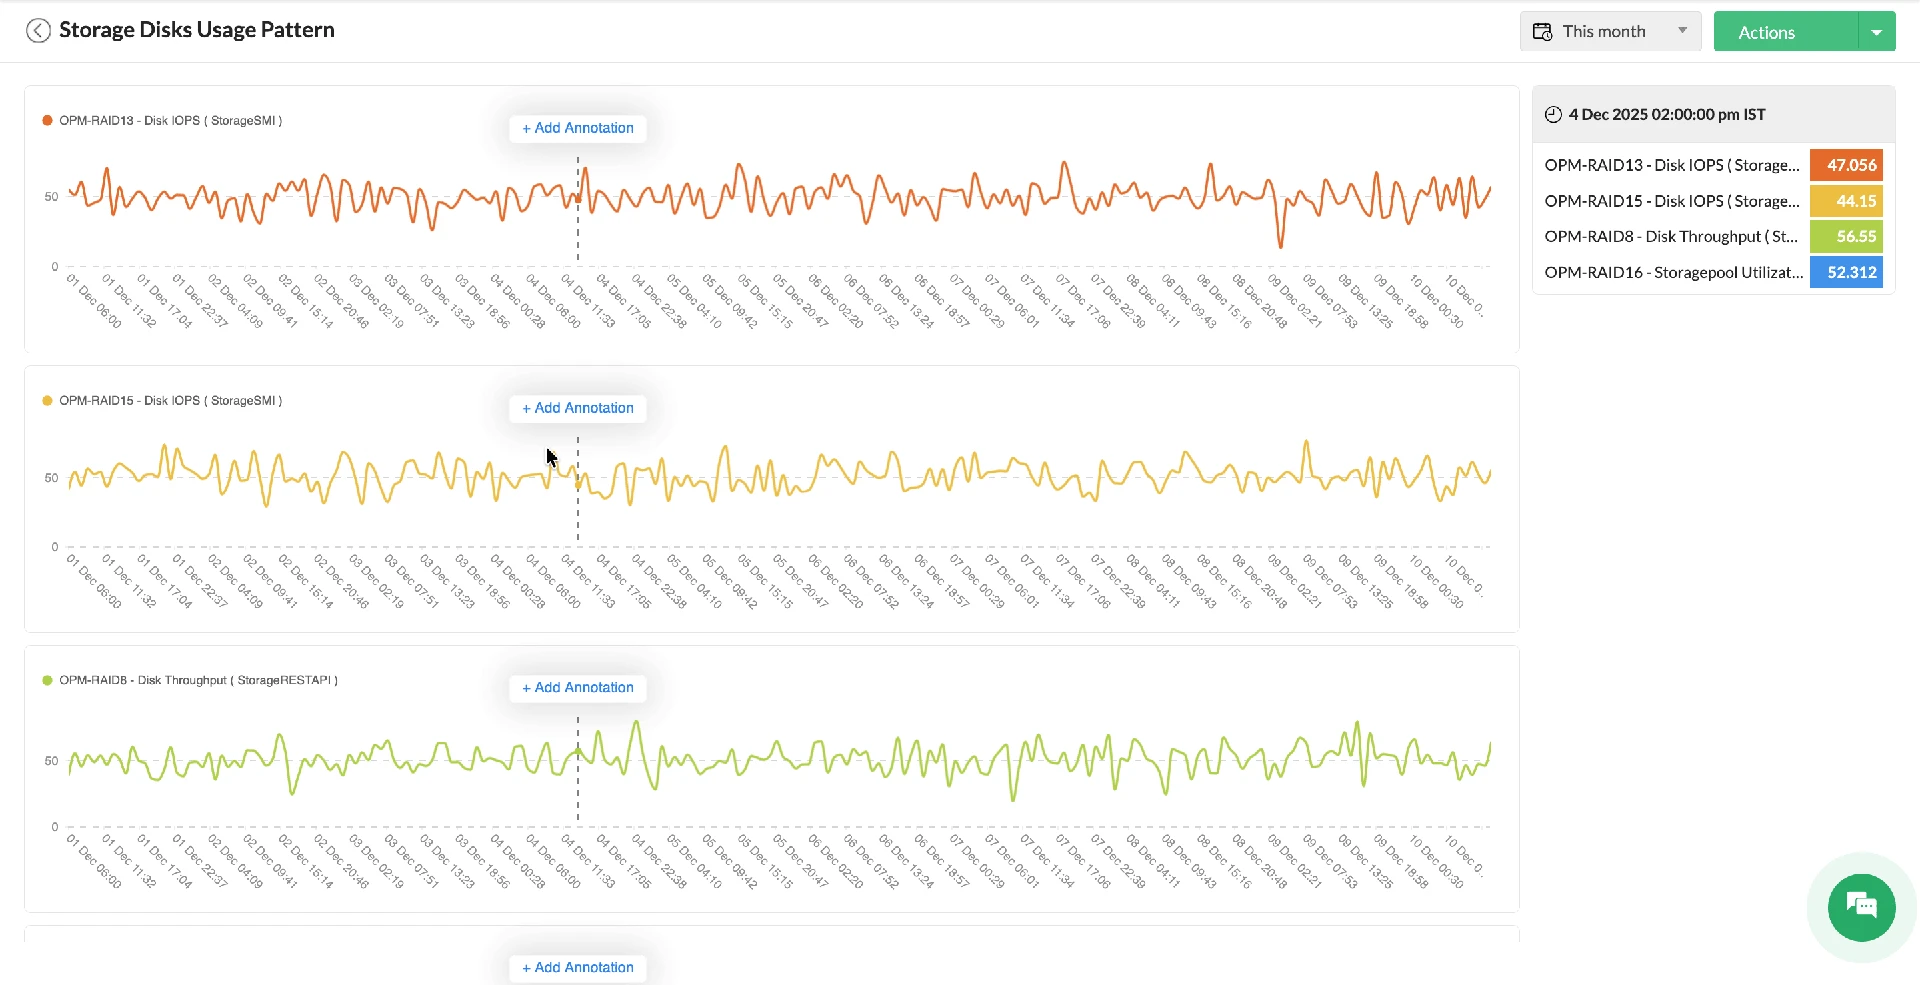
Gain visibility into storage traffic usage by monitoring incoming and outgoing traffic. Use colour-coded performance graphs to keep an eye on abnormal traffic spikes.
Storage disk
Monitor SSD, HDD, and NVMe disks used in your RAID arrays with insights into the speed, health state, status, and storage capacity of each disk.
LUNs, volumes & storage pools
Monitor storage pools, volumes, and LUNs. Track the capacity of each RAID component at each level and identify thinly provisioned volumes.
Hardware health
Keep tabs on RAID chassis, controllers, ports, fans, sensors, power supply, and temperature to ensure that you're not caught off-guard by hardware issues.
Extensive support for NetApp systems
OpManager incorporates NetApp's most popular storage solutions within its pre-built device templates. This means that you can start monitoring your NetApp devices with minimal manual configuration. Whether they are Individual arrays, ONTAP clusters, or other NetApp devices, you can start monitoring effortlessly.
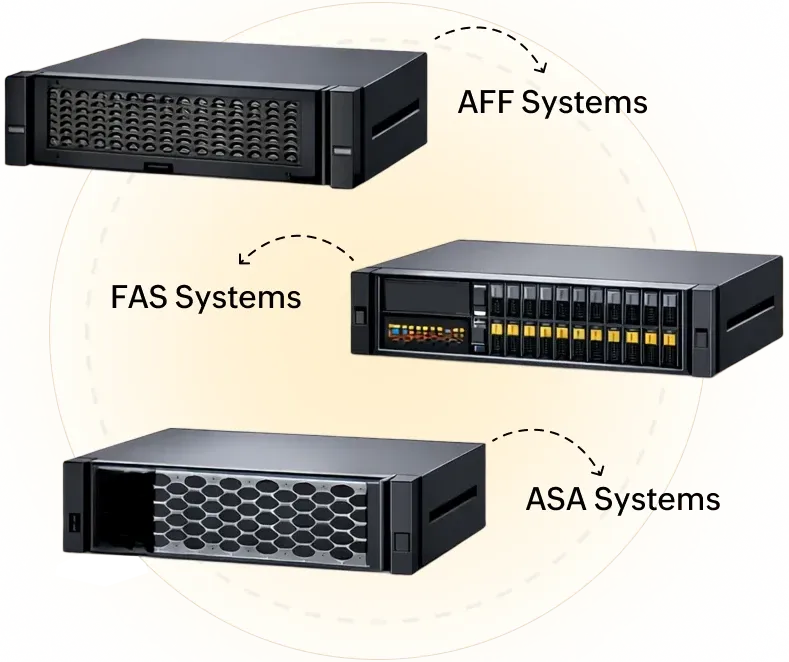
NetApp AFF, FAS, ASA Systems
- In-built support for NetApp ONTAP clusters, A series, AF series, and FAS systems.
- Track the throughput of the nodes and filers in your ONTAP clusters with metrics like NetRx and NetTx.
- Monitor protocol operations like NFS ops per second, CFS operations per second, and HTTP operations per second.
- Gain visibility into the capacity and capacity utilization of disks, pools, and volumes.
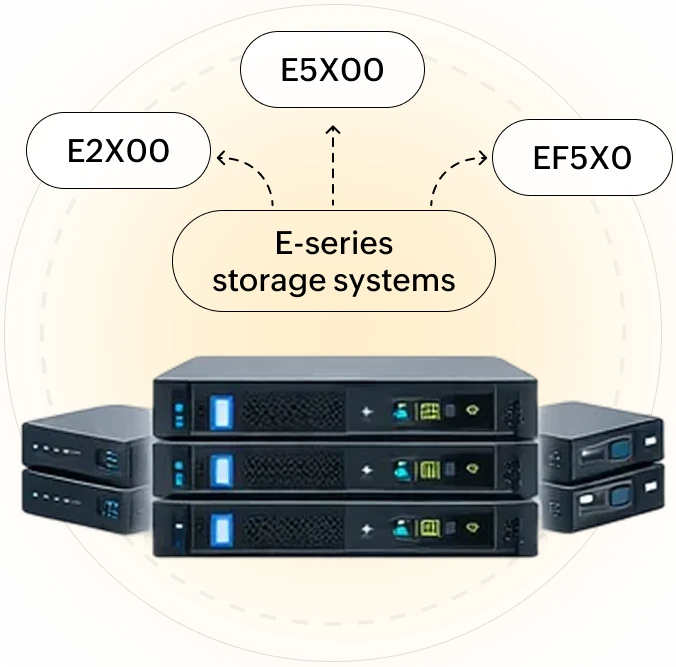
NetApp E-series storage systems
- In-built support for E-series and EF-series RAID systems like: E2X00, E5X00, and EF5X0
- Track the health of RAIDs, ports, cooling fans, and power supply units.
- Track IOPS and throughput of your E-series and EF-series RAID systems
- Gain visibility into the capacity and capacity utilization of disks, pools, and volumes.
How does NetApp monitoring with OpManager look like?
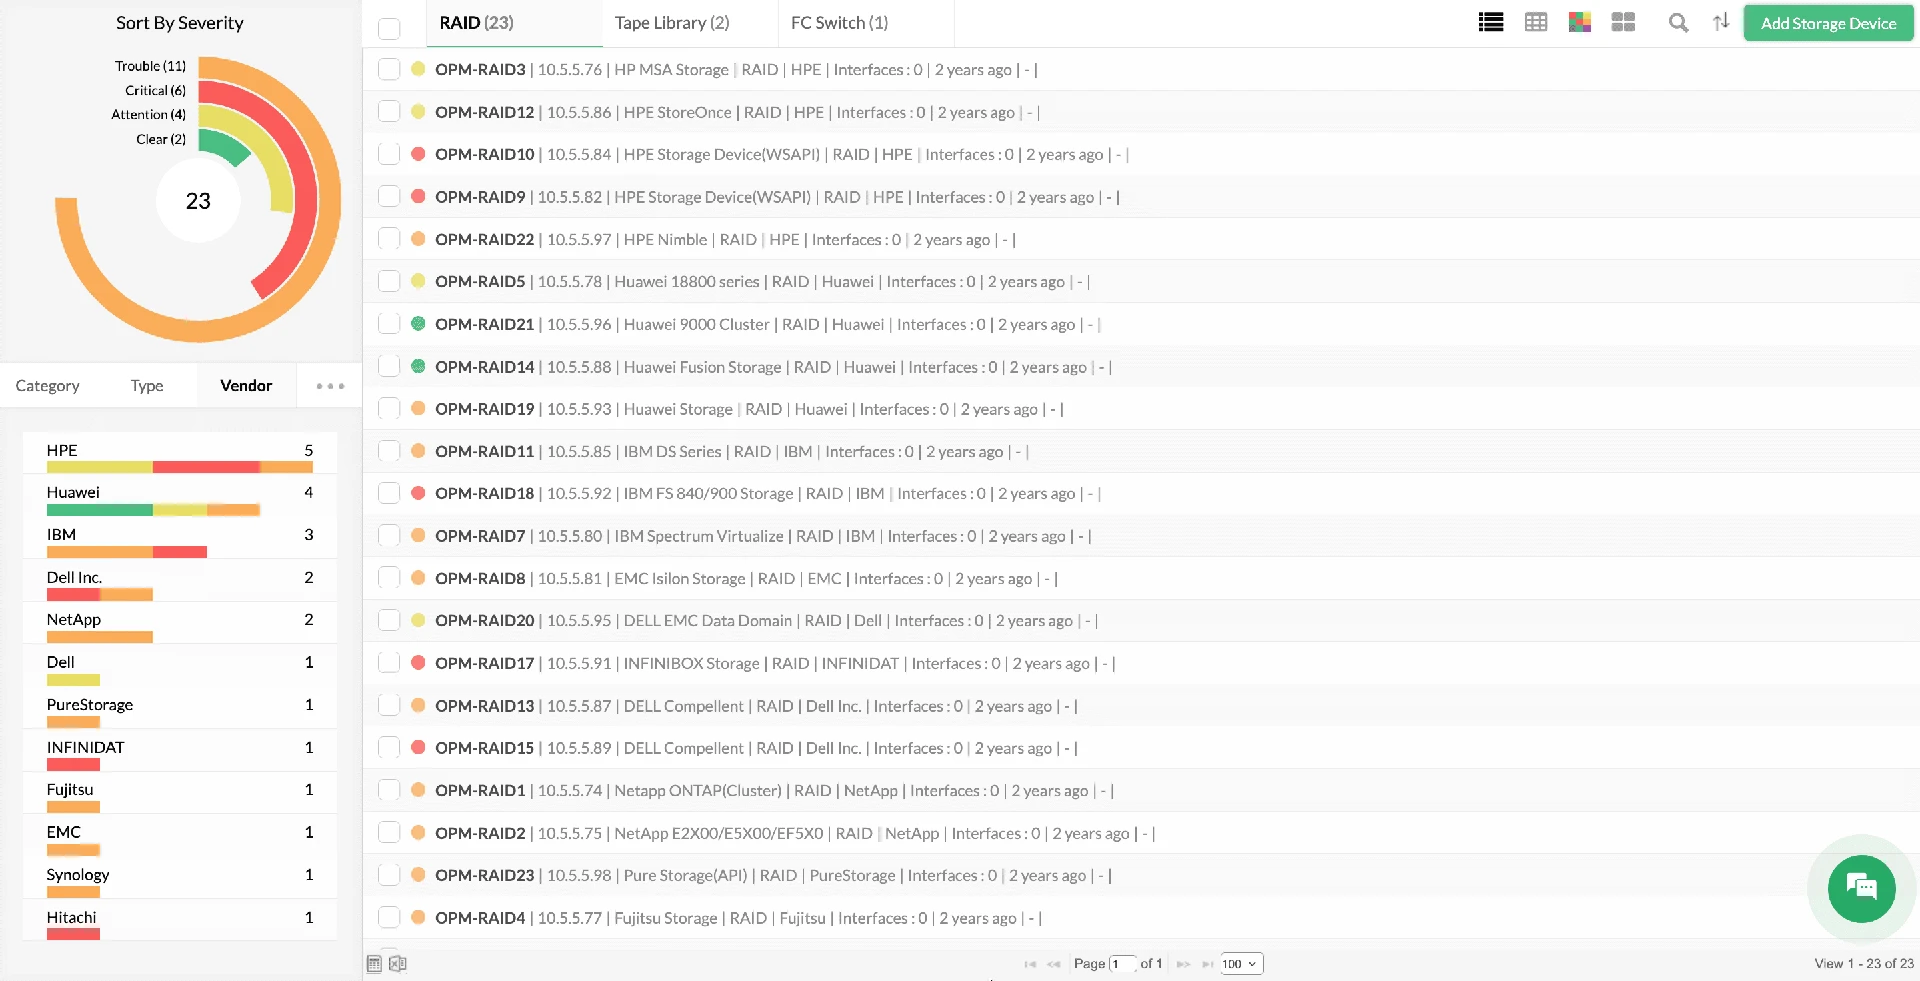
Discovery & classification
Automatically discover and classify NetApp arrays, filers, and clusters using over 11,000+ pre-built device templates. OpManager instantly identifies the specific model, maps its dependencies, and associates relevant storage monitors, ensuring your NetApp infrastructure is monitoring-ready the moment it connects to the network.
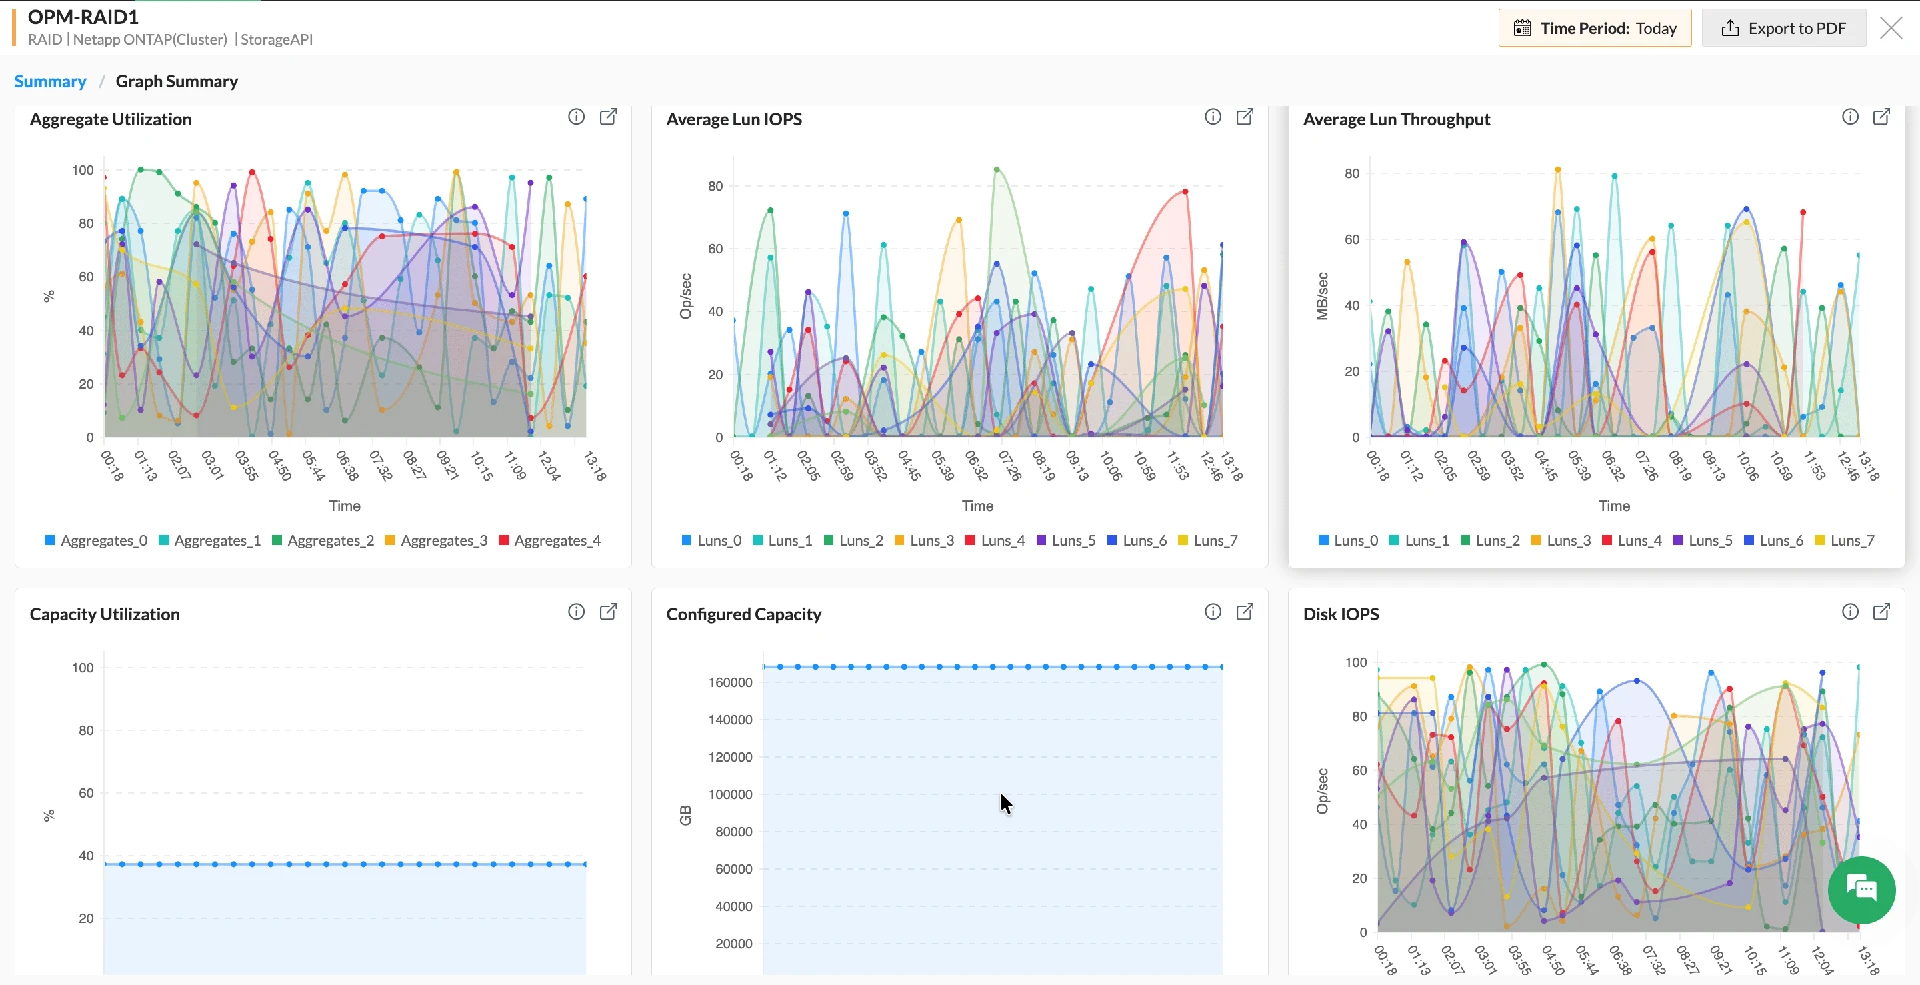
Performance monitoring
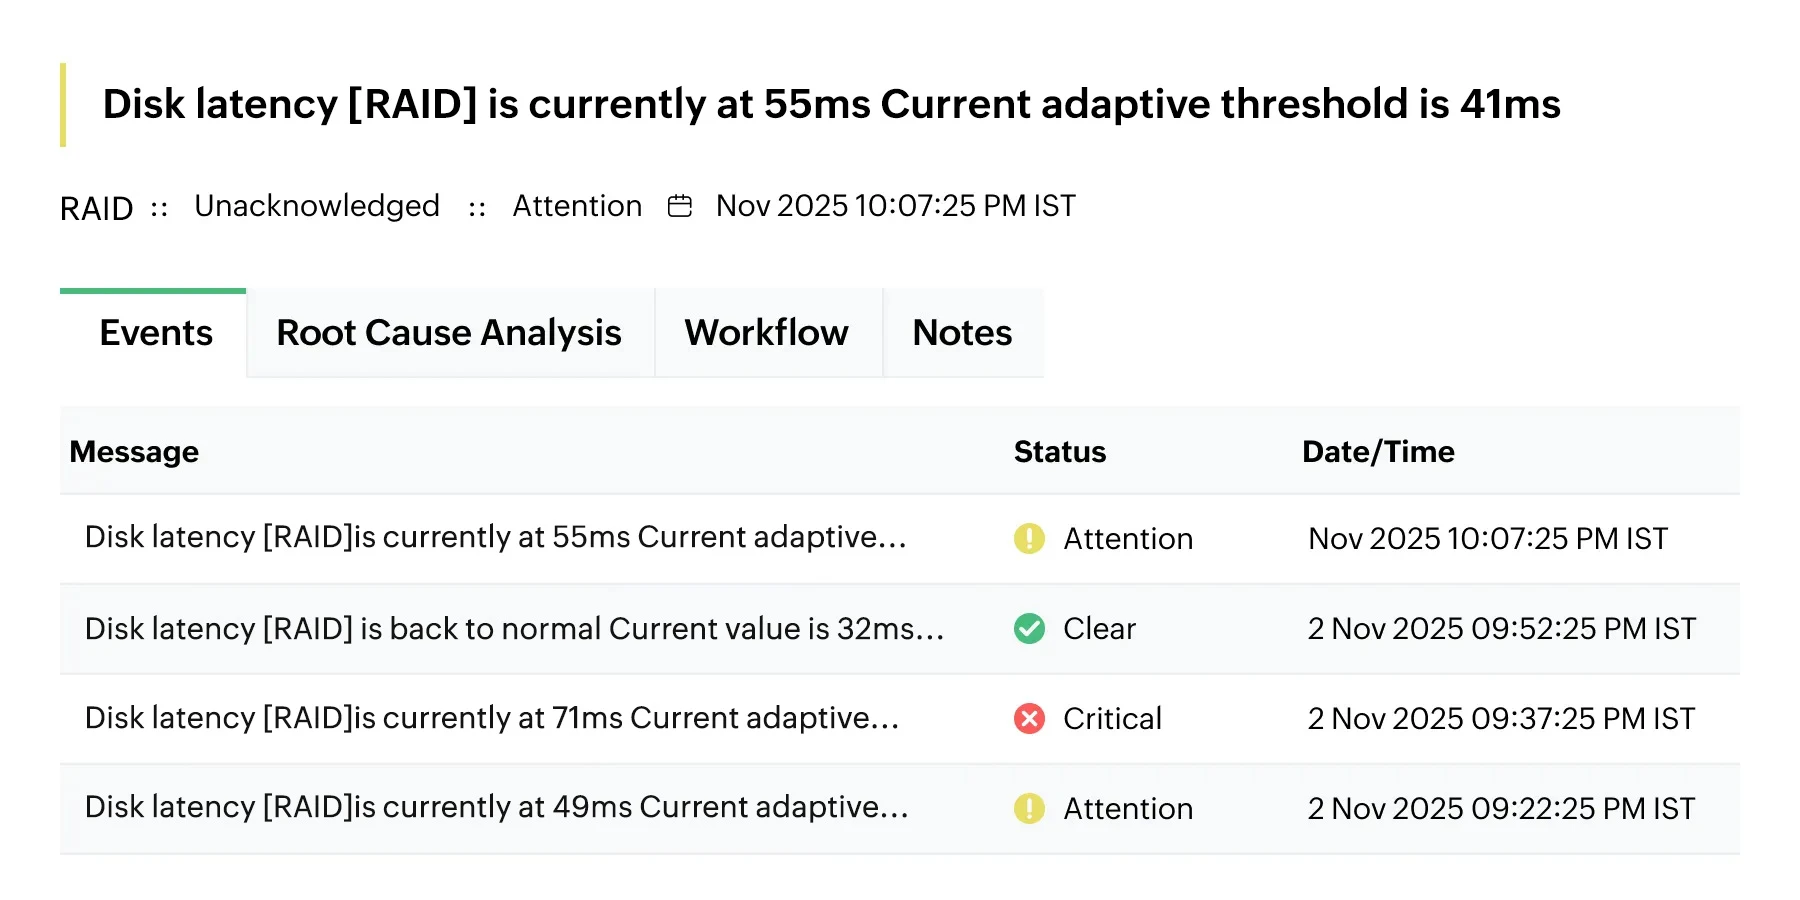
Monitor critical NetApp metrics—like latency, throughput, and IOPS—using intelligent, multi-level thresholds. Leverage ML-based Adaptive Thresholds to learn dynamic baselines and reduce noise, triggering context-rich alerts that pinpoint exactly where performance is degrading before business applications are impacted.
Root cause analysis
Visualize complex dependencies between NetApp arrays, LUNs, and volumes with dynamic infrastructure maps. Accelerate troubleshooting by stacking performance graphs—such as CPU vs. Disk Latency—on a single timeline to correlate anomalies and identify the true root cause of storage bottlenecks instantly.
Automated workflows
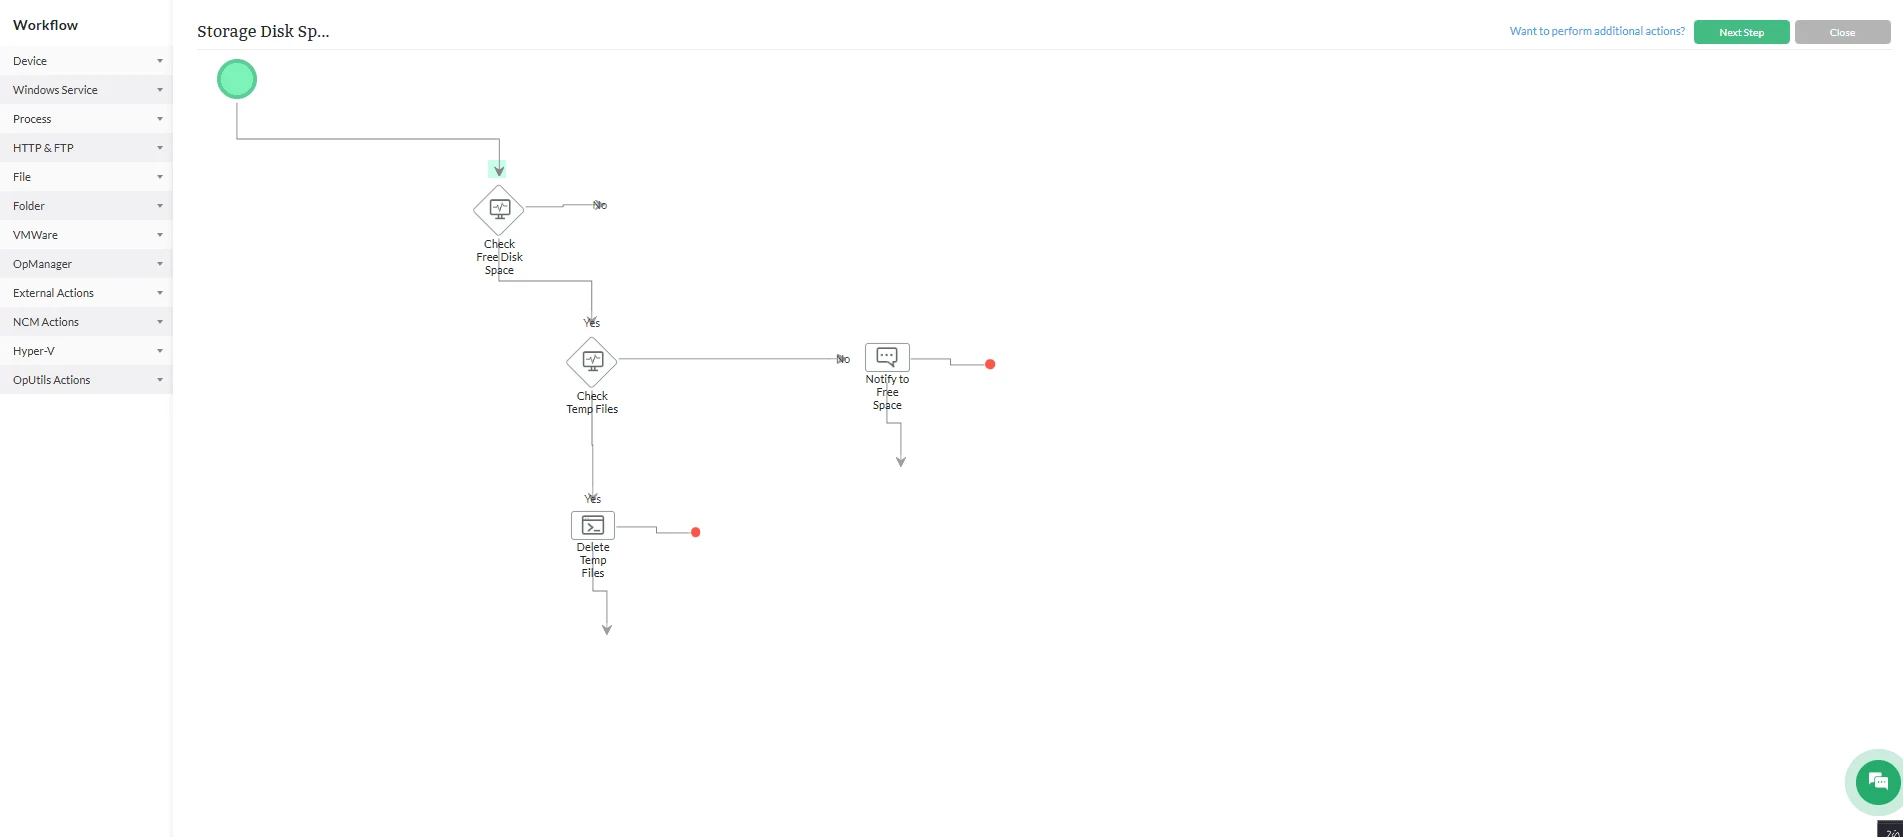
Eliminate repetitive manual tasks using a code-free, drag-and-drop workflow builder with 70+ out-of-the-box actions. Automatically trigger remediation scripts—such as clearing old snapshots, restarting services, or expanding volume capacity—the moment a storage alert is triggered, drastically reducing Mean Time to Repair (MTTR).
These workflows can then be triggered in response to an alarm: Say from your NetApp storage device about declining storage capacity, and can trigger actions: Like executing a script to increase space.
Reports and dashboards
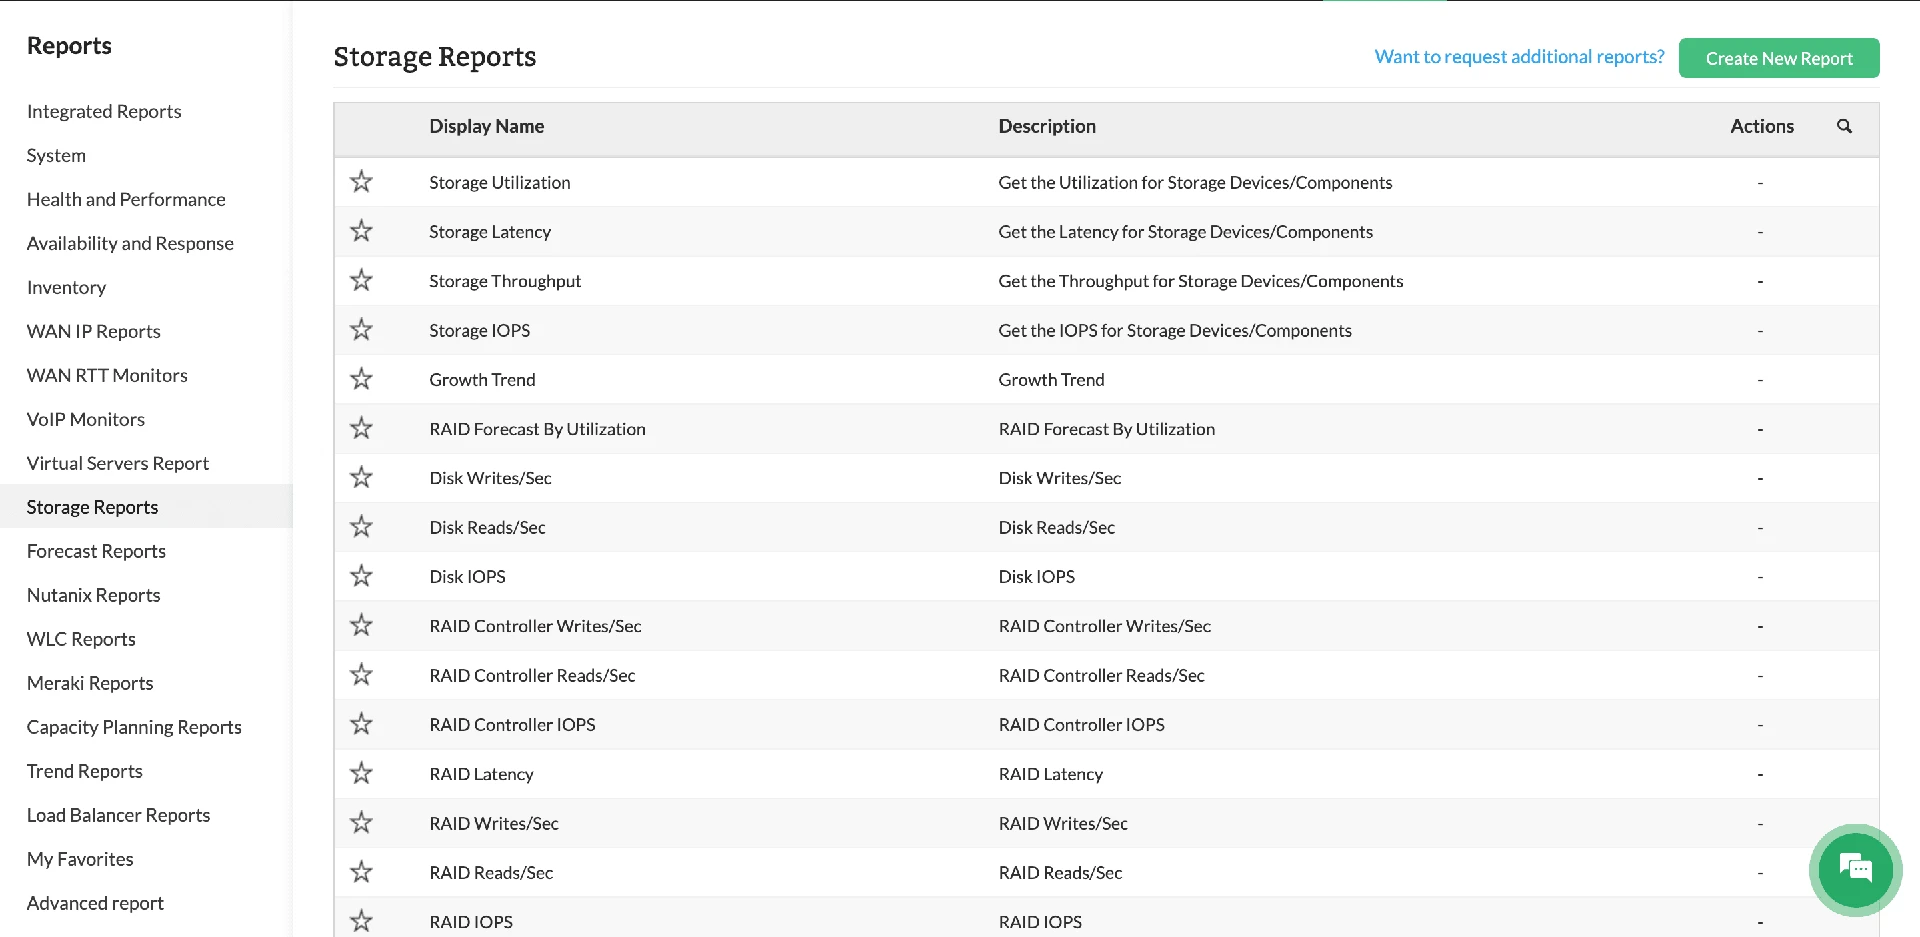
Gain complete visibility with a dedicated NetApp storage dashboard and over 18 pre-configured reports for capacity planning and health auditing. Customize widgets to track specific volumes or LUNs, and generate scheduled reports to validate SLAs and forecast future storage growth requirements accurately.
ML-driven monitoringfor NetApp systems
Calculate, set, and update alarm thresholds with ML
OpManager's in-built ML engine collects performance data, calculates alarm thresholds, and updates them on an hourly basis for all monitored performance metrics. This reduces the manual effort required from your side to set and update thresholds, improves monitoring accuracy, and reduces false positives.
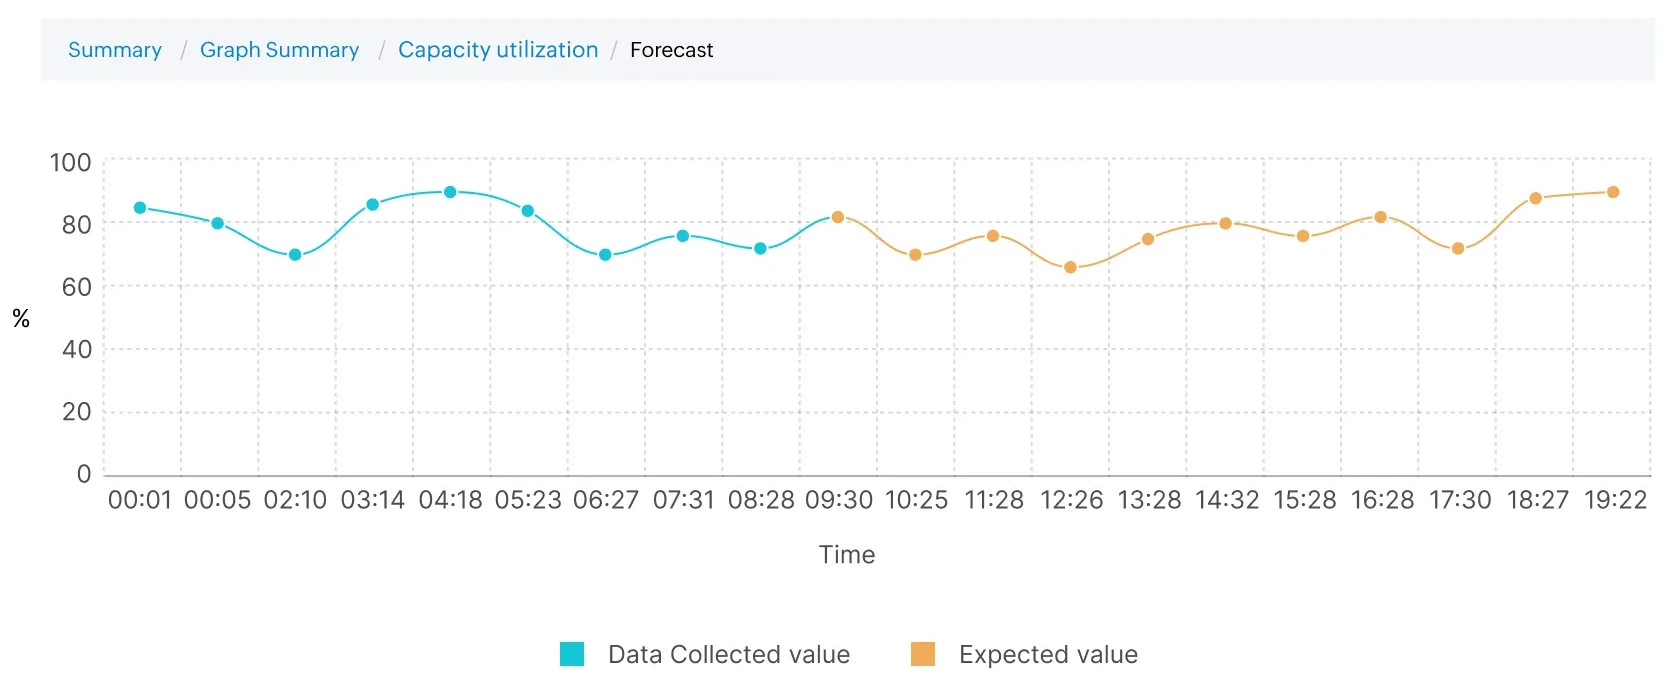
Forecast storage performance trends over time
OpManager also forecasts storage performance trends in the future with its ML algorithms. You can prepare for impending resource crunches, identify bottlenecks, and prevent storage performance issues by tracking metrics like CPU, memory, throughput.
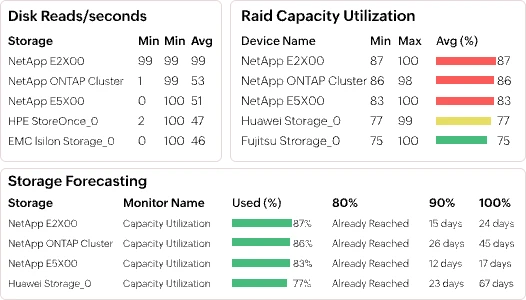
Predict storage capacity utilization with forecasts
OpManager leverages dedicated forecast reports to highlight devices with higher levels of resource utilization. Forecast reports track metrics like CPU, memory, and storage space and calculates the number of days left till the resource usage reaches 80%, 90%, and 100% of the available capacity.
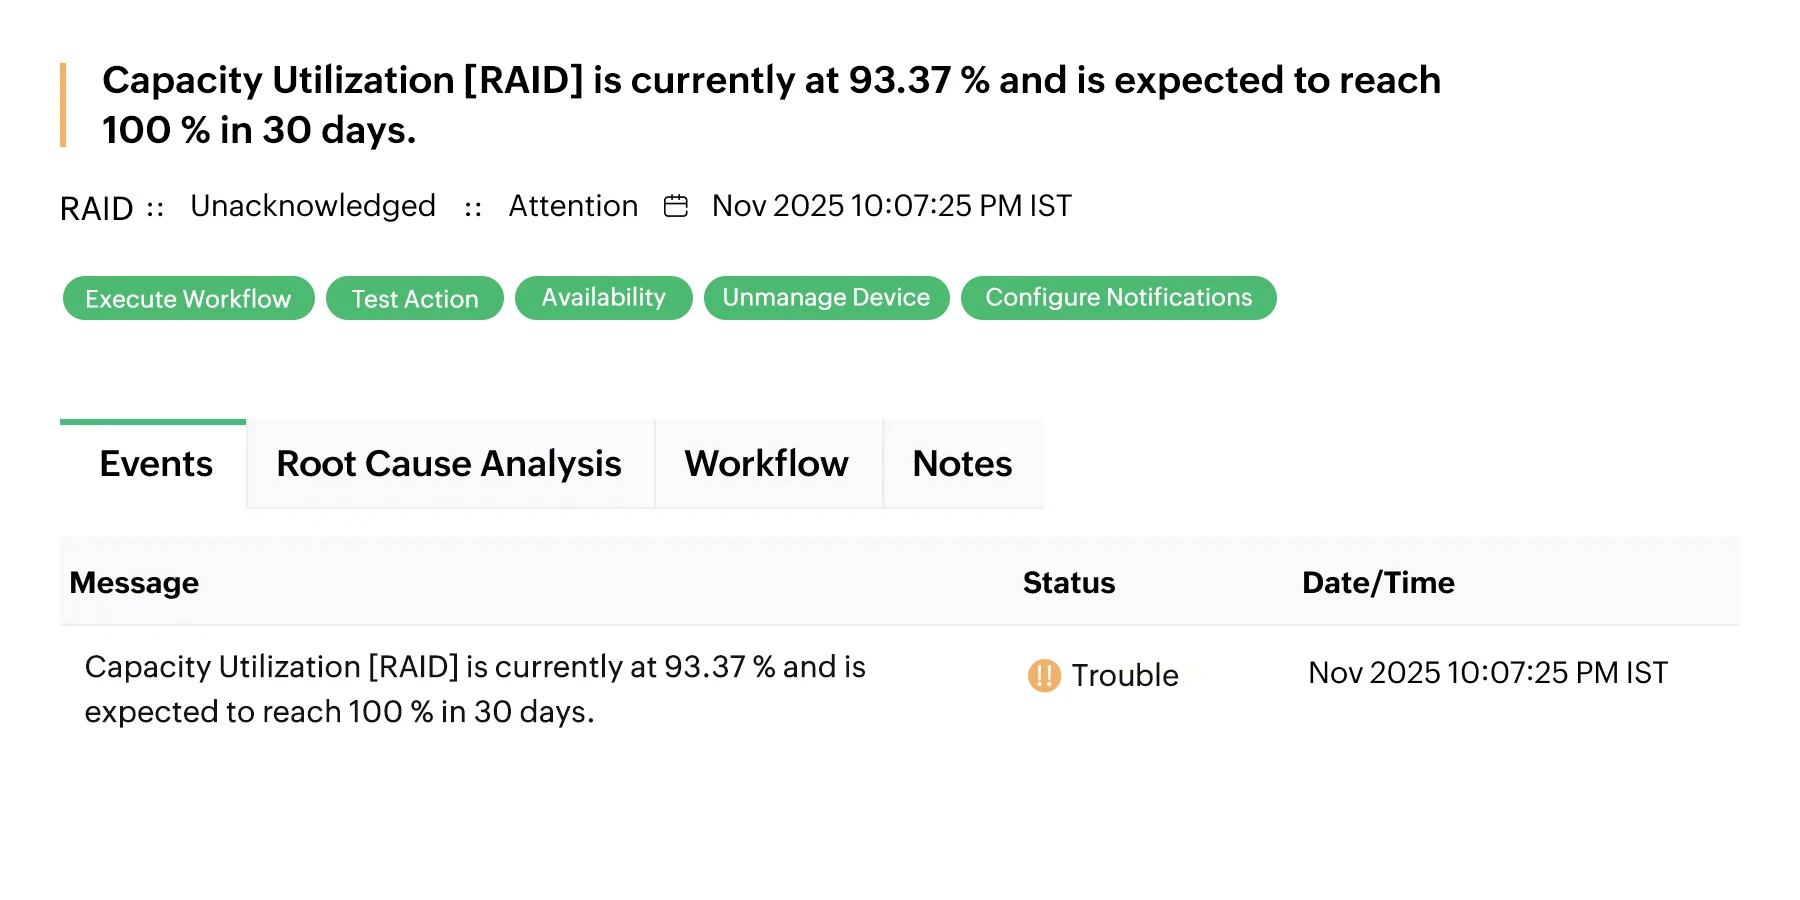
Get proactive alarms for low storage capacity
Monitor NetApp storage capacity proactively with OpManager's forecast alarms. OpManager triggers proactive alerts when the predictive forecasting analysis indicates that the storage capacity is expected to reach a critical utilization threshold within a specified timeframe.
Why choose OpManager Nexus for NetApp monitoring?
Unfolding reasons why 1M+ network admins trust us
Multi-vendor support
Easily integrate NetApp monitoring into your multi-vendor setup, for a smooth, unified monitoring experience.
Third-party integration
Leverage third-party apps like help desk and service management tools to streamline your network management tasks.
Webhook support
Real-time webhook notifications, ensuring instant and efficient data flow to external systems.
Scalability & Flexibility
Scalable solution that fits everything from small setups to large enterprise infrastructures.
Comprehensive storage monitoring software
OpManager extends its support for 25+ storage vendors in the market and provides dedicated KPIs and tracking for diverse device types and models.
Frequently asked questions
Can I monitor NetApp HCI and NetApp servers with OpManager?
Although NetApp discontinued their HCI and server models in 2022, many organizations continue deploying their solutions. With OpManager's custom SNMP support, you can monitor NetApp's complete lineup of solutions, including their servers and HCI. Moreover, OpManager also comes pre-loaded with device templates for NetApp. This means that there's minimal manual work required to set up monitoring for NetApp. OpManager will automatically identify the devices and curate performance monitors.