Network Operations Center (NOC) Monitoring
Network Operations Center Monitoring Tool - ManageEngine OpManager
 Download OpManager's datasheet to learn more about its features & functions.
What is the purpose of a NOC?
The goal of any NOC is to maintain optimal network performance and availability and to ensure continuous uptime of business-critical services. The NOC manages a host of critical activities, including:
- Monitor network, servers, and applications for health and performance
- Analyze bandwidth and proactively identify bottlenecks
- Continuously monitor and analyze security threats and attacks
- Modify network configurations per the business need
- Pickup faults and troubleshoot quickly to reduce the mean time to repair
Requirements of a NOC team
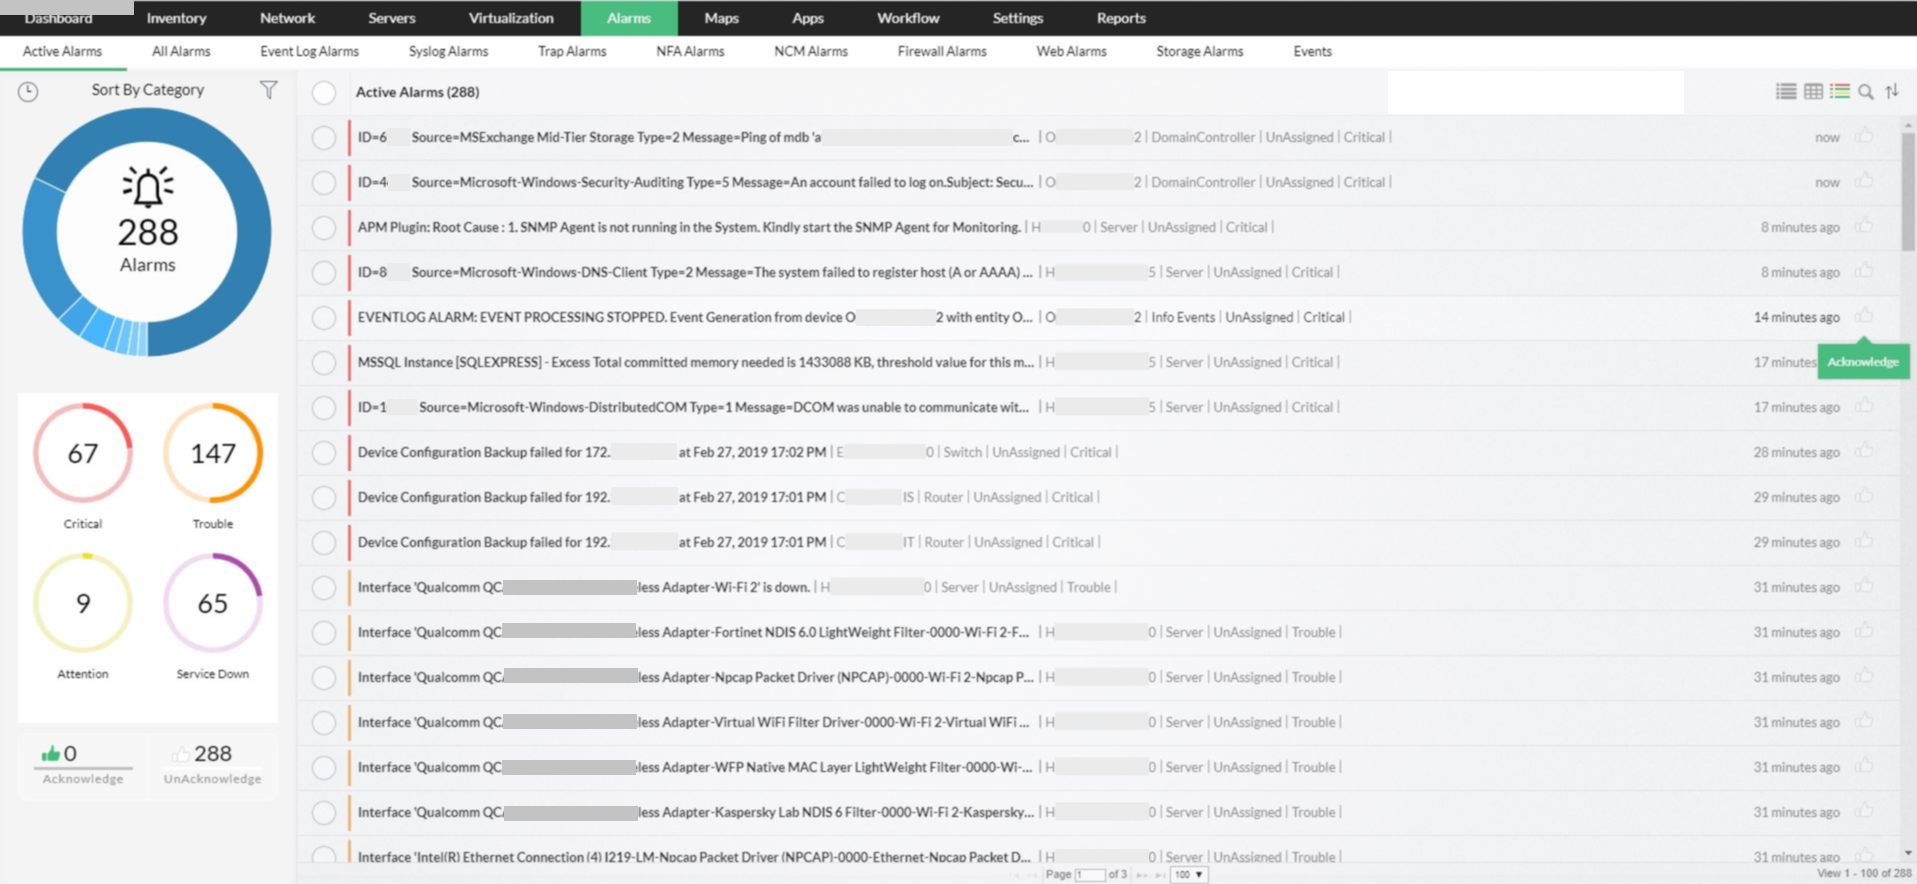
Instant fault notification: The NOC team continuously works on the faults detected by the various monitoring solutions. Usually, companies will deploy network, server, and application monitoring solutions. All alerts from these solutions are handled by the NOC and alerts are provided in real-time.
Live health and performance data: NOCs typically use real-time maps and comprehensive consoles, known as the NOC dashboard, to collect and track the performance of network devices.
Rich set of dashboards with color codes: NOC personnel continuously monitor the NOC dashboards, often presented on large screens that display color variations to differentiate key metrics and critical data.
NOC monitoring with OpManager
Monitor network performance in real-time - OpManager, with its NOC network monitoring functionality, enables IT admins to instantly report on device performance in real-time without having to use another tool to remotely access the problem device. Learn More »
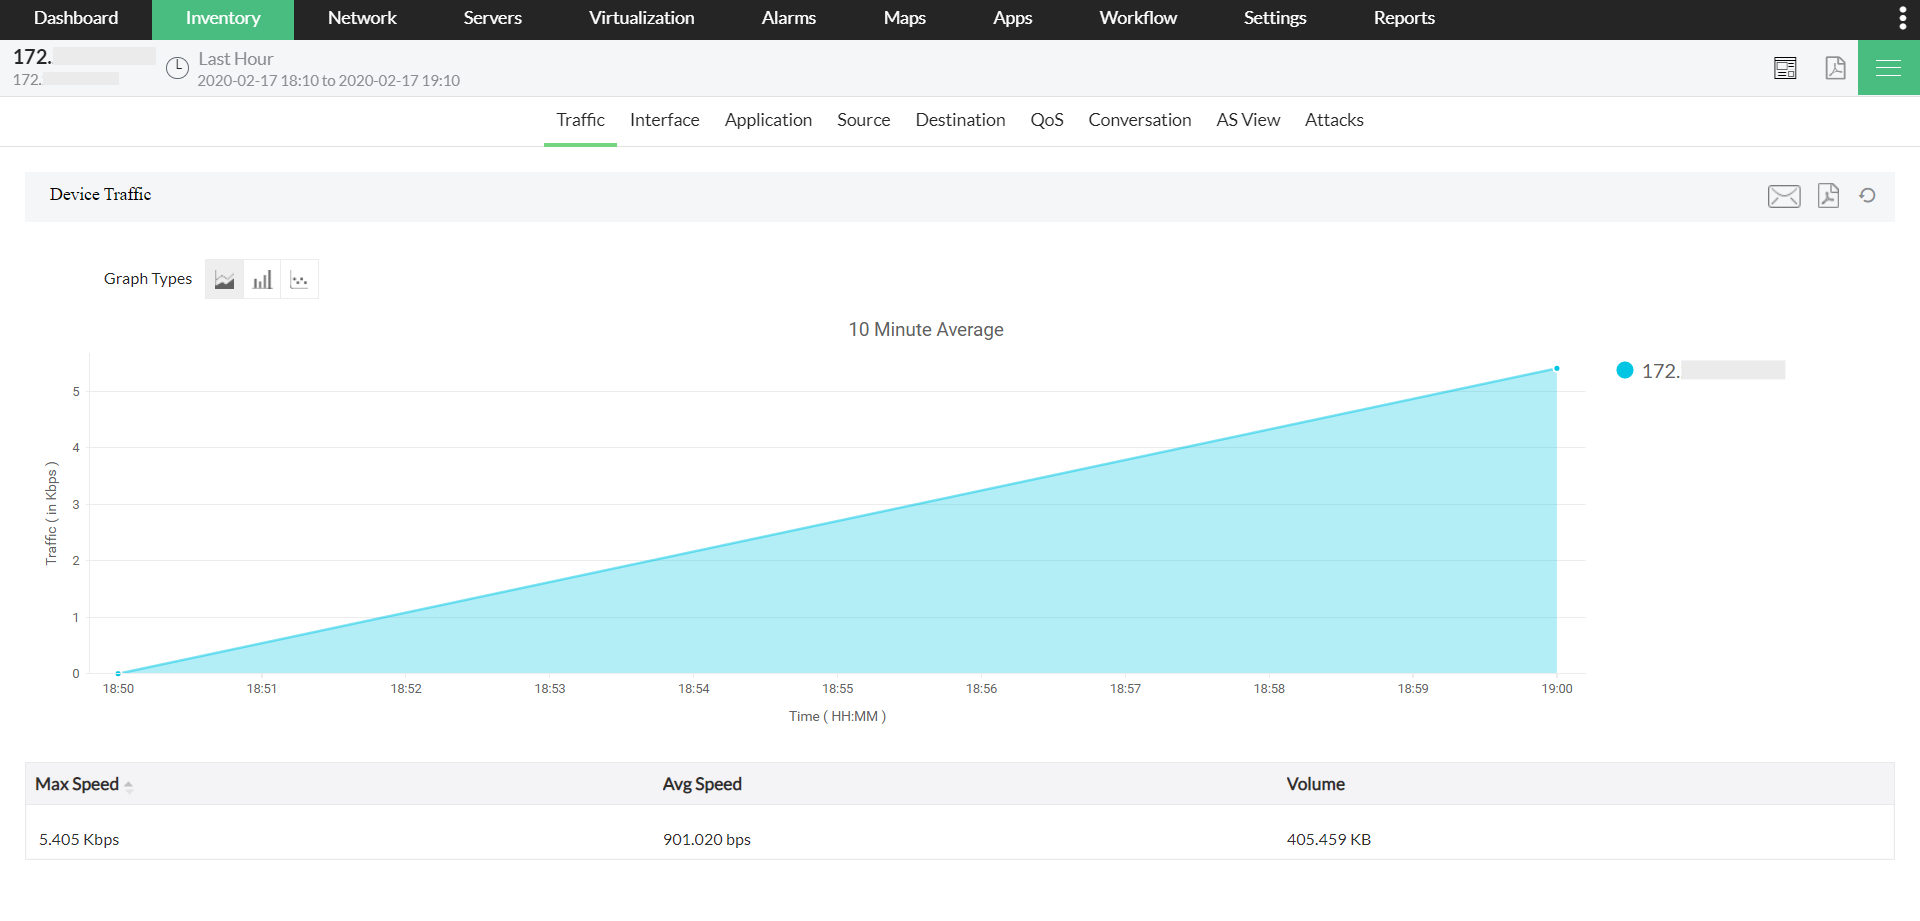
Identify bandwidth hogs - OpManager provides in-depth bandwidth usage details to help quickly identify any unscrupulous WAN usage, and expose virus attacks using its Netflow Analyzer add-on. Also, it helps in capacity planning. Learn More »
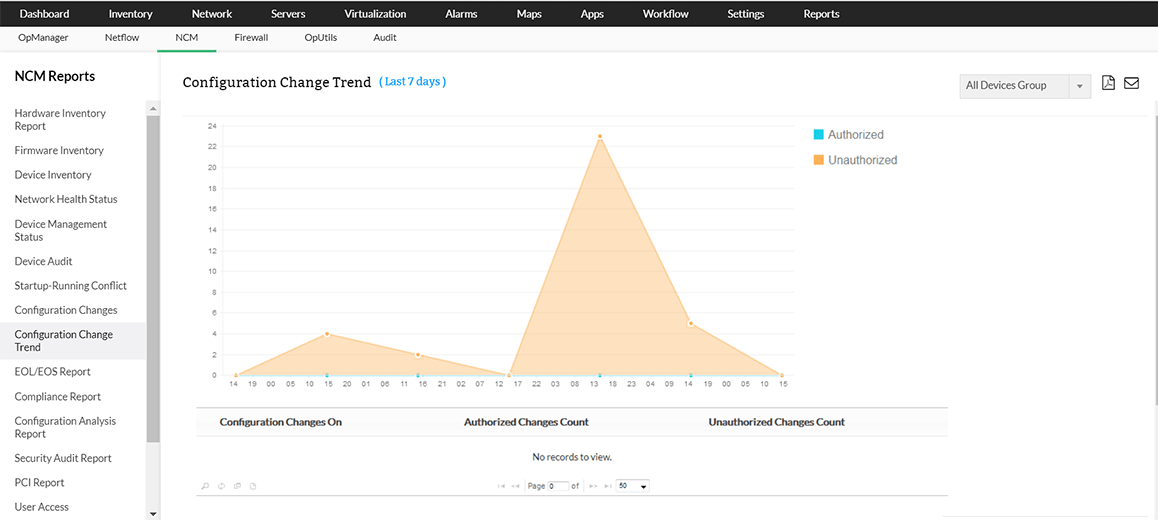
Manage config changes - OpManger manages all the configuration changes on your network devices using its Network Configurations Manager add-on. Learn More »
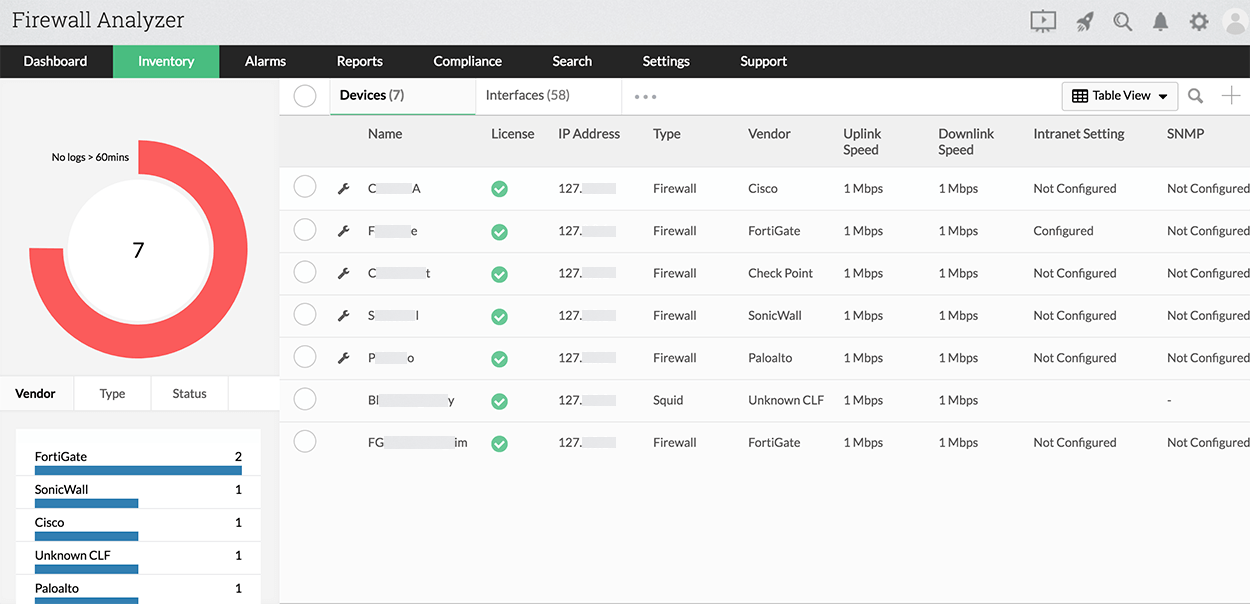
Analyze firewall security and logs - OpManager helps you effectively manage and monitor your firewall logs using its Firewall Analyzer add-on. It also lets you optimize your firewall rules based on its usage, and manage compliance in your firewall devices. Learn More »
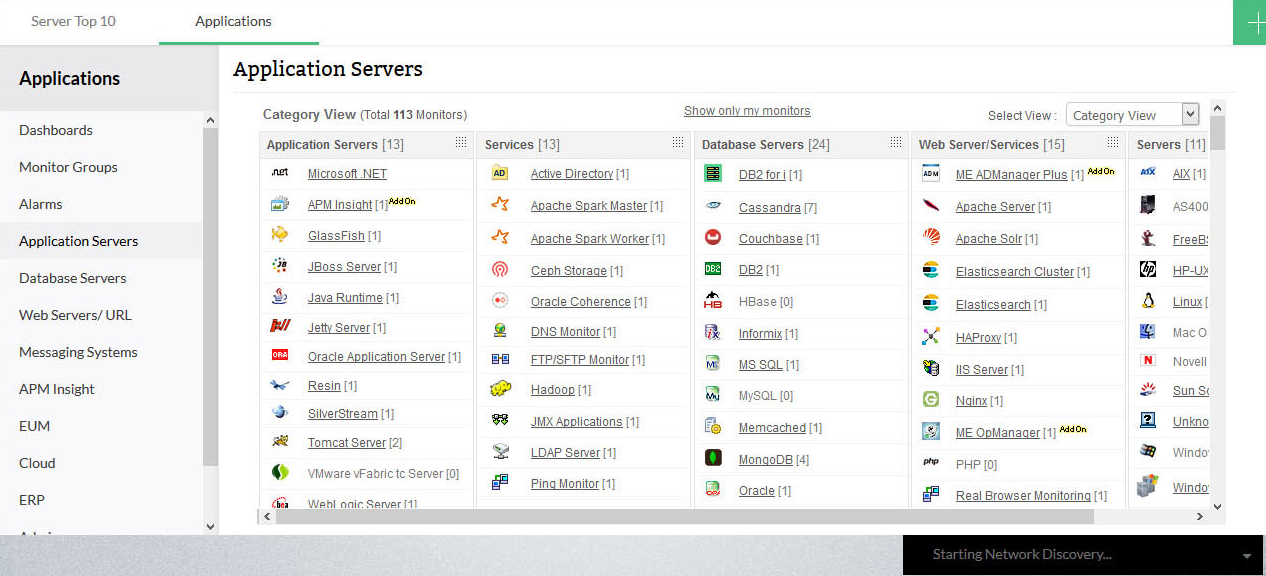
Monitor application performance - OpManager, using its APM Plug-in, monitors mission-critical applications such as Oracle, SAP, Websphere, Microsoft .NET; databases such as Cassandra, Sybase; plus cloud applications such as Amazon and Windows Azure. Learn More »
OpManager's NOC monitor features that every NOC admin loves:
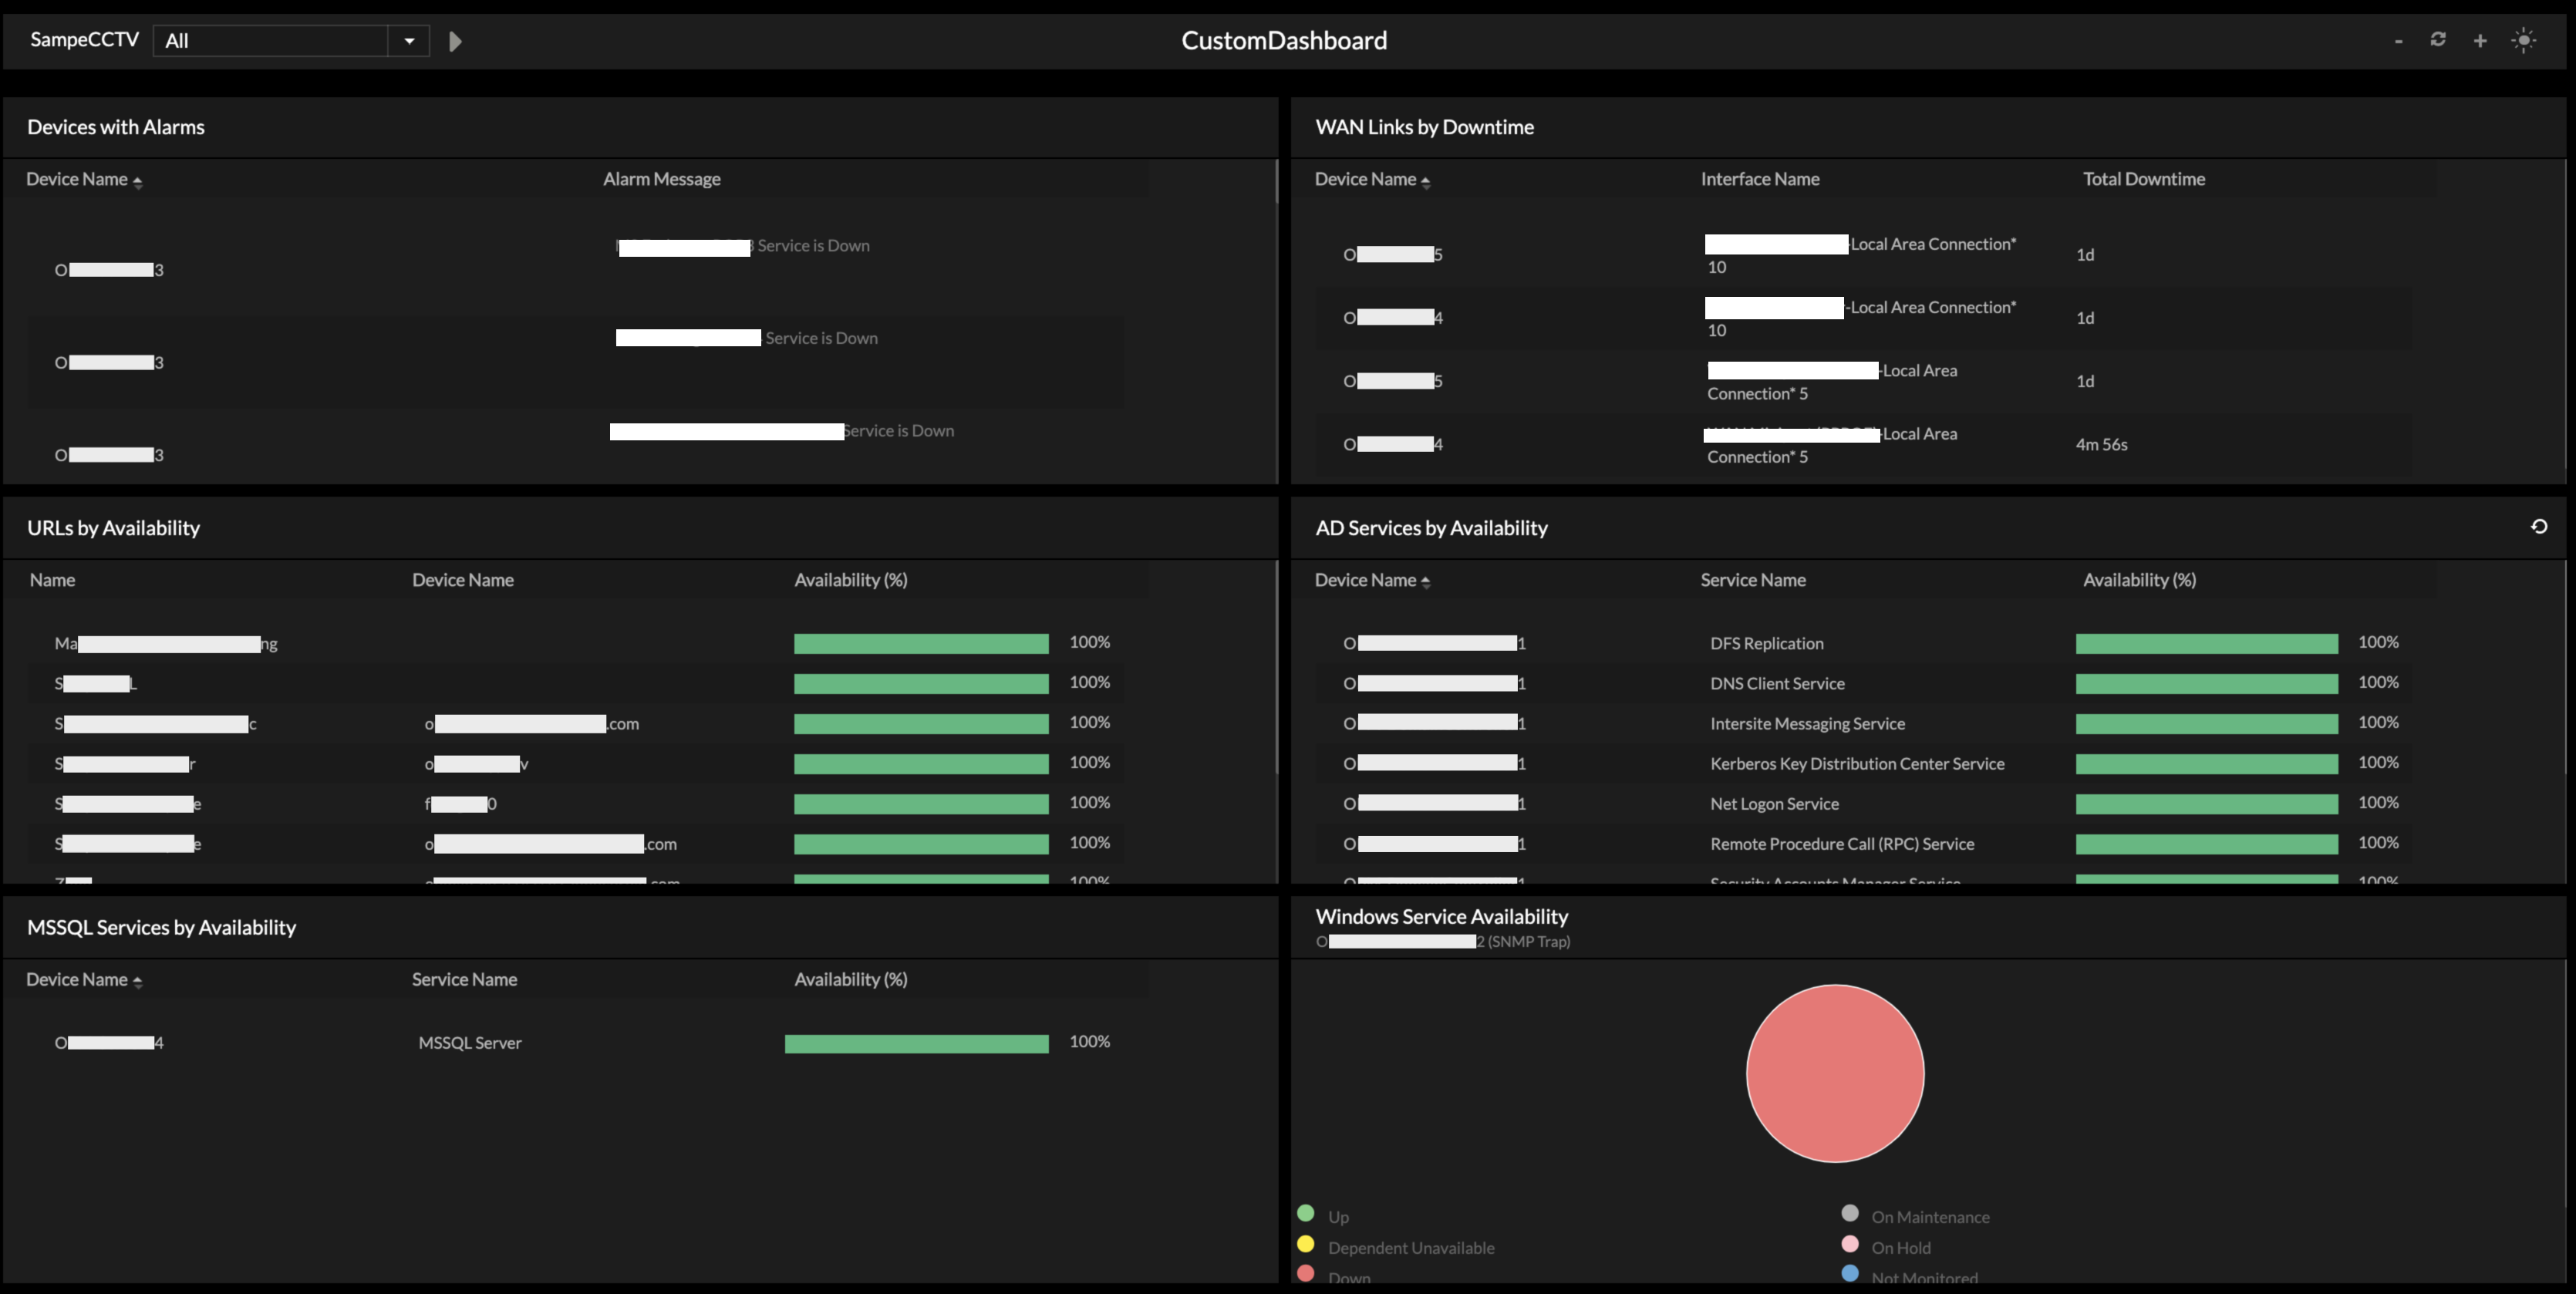
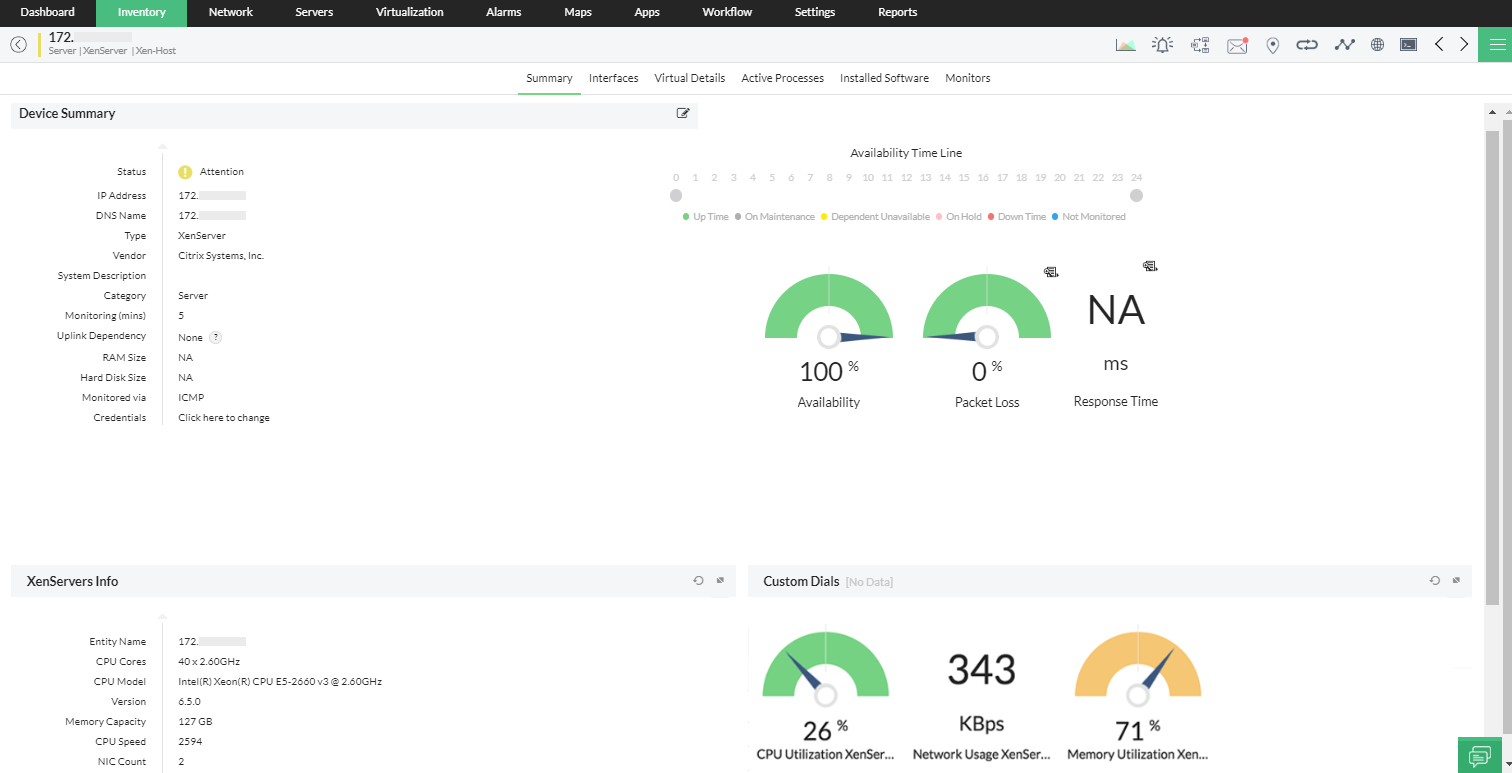
NOC dashboards and NOC views: OpManager provides handy, and powerful customizable NOC dashboards and NOC views that display the immediate status of your devices, at-a-glance reports, business views, and more.
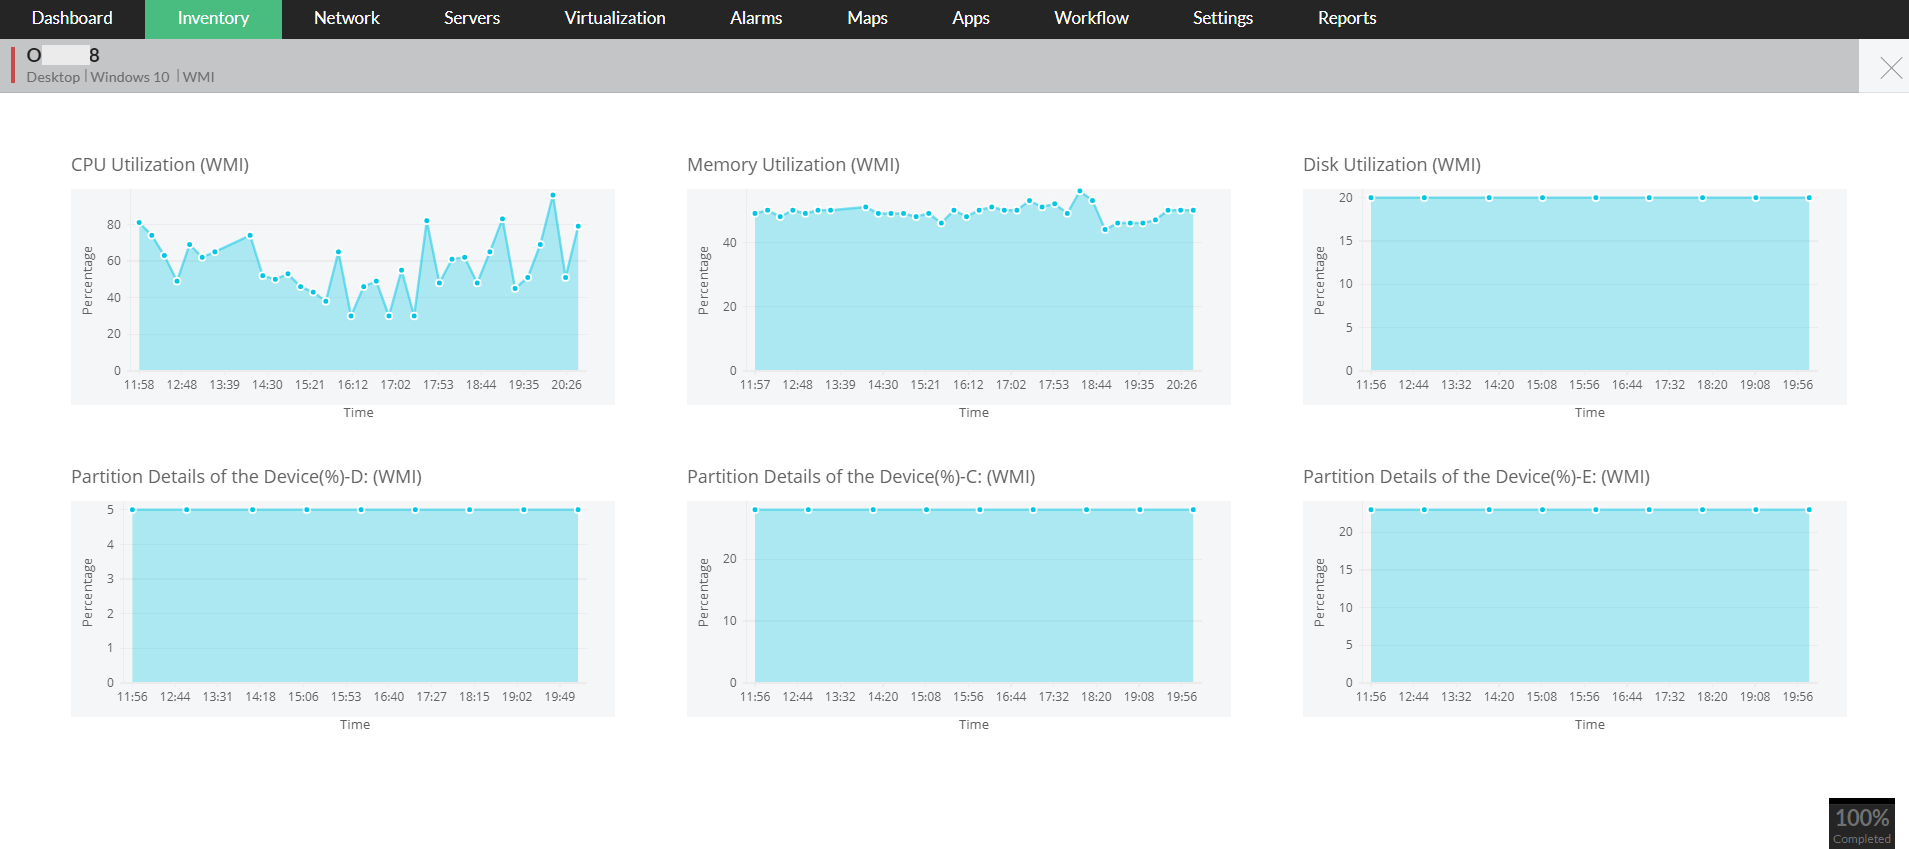
Real-time performance graphs: With OpManager's real-time graphs, NOC admins receive:
- Real-time statistics on device CPU and Memory Utilization
- Up-to-the-second information on any performance metric of a device
- Up-to-the-second information on any performance metric of a device
Email, SMS, web UI notification of faults: OpManager's notification mechanism can notify you through its web UI, as well as through SMS and/or email whenever an alarm occurs.
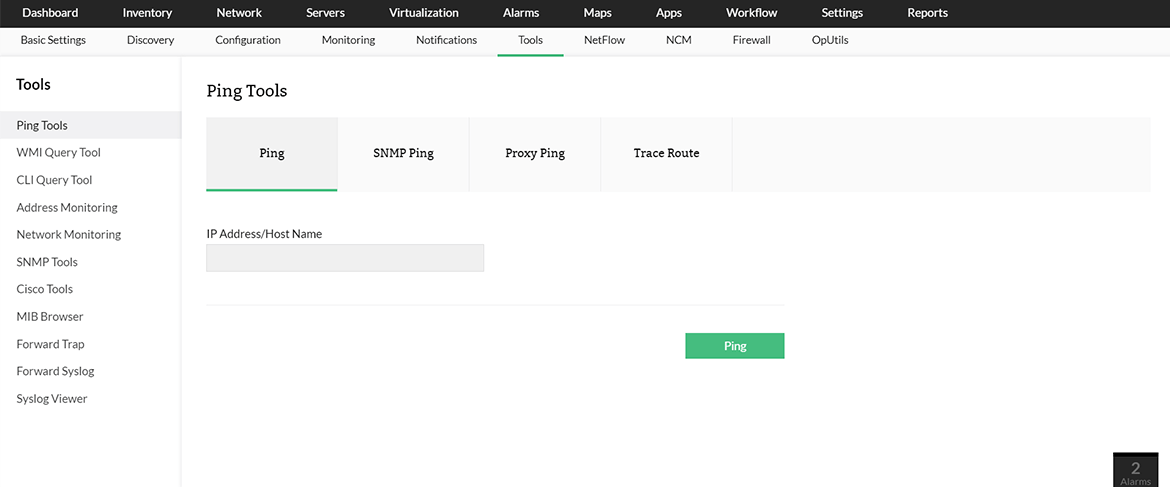
Handy troubleshooting tools: OpManager's diagnostic and troubleshooting tools help you to perform first- and second-level troubleshooting based on the nature of the network fault.
- ICMP Ping: ICMP Ping is a network ping tool in OpManager that identifies whether the device is mapped on the network or not.
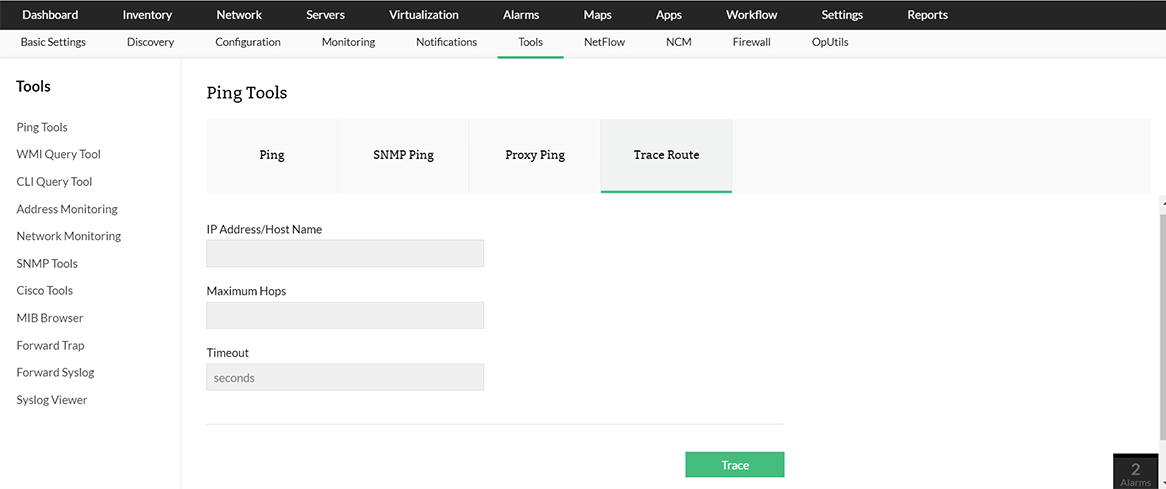
- Trace Route: When you troubleshoot a "device down" alert using Ping and the device fails to respond, you can use the Trace Route feature as a quick network testing tool to determine if the device is not reachable because of a failure in the path. Trace the route from OpManager to the destination device, check the number of hops to the monitored device, and spot the exact point of delay or outage. This serves as first-level troubleshooting and, based on the response, you can switch to other monitoring tools provided in OpManager to drill down to discover more about a fault.
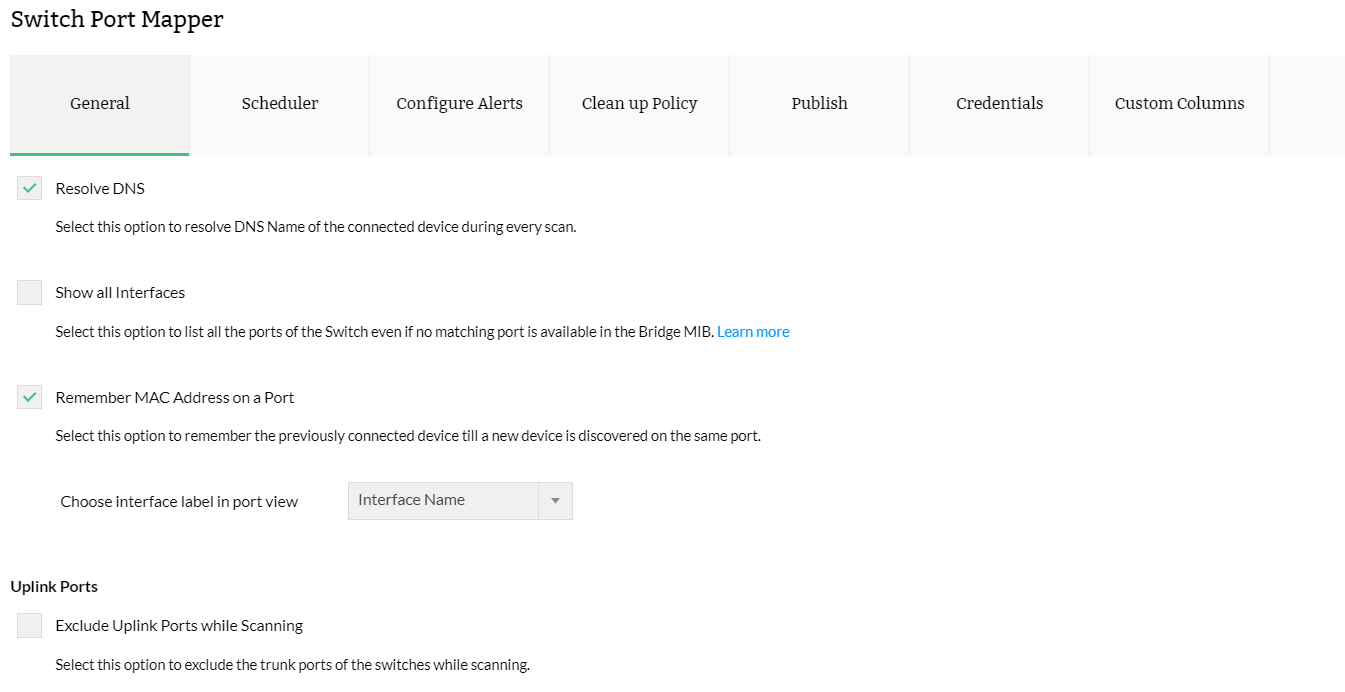
- Switch Port Mapper: OpManager's Switch Port Mapper helps you see the port-wise connectivity of devices to the network switches, which is necessary to help troubleshoot high traffic issues. The Switch Port Mapper of the network monitoring tool gives you the MAC address, IP Address, and DNS names of the devices connected to the switch.
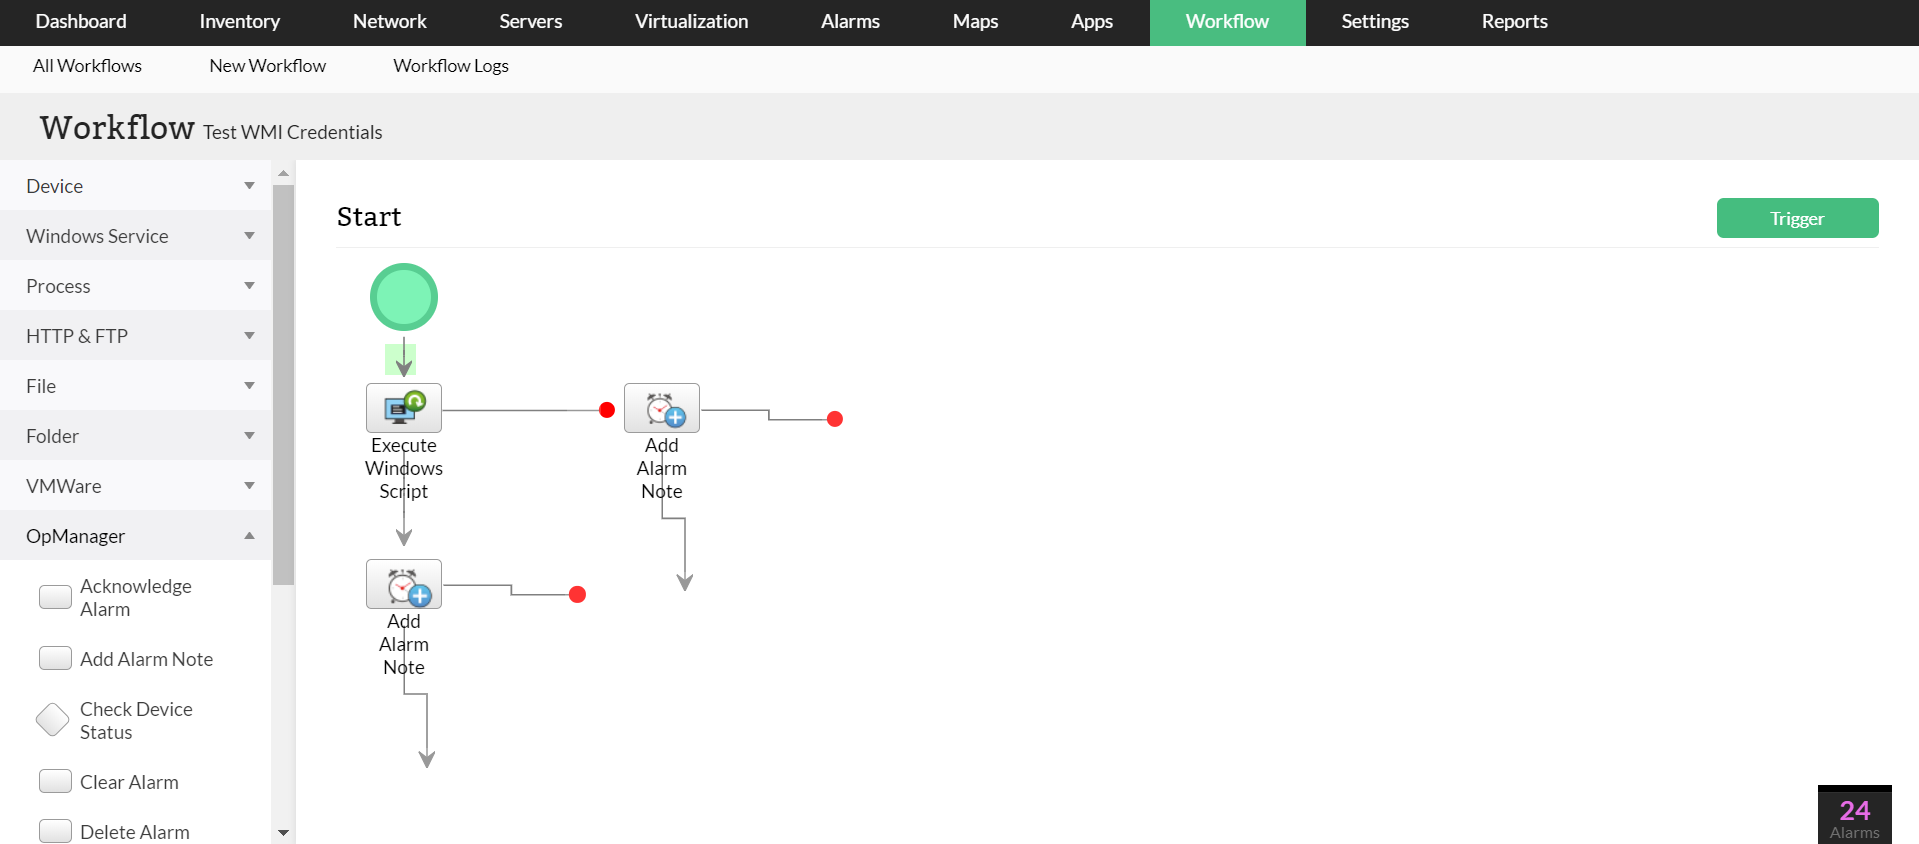
Workflow automation: OpManager's code-free and out-of-the-box IT automation workflows offer predefined checks and actions. These include an agile and flexible drag-n-drop workflow builder. Workflow automation helps you:
- Initiate IT workflow on network faults, or on a routine basis.
- Manage services, processes, files, and folders of Windows servers and desktops.
- Record the IT workflow procedures as an XML and ensure structured practices across IT.