
Instantly discover and poll the availability of any devices in your network including routers, switches, servers, or printers. OpManager can ping devices with SNMP, ICMP, and TCP requests and generate alerts when they stop responding.
Monitor the uptime and health of your Windows and Linux servers. Whether they are application servers, webservers, domain controllers, virtual hosts, or VMs, OpManager has dedicated uptime and performance monitors.
Track the uptime of your URLs, host servers, and services with frequent status polls. OpManager monitors URLs from your host servers or other devices in your network and alerts you when they aren't reachable.
Monitor the uptime of critical services and processes with status polls. If critical services go down, automatically configure OpManager to restart the service or the server.
Leverage Cisco IPSLA technology to simulate VoIP or WAN traffic between your network links and monitor network uptime and quality. Identify and mitigate performance bottlenecks proactively to eliminate unplanned downtime.
Monitor the uptime and performance of critical applications, databases, and cloud services with OpManager's Application manager plugin to secure user experience from the top-down.
The best uptime monitoring tools notify users of outages, but they are only as good as their alerts and notifications. In addition to color coded alerts and a dedicated Alarms tab, OpManager provides multiple notification channels and integrations with alerting and ITSM tools to notify you of downtime.
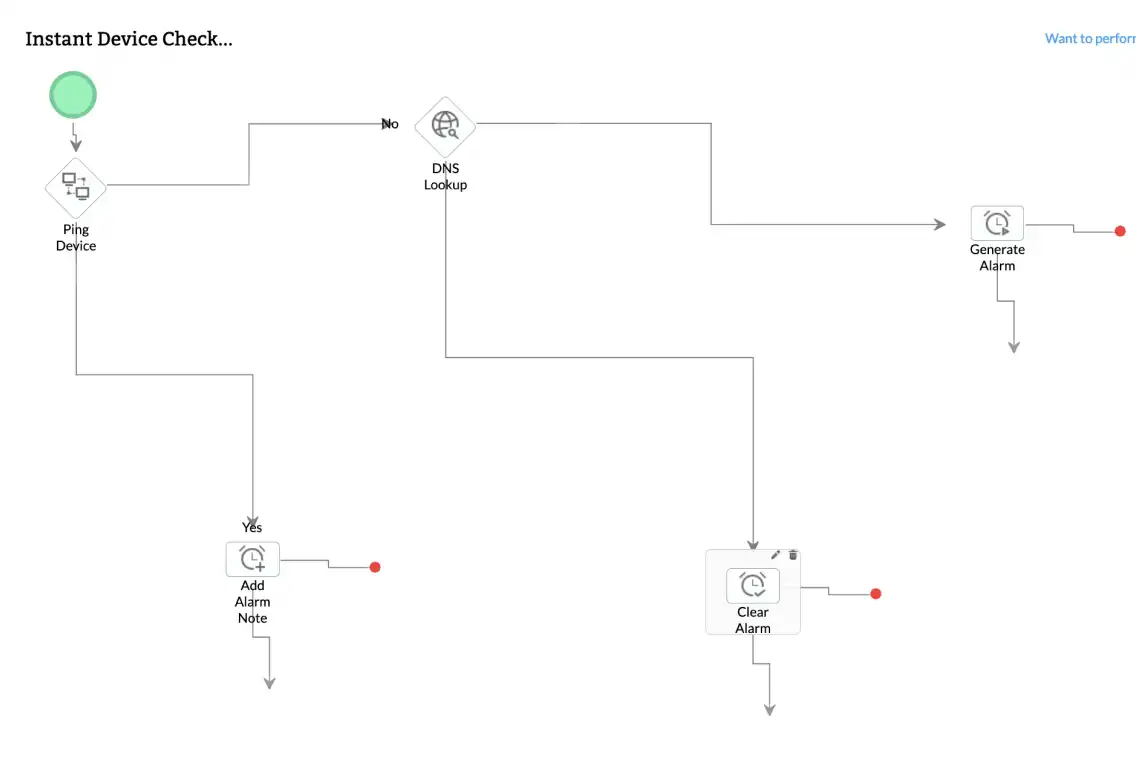
Get Started - It's FreeWhen your devices, services, or websites go down, there's no time to lose. SLA terms are often stringent and customer expectations high. OpManager's automated workflows are useful for performing quick troubleshooting actions. More than 70 actions, as well as an interactive drag-and-drop UI, are featured through Workflows that enable users to sequentially arrange actions to be performed including:
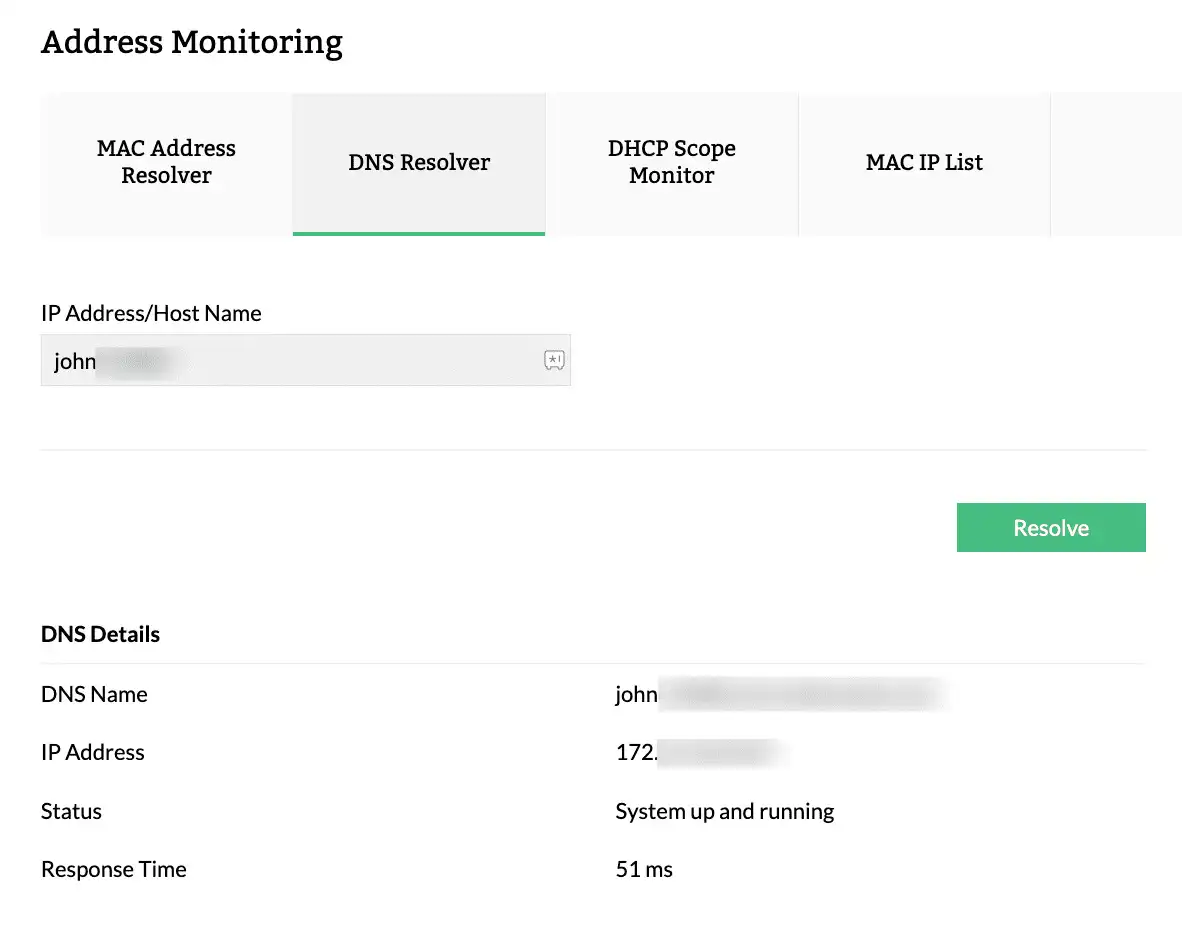
Troubleshooting tools can help diagnose and resolve service issues to prevent prolonged downtime. OpManager incorporates advanced network troubleshooting tools to augment its uptime monitoring. IT teams can check the reachability of device, resolve DNS and MAC addresses and more from a single console.
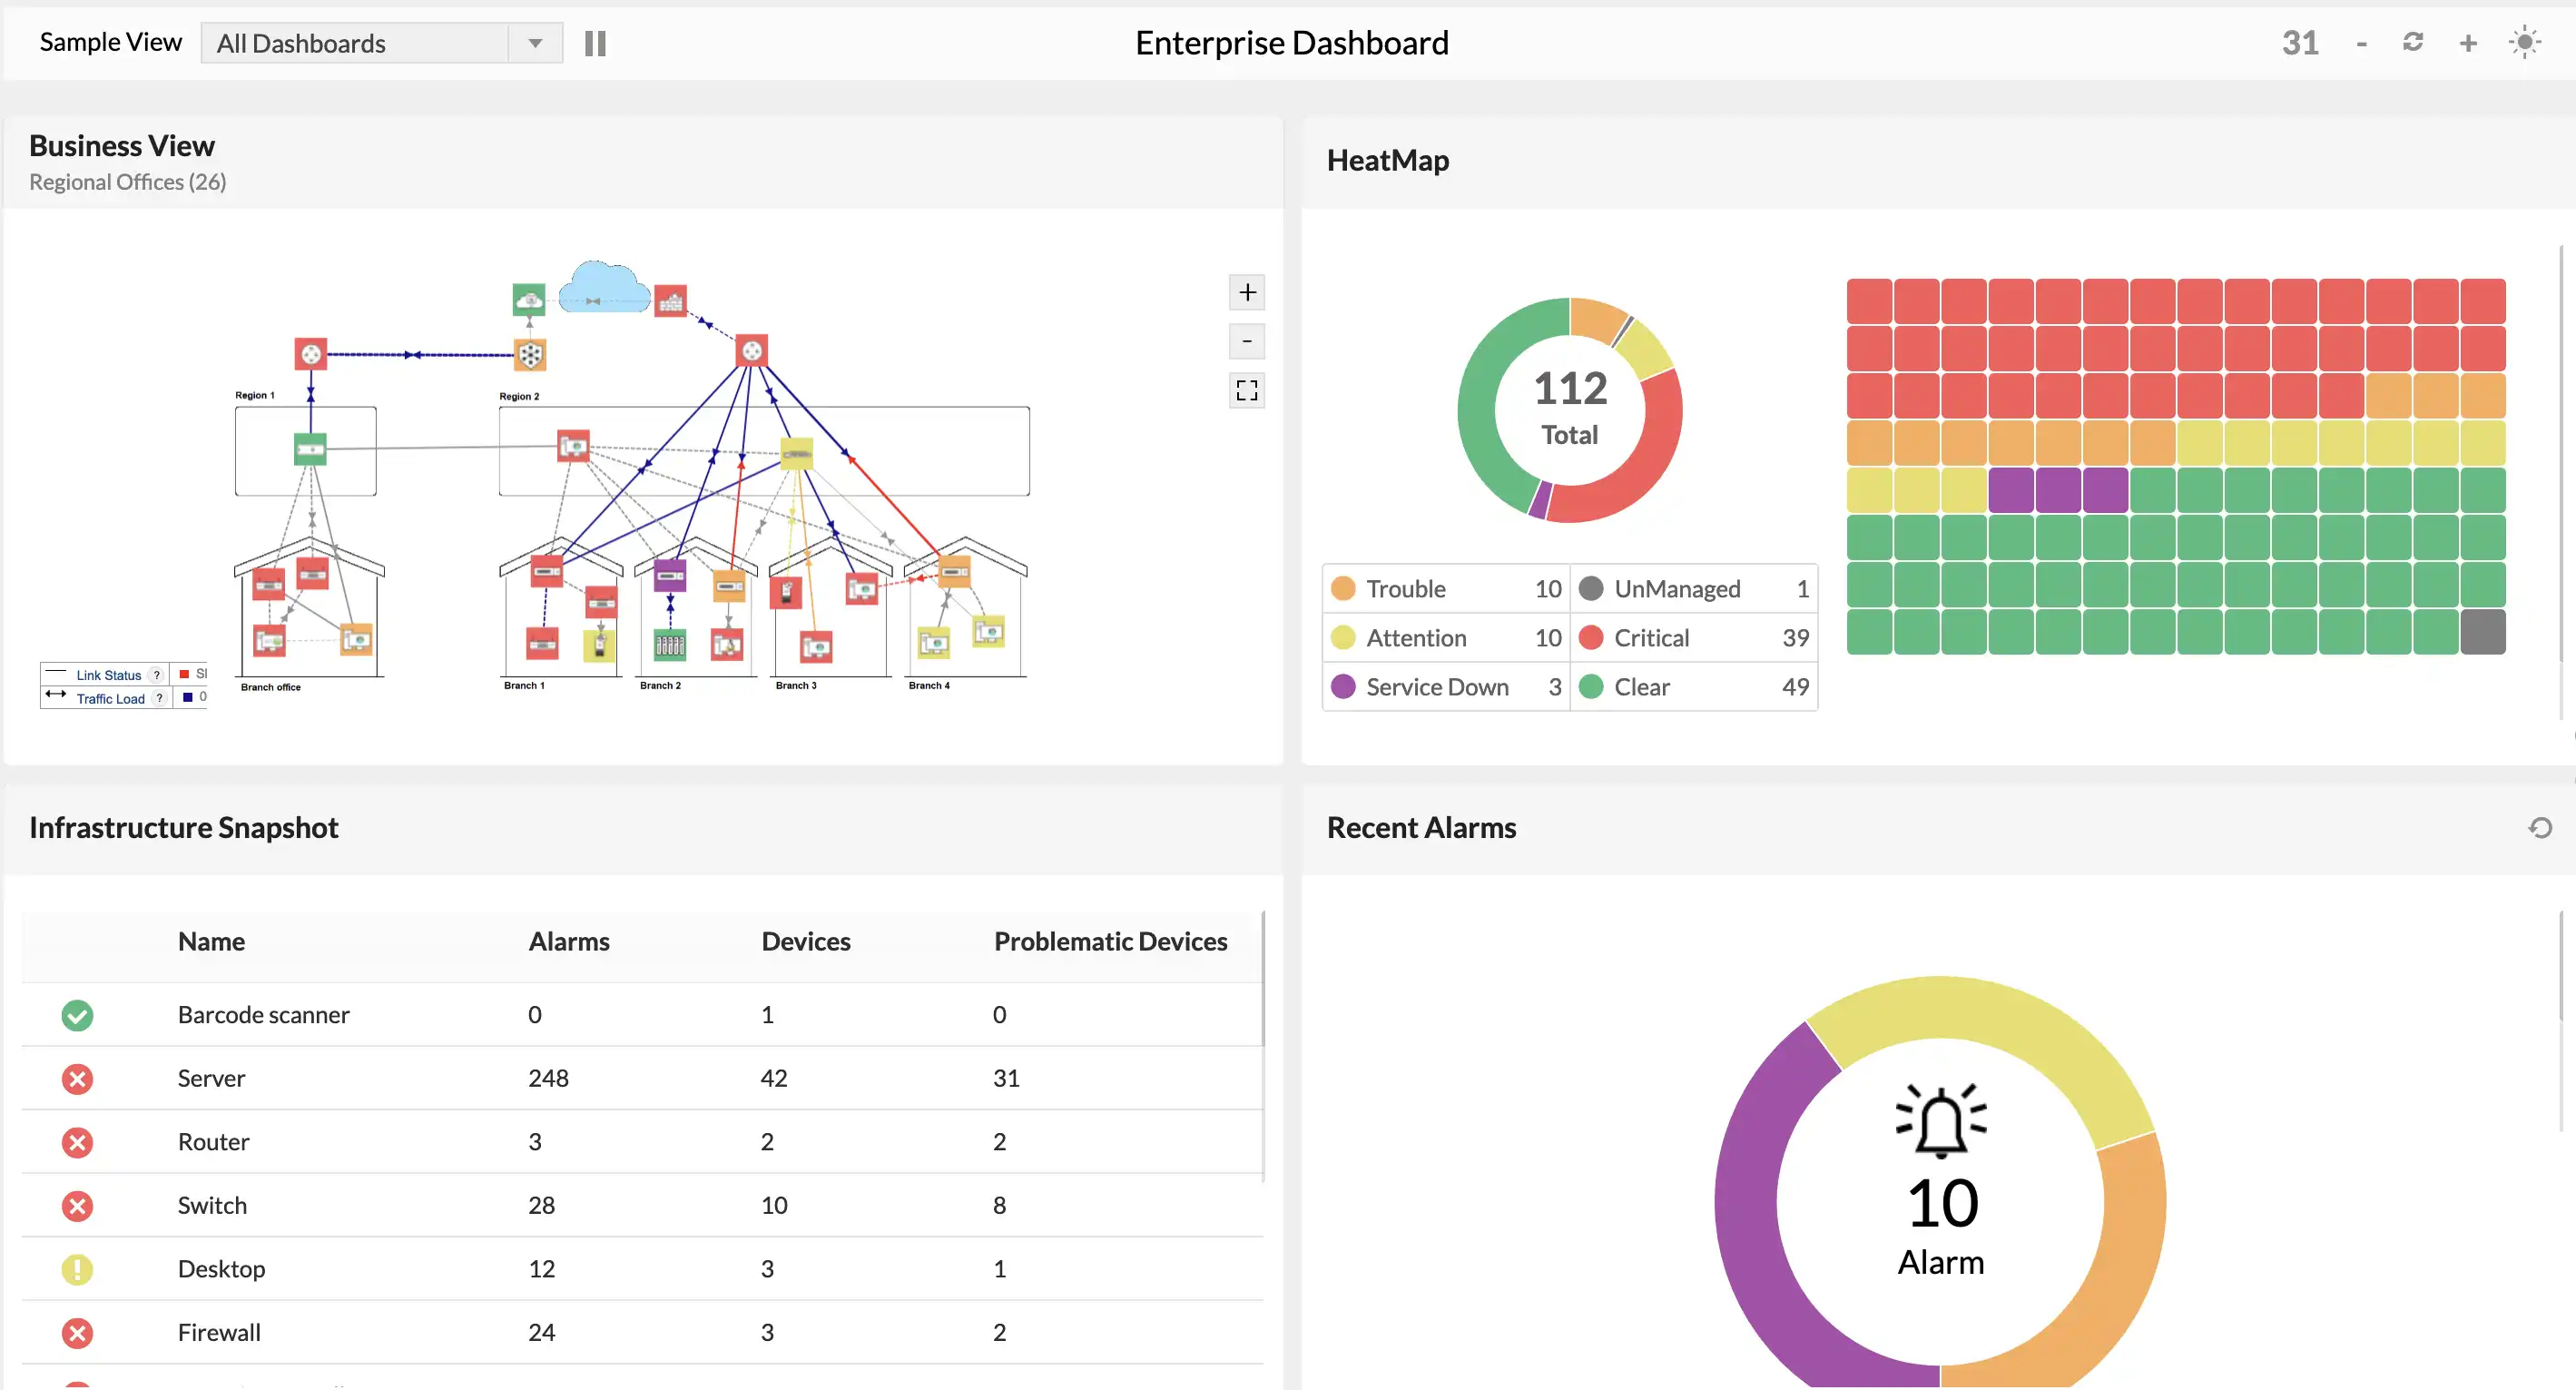
Track the uptime and availability of critical service with CCTV NOC (Network operations center) views. NOC views refresh device status at regular intervals, updating the availability, and showing the latest alarms. IT teams can detect, react, and respond to service issues faster with NOC views.
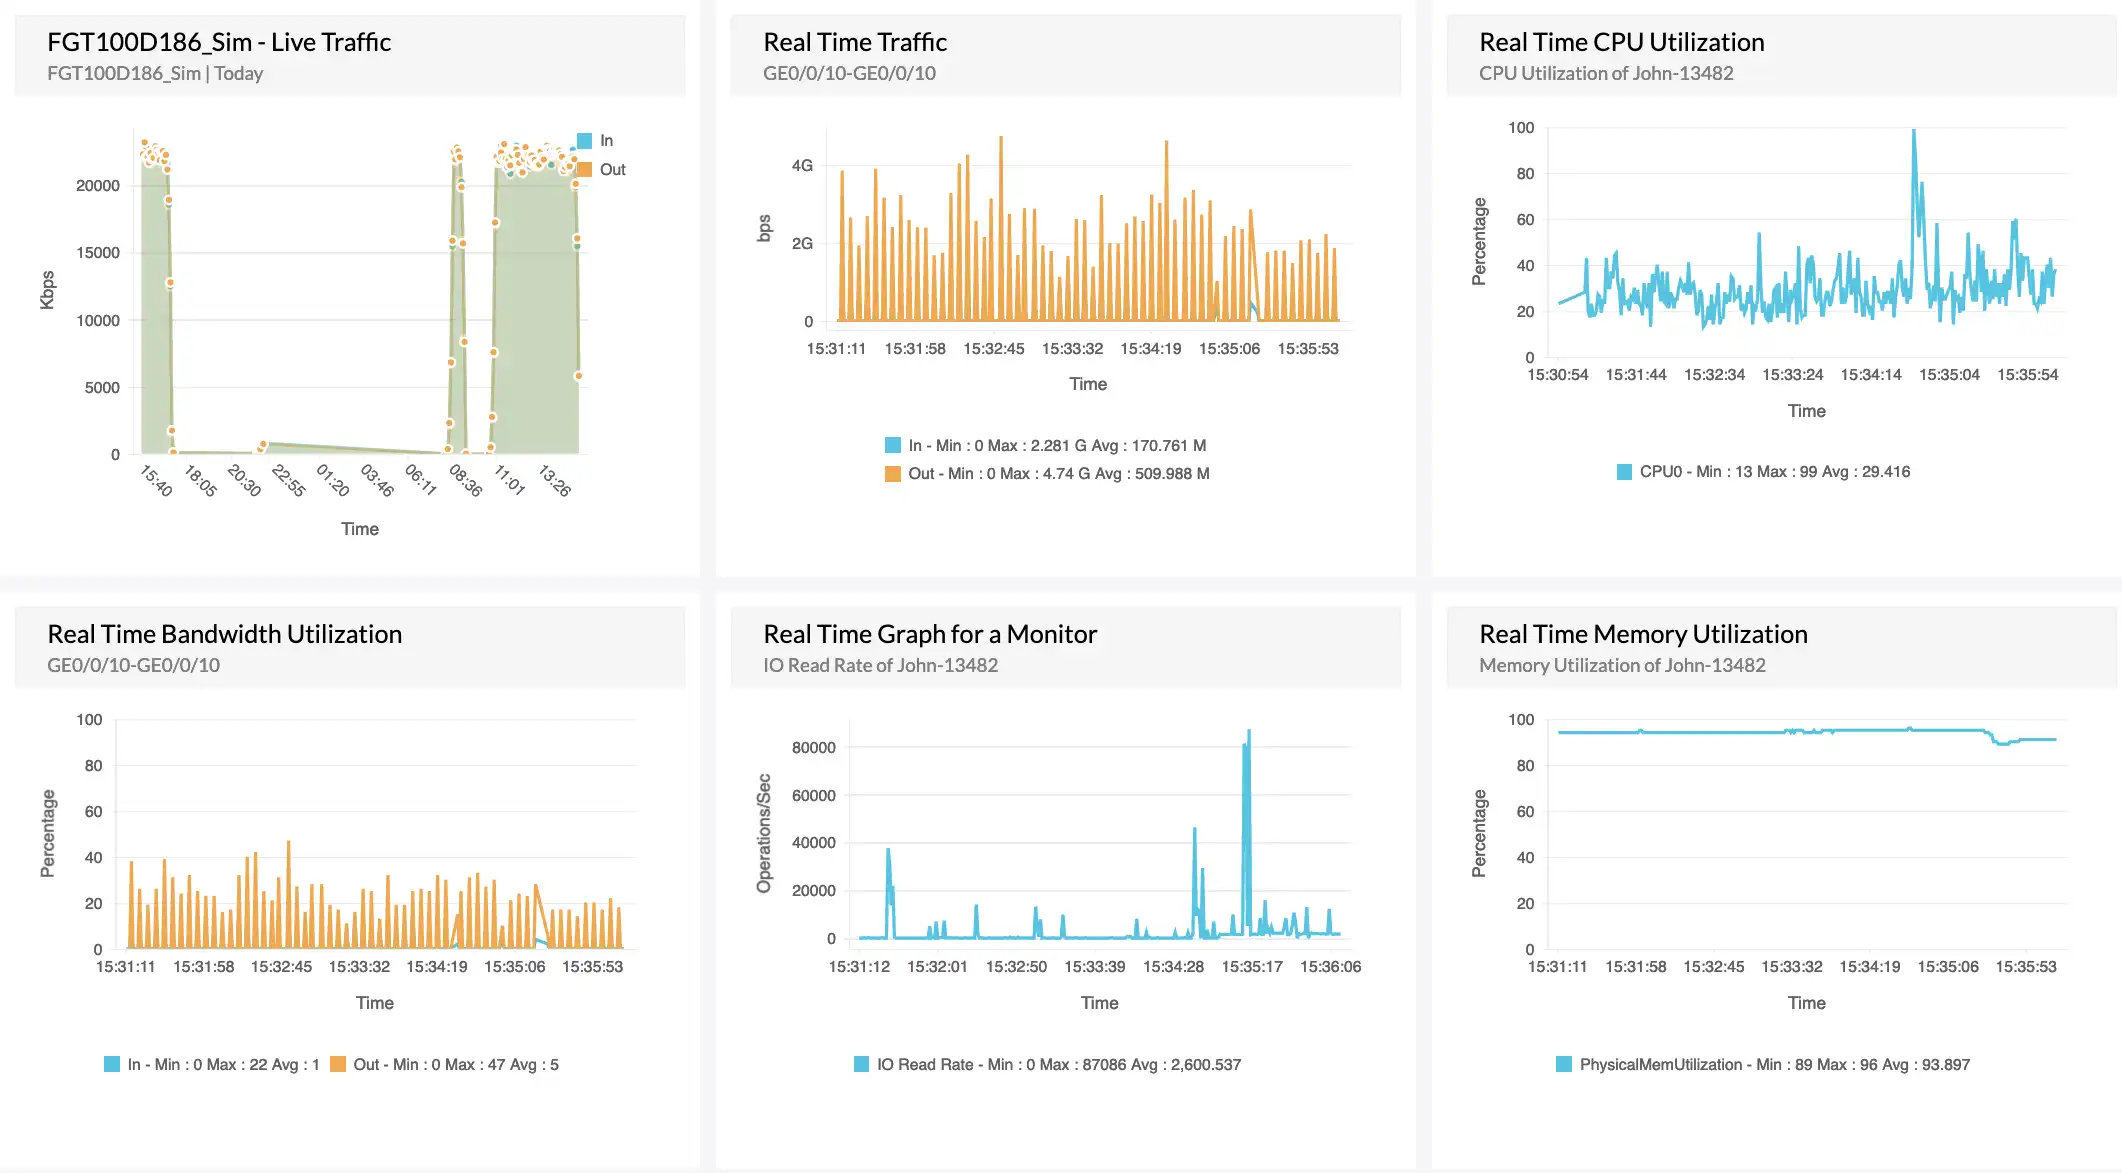
Monitor real-time values of critical metrics like CPU utilization, memory usage, and traffic. Use SNMP walker feature to plot SNMP performance metrics with intervals as small as 1 second. Leverage dedicated real-time dashboards to ensure proactive identification and resolution for issues that may affect uptime.
Keeping track of uptime 24/7 is no easy task, and especially for businesses offering services worldwide. With OpManager's mobile application, your role as an IT admins is easier because you can receive push notifications, set up home screen widgets for critical IT infrastructure, review alarms and dashboards, acknowledge issues, and direct other network technicians from your iPhone or Android smartphone.

Reviewer Role: Infrastructure and Operations
Company size: 500M - 1B USD
We have been using OpManager since 2011 and our overall experience has been excellent. The tool plays a vital role in providing the value to our organization and to the customers we are supporting. The support is excellent and staff takes full responsibilities in resolving the issues. Innovation is never stopping and clearly visible with newer versions.
Reviewer Role: Infrastructure and Operations
Company size: 5,000 - 50,000 Employees
I have a long standing relationship with ManageEngine. OpManager has always missed one or two features that would make it truly the best tool on the market, but over it is the most comprehensive and easy to use the product on the market.
Reviewer Role: Program and Portfolio Management
Company size: 500M - 1B USD
The vendor has been supportive during the implementation & POC phases providing trial licenses. Feature requests and feedbacks is usually acted upon swiftly. There was sufficient vendor support during the implementation phase. After deployment, the support is more than adequate, where the vendor could make some improvements.
Reviewer Role: CIO
Company size: 1B - 3B USD
ManageEngine provides a suite of tools that have made improvements to the availability of our internal applications. From monitoring, management and alerting, we have been able to peak performance within our data center.
Reviewer Role: Enterprise Architecture and Technology Innovation
Company size: 250M - 500M USD
ManageEngine support was responsive to all our queries.

“OpManager helps me monitor all aspects of the data-center and equipment like servers, switches and routers. It is fast, intuitive and centralized and you do not need to be an expert to deal with OpManager.”
NGHA

“Donald Stewart, IT Manager of Crest Industries is happy with ManageEngine OpManager for its end-to-end network monitoring software. It is easy-to-use and offers fault and performance management for router.”
IT Manager, Crest Industries

“John Rosser, MIS Manager of Yale Chase talks about the proactive nature of ManageEngine OpManager & how his organisation gained value from it.”
MIS Manager