Hyper-V generates hundreds of performance metrics, but not all of them require constant attention. Focusing on a core set of metrics helps administrators detect resource bottlenecks, maintain VM performance, and prevent downtime without being overwhelmed by data.
This guide highlights the most important Hyper-V monitoring metrics across CPU, memory, storage, networking, and cluster health. We'll cover the individual performance counters in more detail in a dedicated Hyper-V performance counters guide.
CPU metrics
CPU issues often affect multiple virtual machines at once. Monitoring these metrics helps identify overloaded hosts and CPU contention before workloads slow down.
| Metric | Why it matters | Healthy threshold |
|---|---|---|
| Host CPU utilization | Shows whether the Hyper-V host has enough processing capacity for its workloads. | <70% sustained |
| VM CPU utilization | Identifies VMs consuming excessive CPU resources. | <80% sustained |
| CPU wait time | Indicates CPU contention between VMs. | As low as possible |
| Virtual processor usage | Helps identify uneven CPU usage across VMs. | Monitor for sustained imbalance |
Related counters: Hyper-V Hypervisor Logical Processor\% Total Run Time, Hyper-V Hypervisor Virtual Processor\CPU Wait Time Per Dispatch
Memory metrics
Memory shortages can reduce application performance even when CPU utilization appears healthy.
| Metric | Why it matters | Healthy threshold |
|---|---|---|
| Memory pressure | Indicates whether VMs have sufficient memory. | <80% |
| Available host memory | Shows remaining physical memory on the host. | >20% free |
| Assigned VM memory | Tracks allocated memory per VM. | Should align with workload requirements |
| Memory demand | Highlights VMs that require additional memory. | Should remain close to assigned memory |
Related counters: Hyper-V Dynamic Memory VM\Current Pressure, Memory\Average Pressure, Hyper-V Dynamic Memory Balancer\Available Memory
Disk metrics
Storage bottlenecks often have a direct impact on application performance.
| Metric | Why it matters | Healthy threshold |
|---|---|---|
| Disk latency | Identifies slow storage before applications are affected. | <20 ms |
| Disk utilization | Shows storage saturation. | <80% sustained |
| Read activity | Helps identify read-intensive workloads. | Compare against baseline |
| Write activity | Detects heavy write workloads. | Compare against baseline |
Related counters: Hyper-V Virtual Storage Device\Read Operations/sec, Write Operations/sec, Read Bytes/sec, Write Bytes/sec
Network metrics
Network performance affects VM connectivity, application response times, and live migration.
| Metric | Why it matters | Healthy threshold |
|---|---|---|
| Network throughput | Measures traffic handled by hosts and VMs. | Compare against link capacity |
| Network utilization | Identifies saturated network adapters. | <70—80% sustained |
| Packet errors and drops | Detects communication problems. | Ideally 0 |
| Network latency | Measures communication delays. | Baseline dependent |
vSwitch metrics
For environments using Hyper-V virtual switches, monitor these metrics in addition to standard network performance.
| Metric | Why it matters | Healthy threshold |
|---|---|---|
| vSwitch bandwidth allocation | Ensures VMs receive sufficient bandwidth. | No sustained congestion |
| Virtual NIC health | Confirms virtual adapters are operating normally. | No errors or disconnects |
| SR-IOV status | Verifies hardware acceleration is enabled and functioning when configured. | Enabled and operational |
| NIC team status | Ensures host network redundancy remains available. | All adapters healthy |
Related counters: Hyper-V Virtual Network Adapter\Bytes Sent/sec, Bytes Received/sec, Packets Dropped/sec.
Cluster health metrics
If you use Hyper-V Failover Clustering, monitoring cluster health is just as important as monitoring individual hosts.
| Metric | Why it matters | Healthy threshold |
|---|---|---|
| Cluster node availability | Confirms all nodes are operational. | All nodes online |
| CSV health | Detects storage issues affecting clustered workloads. | Healthy |
| Live migration status | Ensures migrations complete successfully. | Successful migrations |
| Quorum status | Confirms cluster can maintain availability. | Maintained |
| Failover events | Detects unexpected workload movement. | No unexpected failovers |
Related counters: Cluster Shared Volumes IO\Read Bytes/sec, Write Bytes/sec; cluster node heartbeat counters
Which metrics should you prioritize?
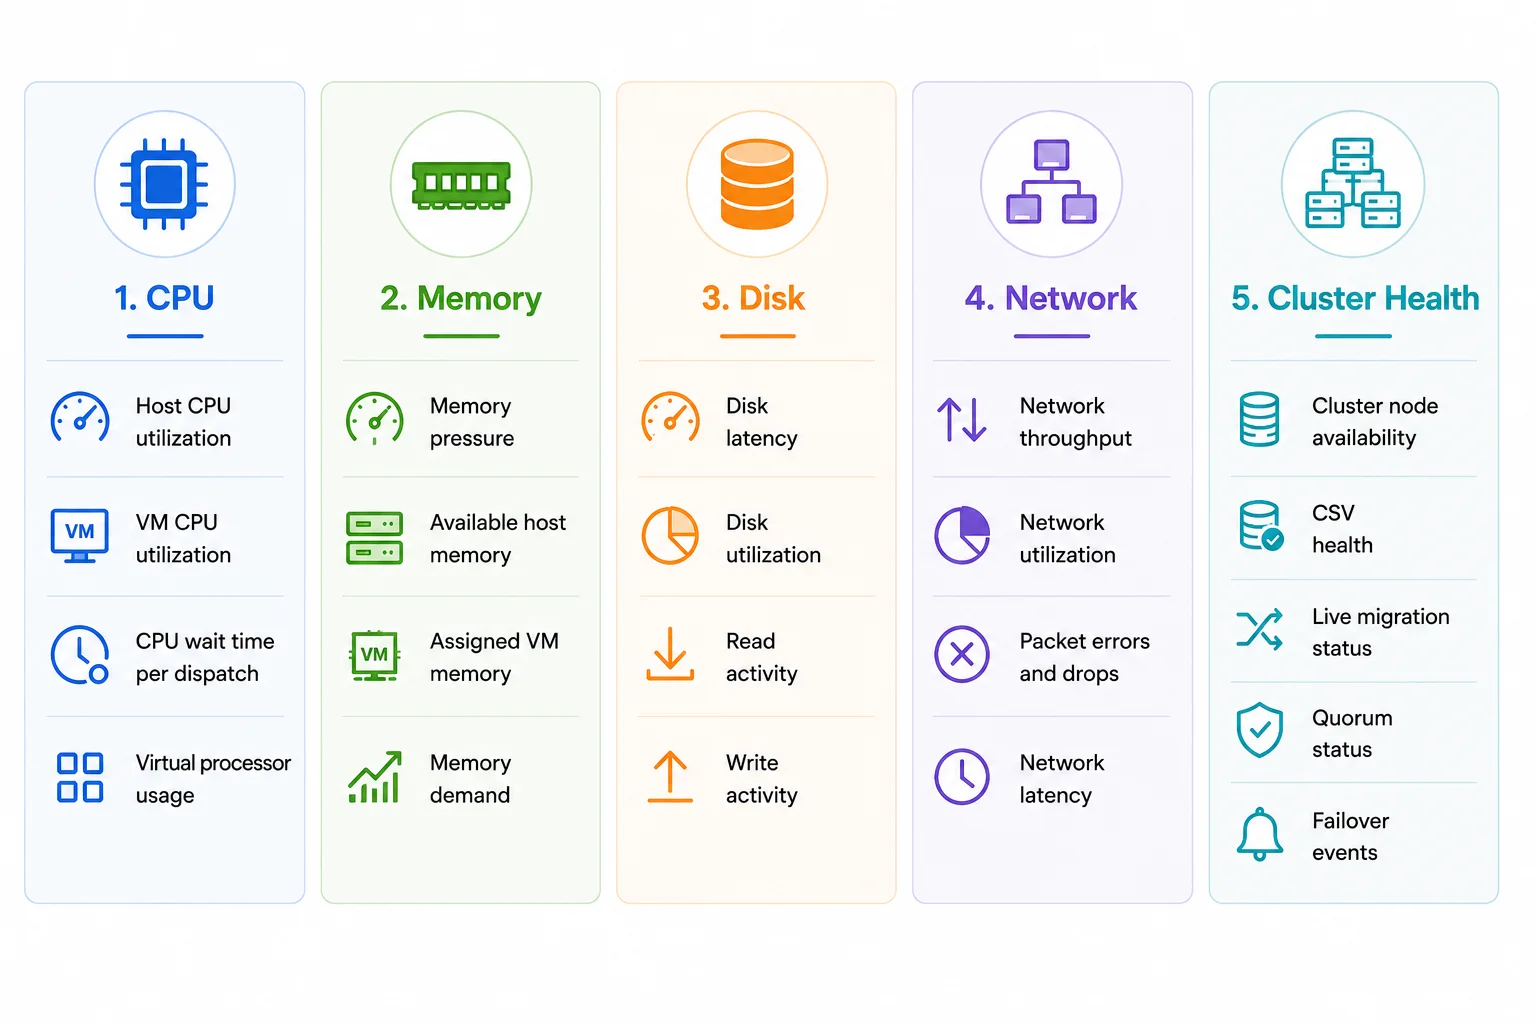
If you're just getting started with Hyper-V monitoring, focus on these metrics first:
- Host CPU utilization
- Memory pressure
- Available host memory
- Disk latency
- Network utilization
- Cluster Shared Volume health
- Live migration status
These metrics provide a quick view of overall infrastructure health and help identify the most common performance issues.
Tips for monitoring Hyper-V metrics
Tracking individual metrics is useful, but the real value comes from understanding how they relate to each other.
- Monitor metrics together, not in isolation: High CPU usage, increased memory pressure, and rising disk latency often occur together. Looking at related metrics helps identify the root cause more quickly.
- Use the right polling interval: A 1-minute polling interval captures short-lived CPU spikes, CPU wait time, and live migration events that may be missed with longer polling. A 5-minute interval reduces monitoring overhead and is generally sufficient for tracking long-term trends such as disk performance, storage utilization, and capacity planning.
- Focus on sustained trends: A short spike in CPU, memory, or disk activity is often normal. Investigate metrics that remain elevated for long periods or occur repeatedly.
- Establish a performance baseline: Record normal CPU, memory, disk, and network usage during regular operations. This makes it easier to spot abnormal behavior and capacity issues.
- Include cluster metrics in clustered environments: If you use Hyper-V Failover Clustering, don't stop at host and VM metrics. Monitor Cluster Shared Volumes (CSVs), live migration, and quorum status to ensure high availability.
- Review metrics after infrastructure changes: Check key metrics after adding new VMs, migrating workloads, or expanding storage. This helps confirm that the environment remains balanced and performs as expected.
Monitor Hyper-V metrics with ManageEngine OpManager
ManageEngine OpManager tracks the most important Hyper-V performance metrics from a single dashboard. It monitors hosts, virtual machines, Dynamic Memory, storage, networking, and cluster health using agentless WMI-based monitoring.
With customizable dashboards, proactive alerts, historical reports, and AI-powered forecasts, OpManager helps administrators identify issues before they affect business-critical workloads.
FAQs
Which Hyper-V metrics are the most important?
The most important metrics include host CPU utilization, memory pressure, available host memory, disk latency, network utilization, and cluster health.
Should I monitor hosts or virtual machines?
Are Hyper-V metrics different from performance counters?

By Ajay Sharma S
Solutions Marketer, ManageEngine