Network switches are the quiet workhorses of every modern IT environment. They route every packet, connect every device, and ultimately determine whether users experience fast, reliable applications or slow, unstable ones. But despite being so foundational, switches are often the least monitored elements in many networks.
The definition: What is switch monitoring?
Switch monitoring is the continuous tracking, analysis, and alerting of a network switch’s health, performance, traffic, and port-level behavior, so teams can detect anomalies early, troubleshoot faster, and maintain reliable connectivity across the network.
What switch monitoring actually involves
- Tracking device health (CPU, memory, temperature, fan status) to ensure switches stay stable under load, and avoid unexpected shutdowns or hardware damage.
- Monitoring traffic patterns and port behavior to identify congestion, drops, interface errors, rogue connections, or devices consuming excessive bandwidth.
- Collecting logs, SNMP traps, and events to quickly identify root causes behind failures, performance dips, or security anomalies.
The operational impact on IT teams
- It transforms what used to be reactive firefighting into proactive prevention.
- It reduces MTTR by making faults visible instantly down to port-level detail.
- It ensures business continuity by preventing cascading failures across the network.
Why switch monitoring is critical today
- Switch issues rarely start loud; they begin as tiny packet drops, rising CPU, or a flapping port. Without monitoring, these early-warning signs remain invisible until users complain or systems fail.
- Complex hybrid networks make blind spots dangerous, especially with virtual switches, stacked switches, PoE-dependent IoT, and edge sites that depend on stable switch operations.
- Businesses depend on predictable performance, and a single unnoticed switch fault can bring down entire departments, POS terminals, warehouses, or cloud pathways.This guide breaks down everything from what switch monitoring is, to metrics, use cases, AI-driven capabilities, buyer checklists, and how it ties into overall network performance.
What happens when teams don’t monitor switches
A lot of admins first look at applications, servers, or firewalls when performance issues arise. Switches are often checked last; yet issues often start right there.
The hidden challenges teams face when switches go unmonitored
| Problem / Gap | What often goes wrong |
|---|---|
| No central visibility; teams rely on manual CLI checks or fragmented logs | Troubleshooting drags on: multiple teams hash through devices, leading to misdiagnosis, delayed fixes, and burnout. |
| Silent errors (CRC errors, flapping ports, duplex mismatches, PoE issues) go unnoticed | These small issues accumulate and eventually cause outages, poor VoIP/call quality, slow Wi-Fi or intermittent connectivity; hard to trace after the fact. |
| Distributed or remote branches lack local IT support and monitoring | Failures at remote sites (e.g. retail outlets, warehouses) remain undetected until users report problems resulting in service delays, revenue hits, or compliance risks. |
| Hardware health (temperature, PSU, fan, optics) is ignored | Thermal failures, PSU faults or optic degradation cause sudden shutdowns or intermittent failures often during peak load, leading to unpredictable downtime. |
| No historical trend data; capacity planning is reactive or guesswork | Networks grow (more devices, APs, cameras, IoT) without understanding when uplinks/PoE budgets will saturate; leads to performance degradation or forced costly upgrades. |
| Security blind spots: unmanaged ports or undocumented device connections | Rogue devices, unauthorized VLAN access, MAC spoofing or rogue PoE devices go undetected: risk of data breach, compliance failures, or internal misuse. |
Key components of a network switch and what makes monitoring necessary
Before understanding monitoring, it's useful to know what parts of a switch generate performance and health data. Each of these components plays a role in overall network stability.
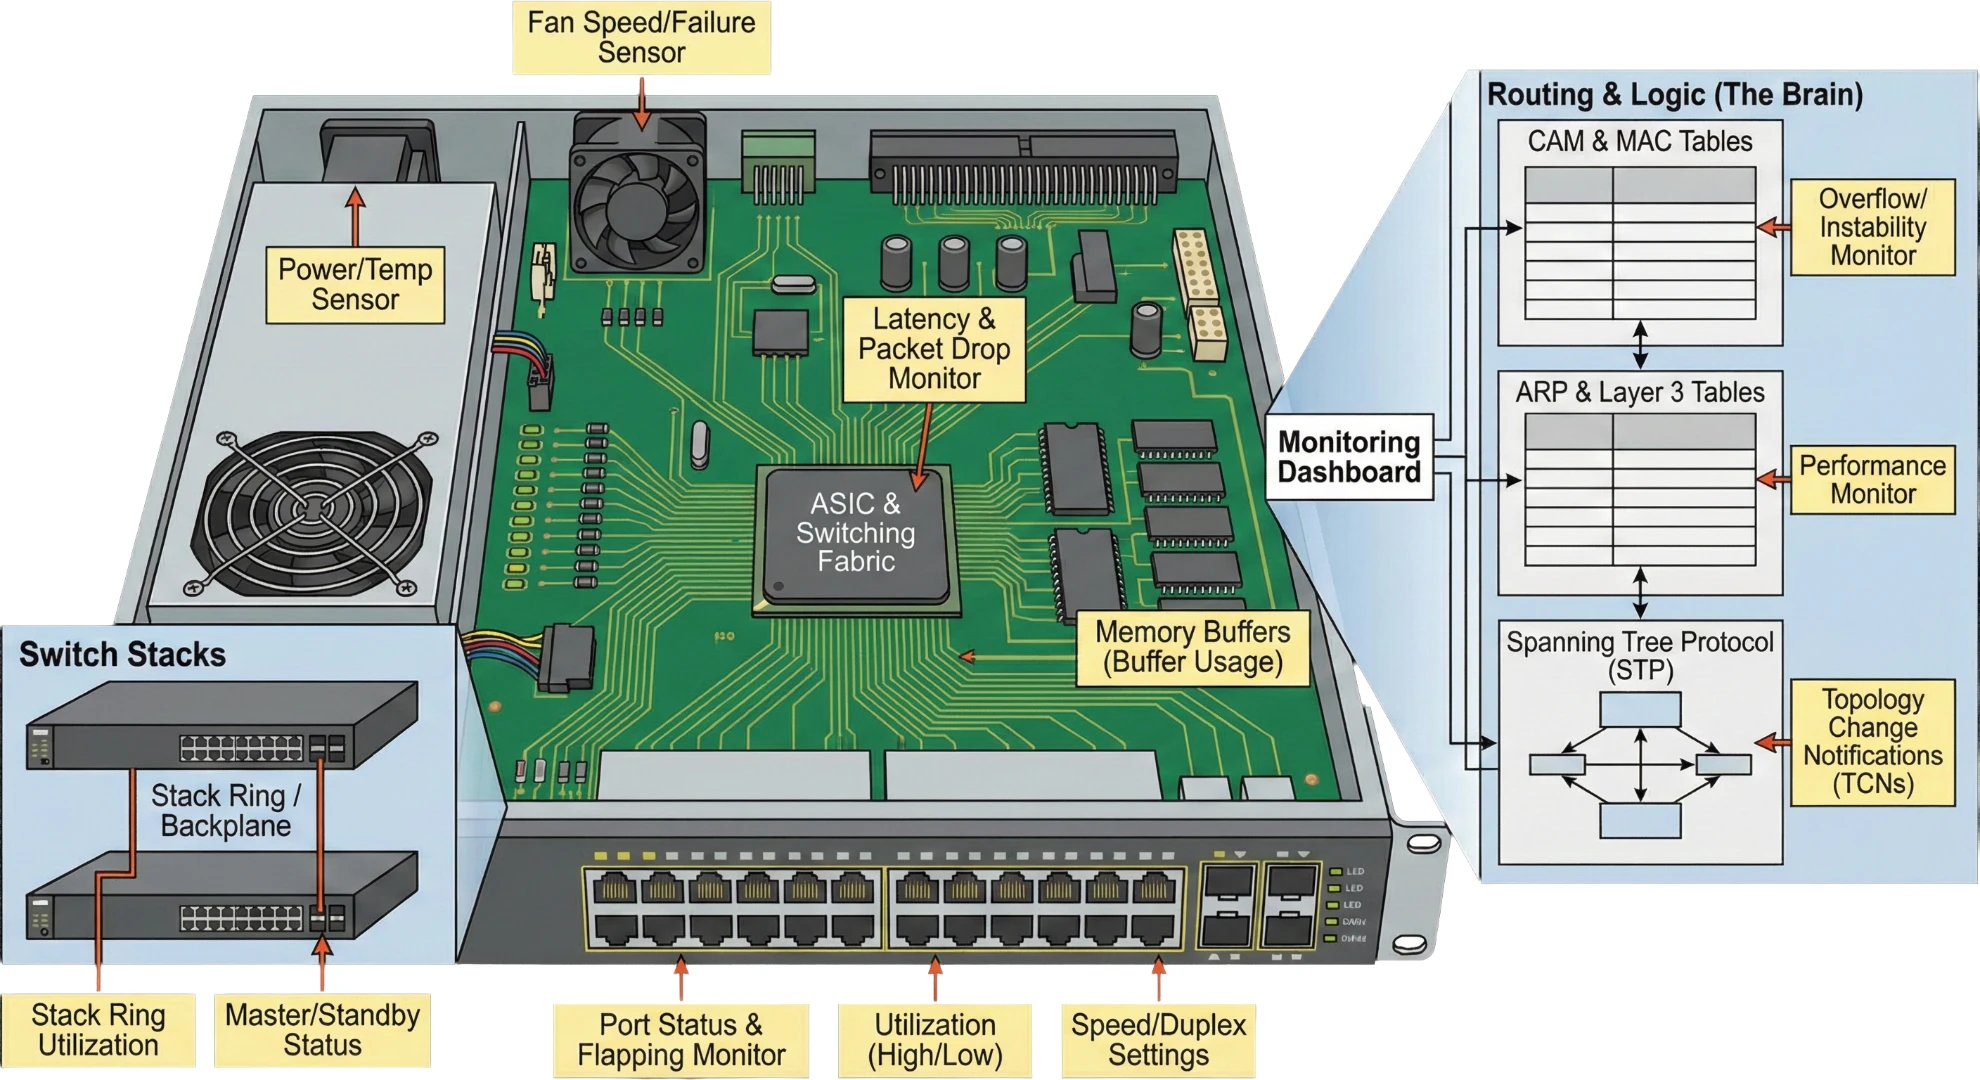
1. Chassis & Hardware (The Physical Layer)
- Fans and power supplies, which directly affect hardware lifespan; overheating or power failures often appear first through sensor readings.
- ASIC and switching fabric, which determines how fast packets move; issues here cause widespread latency or packet drops.
- Memory buffers, which temporarily store packets; when buffer usage spikes, switches start dropping packets under heavy load.
- Switch Stacks - In a stack, multiple switches act as one. You must monitor the Stack Ring or Backplane utilization. If the master switch fails, we need to ensure if the standby takes over correctly.
2. Port Interfaces (The Access Layer)
- Each port behaves like a mini ecosystem, with its own speed, duplex settings, error counters, and device connections.
- Port failures or flapping cause intermittent connectivity issues that are notoriously hard to diagnose without monitoring.
- High-utilization ports often correlate directly with user complaints or slow applications.
3. Routing & Logic (The Brain)
- CAM and MAC tables decide where packets should go; when they overflow or become unstable, traffic gets misrouted or dropped.
- ARP and Layer 3 tables impact Layer 3 switch performance, especially in high-density VLAN environments.
- Spanning Tree Protocol (STP) : STP prevents loops; you must monitor for Topology Change Notifications (TCNs) . A constantly changing topology means a loop is trying to form, which will crash the network.These components shape what must be monitored to ensure business-critical stability.
How switch monitoring works
Modern switch monitoring uses standard protocols, automation, and device telemetry to collect and analyze real-time data.
| Step | What happens | What it enables |
|---|---|---|
| Step 1: Data collection | Collects raw metrics via SNMP polling , streaming telemetry, syslogs, traps, APIs | High-fidelity visibility into traffic, errors, health, control-plane stability, and config changes |
| Step 2: Data processing & correlation | Metrics are baselined, normalized, matched with topology maps, and correlated with event patterns | Faster RCA, meaningful insights, reduced noise, and accurate incident context |
| Step 3: Alerting, Insights & Remediation | Alerts trigger based on deviations; auto-diagnostics and guided remediation kick in. | Early detection, proactive fixes, automated workflows, and better long-term optimization |
Key metrics to track in switch monitoring and why they matter
These metrics are chosen because they directly influence network reliability, speed, and user experience.
A. Health & Hardware metrics
These determine whether your switch is stable and able to handle demand.
- CPU & memory usage High values indicate processing bottlenecks, routing issues, or abnormal traffic. Monitoring CPU & memory usage helps teams identify if congestion or misconfigurations are overloading the device.
- Temperature, fan, and power status Overheating or power inconsistencies can degrade performance or shut the switch down unexpectedly. Monitoring ensures admins catch environmental faults early.
- Hardware errors / sensor alerts These often precede major failures, and monitoring them enables timely maintenance and prevention.
B. Port & interface metrics
These determine whether traffic flows smoothly or experiences errors.
- Port utilization (in/out) High or uneven utilization indicates bottlenecks, misbalanced loads, or bandwidth-heavy applications. Monitoring helps optimize traffic paths.
- Errors, CRC issues, collisions These reveal cable faults, damaged interfaces, or devices sending corrupted traffic. Fixing them improves stability.
- Port flaps or link status changes Frequent flaps cause intermittent connectivity issues that frustrate users; monitoring surfaces these patterns instantly.
C. Traffic & Bandwidth metrics
These help understand how applications behave across the network.
- Top talkers & top applications Shows which devices or apps consume the most bandwidth ; useful for diagnosing slow applications or identifying abnormal traffic spikes.
- Broadcast/multicast traffic Excessive broadcast domains cause unnecessary overhead, slowing device response times.
- Traffic patterns over time Enables capacity planning, avoids congestion, and helps teams understand peak vs. normal behavior.
How switch monitoring directly impacts overall network performance
Switches sit at the heart of network performance; and if they degrade, everything above them suffers.
1. Switch performance affects every downstream component
- Servers, applications, Wi-Fi access points, firewalls, and cloud routers all rely on stable switch ports for smooth communication.
- Slow ports or congested uplinks cause cascading latency across apps, VPNs, and collaboration tools.
2. Monitoring ensures consistent end-user experience
- Identifying port saturation early prevents packet loss and jitter in VoIP or video calls.
- Tracking bandwidth anomalies helps troubleshoot slow ERP, CRM, or database access before users notice.
3. Monitoring avoids “unknown performance variables”
- Without monitoring, teams struggle to determine whether delays are caused by the app, the server, or an underlying switch.
- Switch monitoring connects the dots: turning random symptoms into actionable performance insight.
AI-driven switch monitoring (The next-gen capability IT teams expect)
AI transforms reactive troubleshooting into proactive, predictive network operations.
| AI Capability | What it does | Why it’s valuable |
|---|---|---|
| Smart baselines | Learns “normal” behavior for traffic, errors, and power draw | Reduces alert fatigue by minimizing false positives |
| Predictive detection | Identifies slow-building issues like rising temps or growing error rates | Stops failures before they impact users. |
| Anomaly detection | Flags unusual MAC activity, traffic bursts, VLAN deviations | Strengthens network security and visibility |
| Automated remediation guidance | Recommends fixes like port resets, PoE redistribution, or config updates | Accelerates incident response and improves IT efficiency |
How switch monitoring strengthens network security
Switches are one of the earliest points where malicious activity becomes visible.
Detecting unauthorized devices: New MAC addresses or rogue devices connecting to open ports are flagged instantly, preventing lateral movement or unauthorized access.
Identifying abnormal traffic patterns: Sudden spikes in unknown traffic can indicate malware, data exfiltration, or compromised endpoints
Port-level behaviour monitoring: Flapping ports, frequent reconnections, or unusual packet drops can signal tampering or attack attempts.Switch monitoring helps enforce stronger Zero Trust principles at the infrastructure layer.
Real-world use cases for switch monitoring
Switch monitoring directly supports several practical, high-value scenarios.
Avoiding office-wide outages caused by a single failing port: When one uplink port starts dropping packets, switch monitoring alerts the team before an entire floor’s connectivity collapses .
Maintaining stable VoIP and video call quality: Monitoring jitter, drops, and port utilization helps teams quickly fix path or congestion issues affecting collaboration tools.
Troubleshooting slow application performance: Teams can instantly see whether the issue stems from server-side delays or switch-based congestion at the access layer.These use cases highlight how deeply switch monitoring influences operational reliability.
Buyer’s checklist: What to look for in a switch monitoring tool
Teams often struggle to evaluate monitoring tools because feature lists look similar. These criteria focus on what actually matters in real day-to-day IT operations.
Deep port-level visibility: Ability to track port utilization, errors, flaps, and traffic at granular levels across multi-vendor switches.
AI-driven anomaly and capacity detection: Tools should help reduce alert noise and predict failures before they occur.
Flow analysis and traffic intelligence: Real visibility into bandwidth-heavy apps, users, and traffic paths.
Automated network maps: Layer 2 and port-to-port topology mapping to understand relationships and troubleshoot faster.
Low-latency monitoring + real-time alerts: Alerts should fire instantly for critical issues like port down, high errors, device overheating, or power loss.
Scalability and multi-vendor support: Especially for environments mixing Cisco, HPE, Juniper, Arista, Dell, Fortinet, and others.
How OpManager delivers reliable, end-to-end switch monitoring
By this point, we’ve walked through how switch health shapes user experience, application performance, and overall network stability. The natural next question is: how do you bring all of this together in one place? That’s exactly where OpManager fits in. It doesn’t just collect switch metrics; it helps you make sense of them, correlate them with real network behavior, and act before issues snowball. Below are the top 5 capabilities that best support everything we discussed in this page.
a) Unified visibility from switch to application
OpManager gives you a single lens across your switches, interfaces, servers, VMs, firewalls, WAN links, and even business-critical apps.
- You immediately see how a switch-level issue cascades into slow logins, latency spikes, or app slowness.
- Cuts troubleshooting time dramatically because you’re no longer jumping between tools or making assumptions.
b) Deep per-port monitoring for real-world troubleshooting
Every port has its own story: utilization patterns, CRC errors, discards, flaps, duplex/speed mismatches, and OpManager captures it all in real time.
- Helps teams find the exact port causing drops, congestion, or jitter.
- Perfect for diagnosing issues in wireless networks, VoIP environments, and high-throughput LAN setups.
c) Automatic, always-updated L2 network maps
OpManager auto-discovers switches and builds accurate Layer-2 topology maps ; no add-ons, no manual diagrams.
- You get live visibility of neighbors, uplinks, VLAN paths, MAC/IP bindings, and device relationships.
- Makes it easy to spot bottlenecks, rogue devices, or miswired links before they disrupt users.
d) Switch stack & Hardware monitoring
OpManager natively supports switch stacking. It monitors the health of the Master and Member switches individually, along with hardware sensors (Fan, Temp, Power Supply) to prevent physical failure.
e) AI-driven traffic baselines & anomaly detection
Instead of static thresholds that don’t reflect real conditions, OpManager uses machine learning to baseline traffic, errors, and patterns on each switch and port.
- Flags sudden spikes, abnormal port behavior, unexpected broadcast storms, or unusual traffic flows.
- Reduces alert noise and gives teams early warning signals that actually matter.
f) Actionable alerts & automated switch-level remediation
OpManager lets teams automate routine but critical switch operations securely and at scale.
- Auto-reset or shut down problematic ports based on error thresholds or suspicious activity.
- Launch diagnostics, run scripts, or trigger workflows when anomalies arise.
- Moves teams from “reactive firefighting” to “predictable prevention.”
Ready to experience OpManager’s switch monitoring in action?
If you want to see how these capabilities work in real environments and how easily they plug into your network, OpManager makes it simple to explore:
Try OpManager for free or request a guided demo to see real-time switch monitoring in action.

By Monicaa,
Product Marketer, ManageEngine