Amazon Database Services Monitoring
Amazon Database Services provide scalable, fully managed database solutions designed to support diverse workloads, including relational, document, graph, and globally distributed databases. Monitoring these services is critical to maintaining application performance, ensuring database availability, optimizing resource utilization, and proactively identifying issues that could impact business operations.
Applications Manager offers comprehensive monitoring capabilities for Amazon Database Services, helping organizations gain visibility into database performance, resource consumption, replication health, connectivity, and operational status across AWS environments.
- Amazon Aurora DB
- Amazon DocumentDB Cluster
- Amazon DocumentDB Global Cluster
- Amazon DocumentDB Instance
- Amazon DynamoDB
- Amazon ElastiCache Redis
- Amazon Lightsail Database
- Amazon Neptune Cluster
- Amazon Neptune Instance
- Amazon RDS
- Amazon RDS Proxy
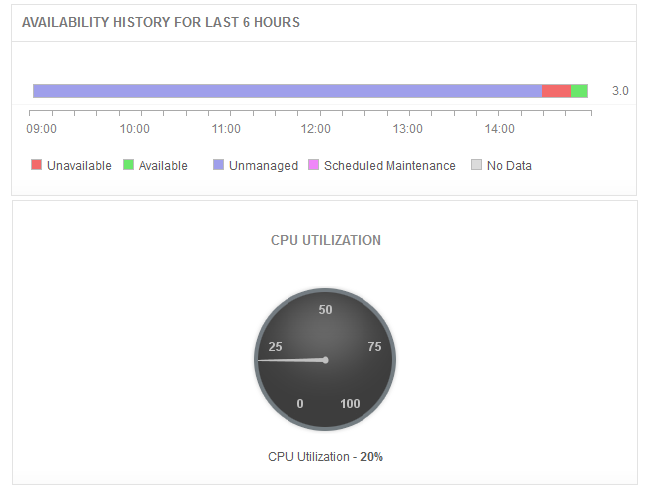
Amazon Aurora DB Monitoring
Amazon Aurora is a MySQL and PostgreSQL-compatible relational database engine built for the cloud. It combines the performance and availability of high-end commercial databases with the simplicity and cost-effectiveness of open source databases, delivering up to five times the throughput of MySQL.
With Applications Manager, you can:
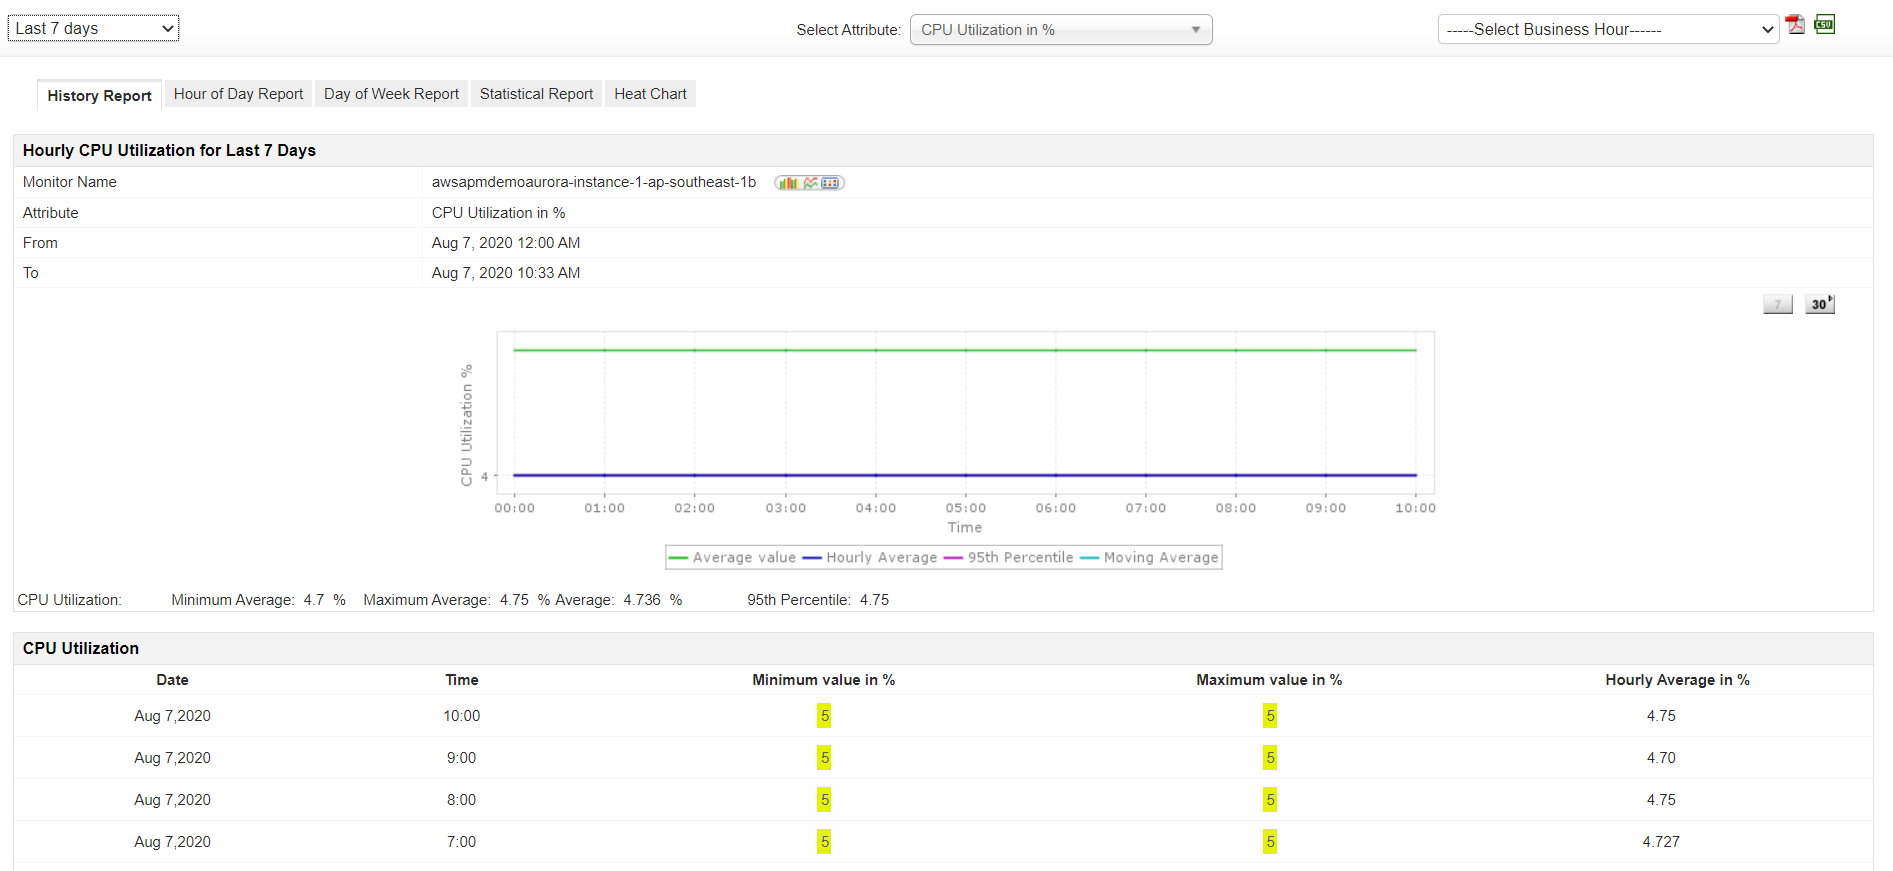
- Gather real-time performance data by monitoring CPU, memory, disk, and network metrics to investigate issues and prevent bottlenecks.
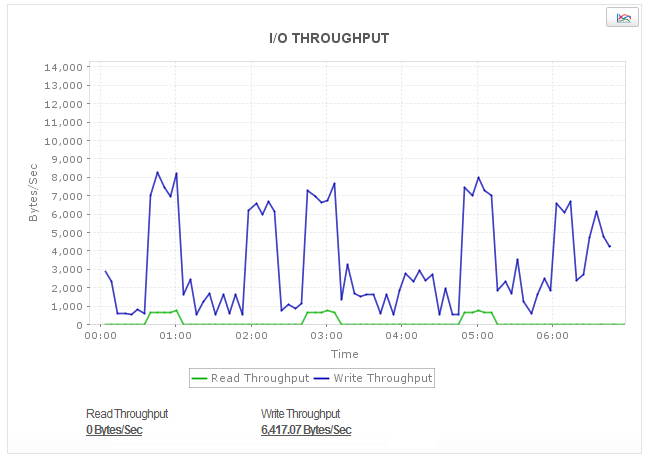
- Plan disk space utilization by tracking read/write IOPS, I/O queue depth, and query latency at the disk level.
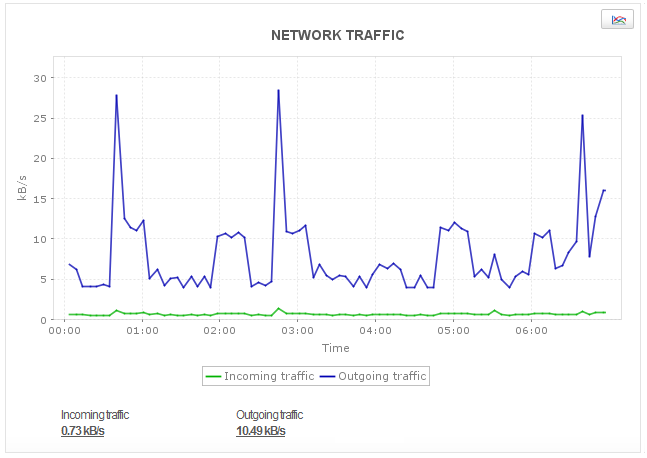
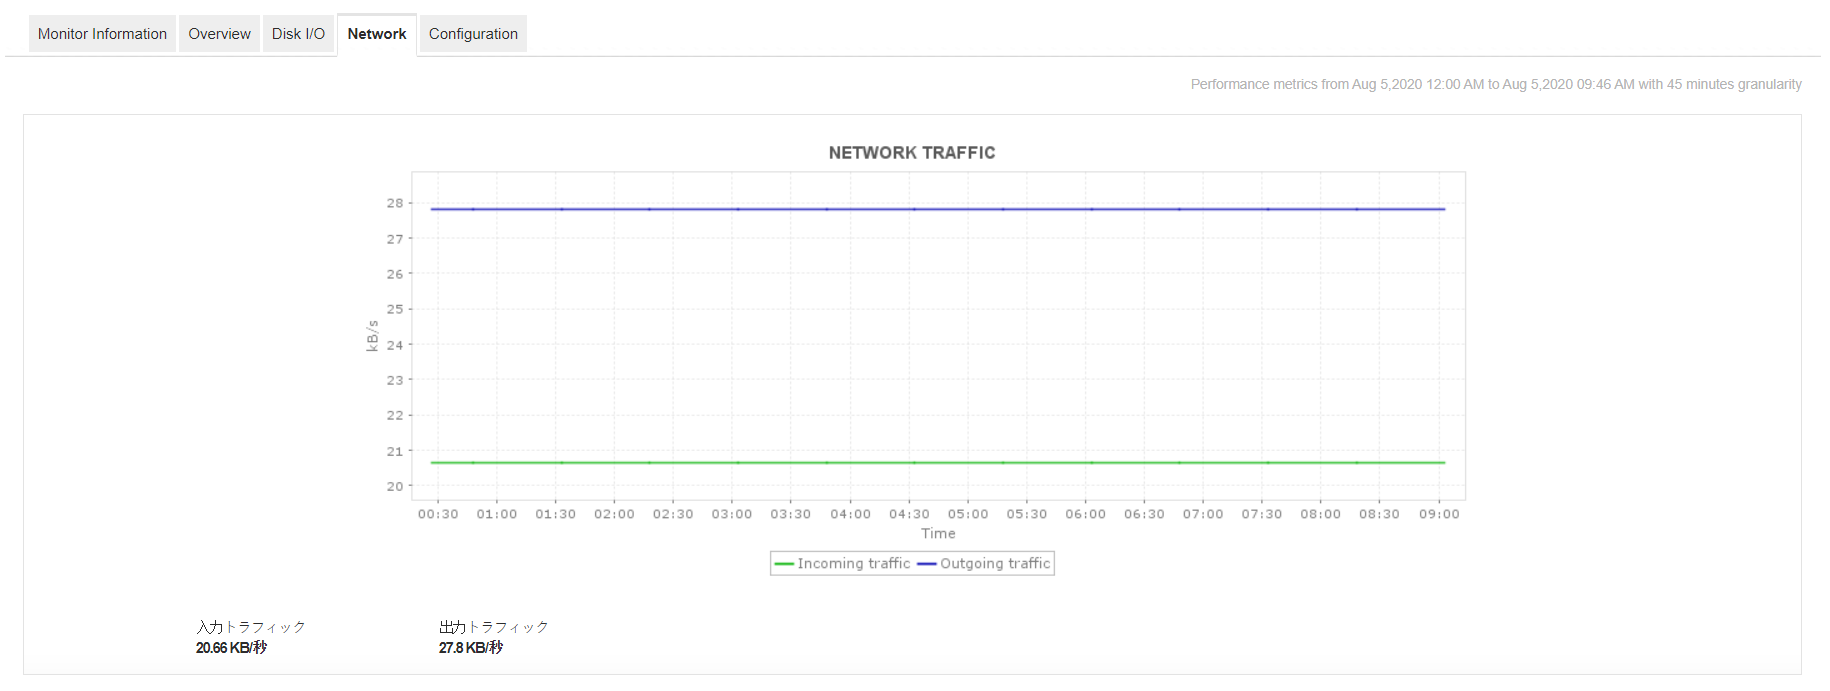
- Gain insight into network traffic by monitoring throughput metrics and tracking network traffic to/from clients.
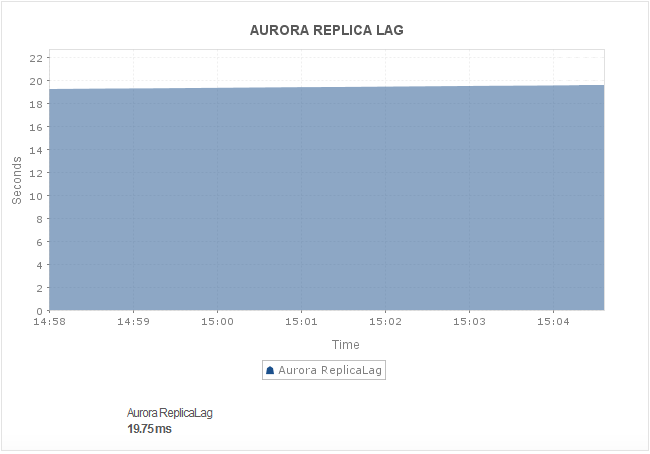
- Minimize replica lag in Aurora clusters by monitoring the health of up to 15 read replicas and tracking page cache updates.
- Understand database operations by tracking query throughput, read/write command breakdown, and DDL latency for performance optimization.
Learn more about Amazon Aurora DB monitoring.
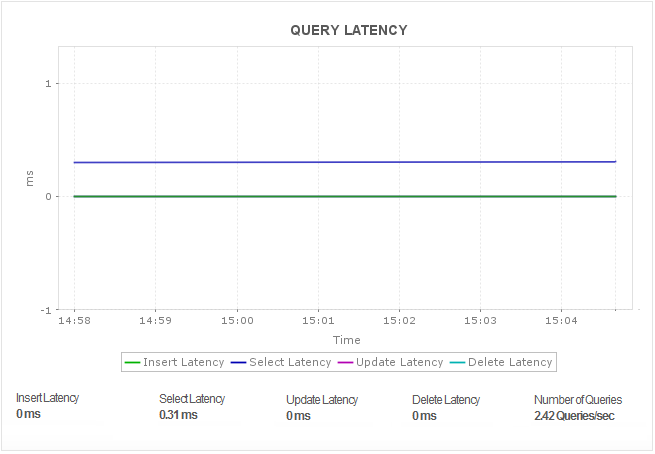
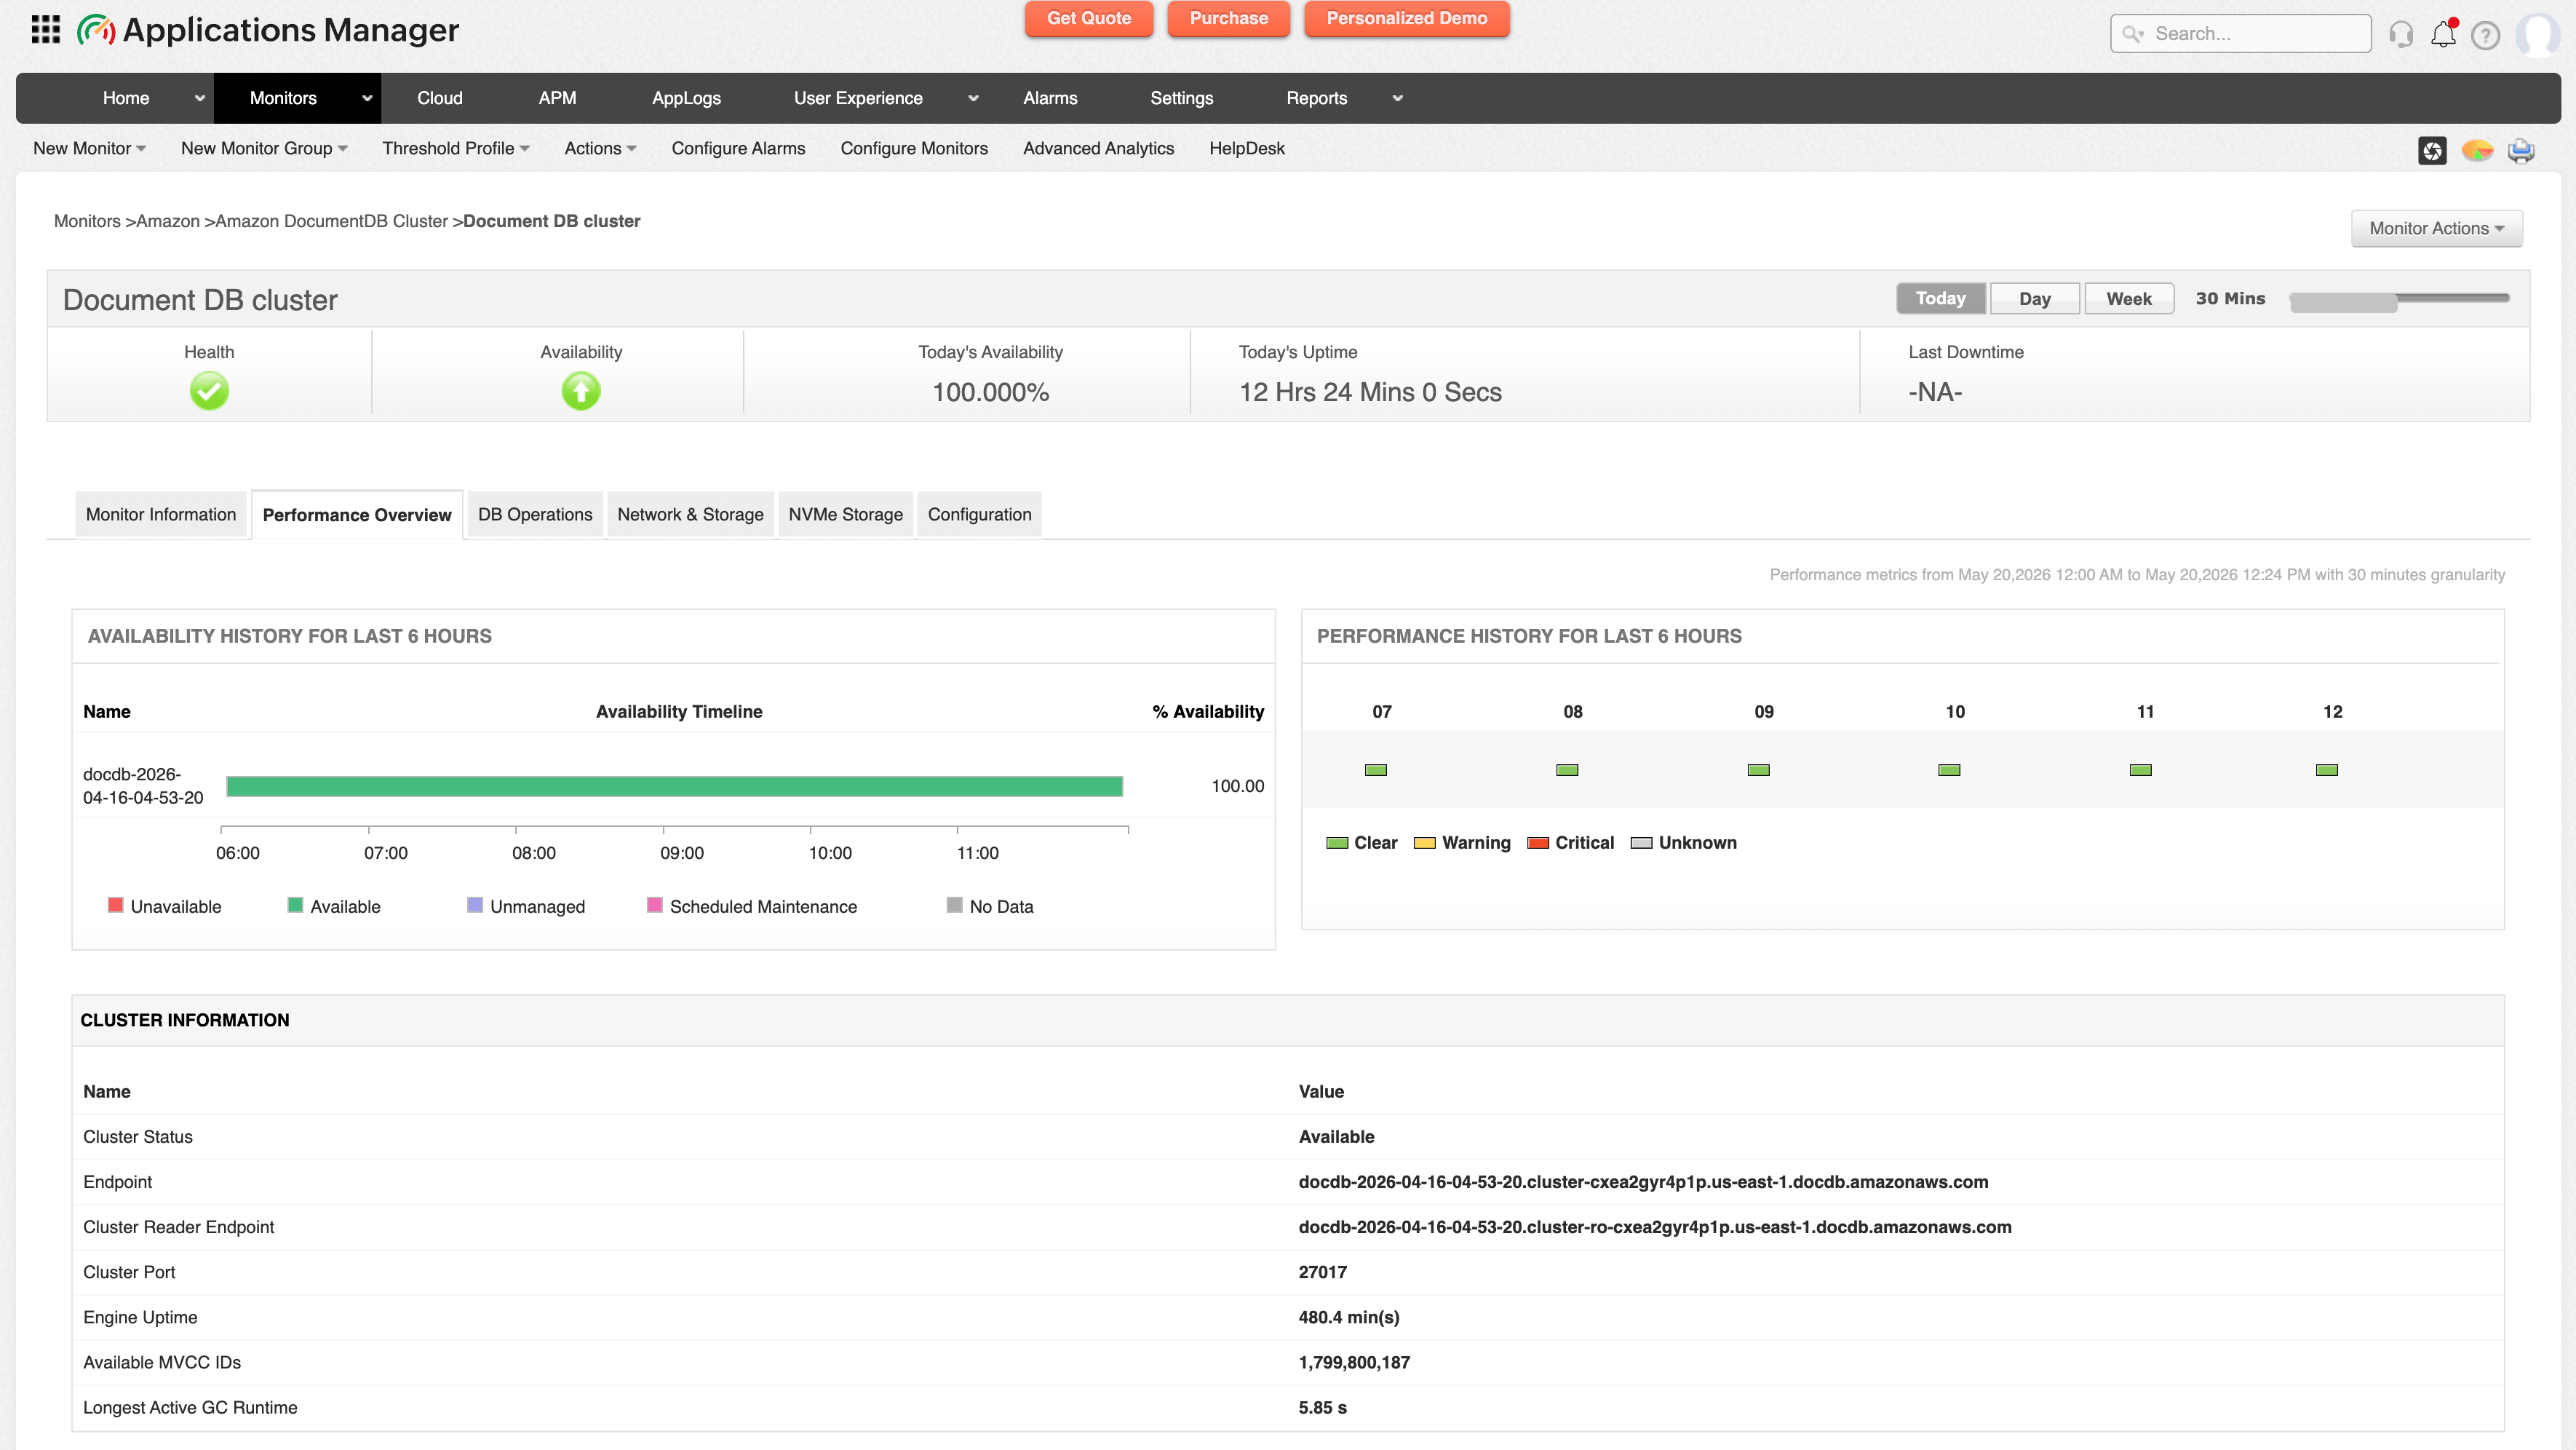
Amazon DocumentDB Cluster Monitoring
Amazon DocumentDB Cluster is a fully managed document database service designed for storing, querying, and indexing JSON data at scale. It offers high availability, automatic scaling, and compatibility with MongoDB workloads.
With Applications Manager, you can:
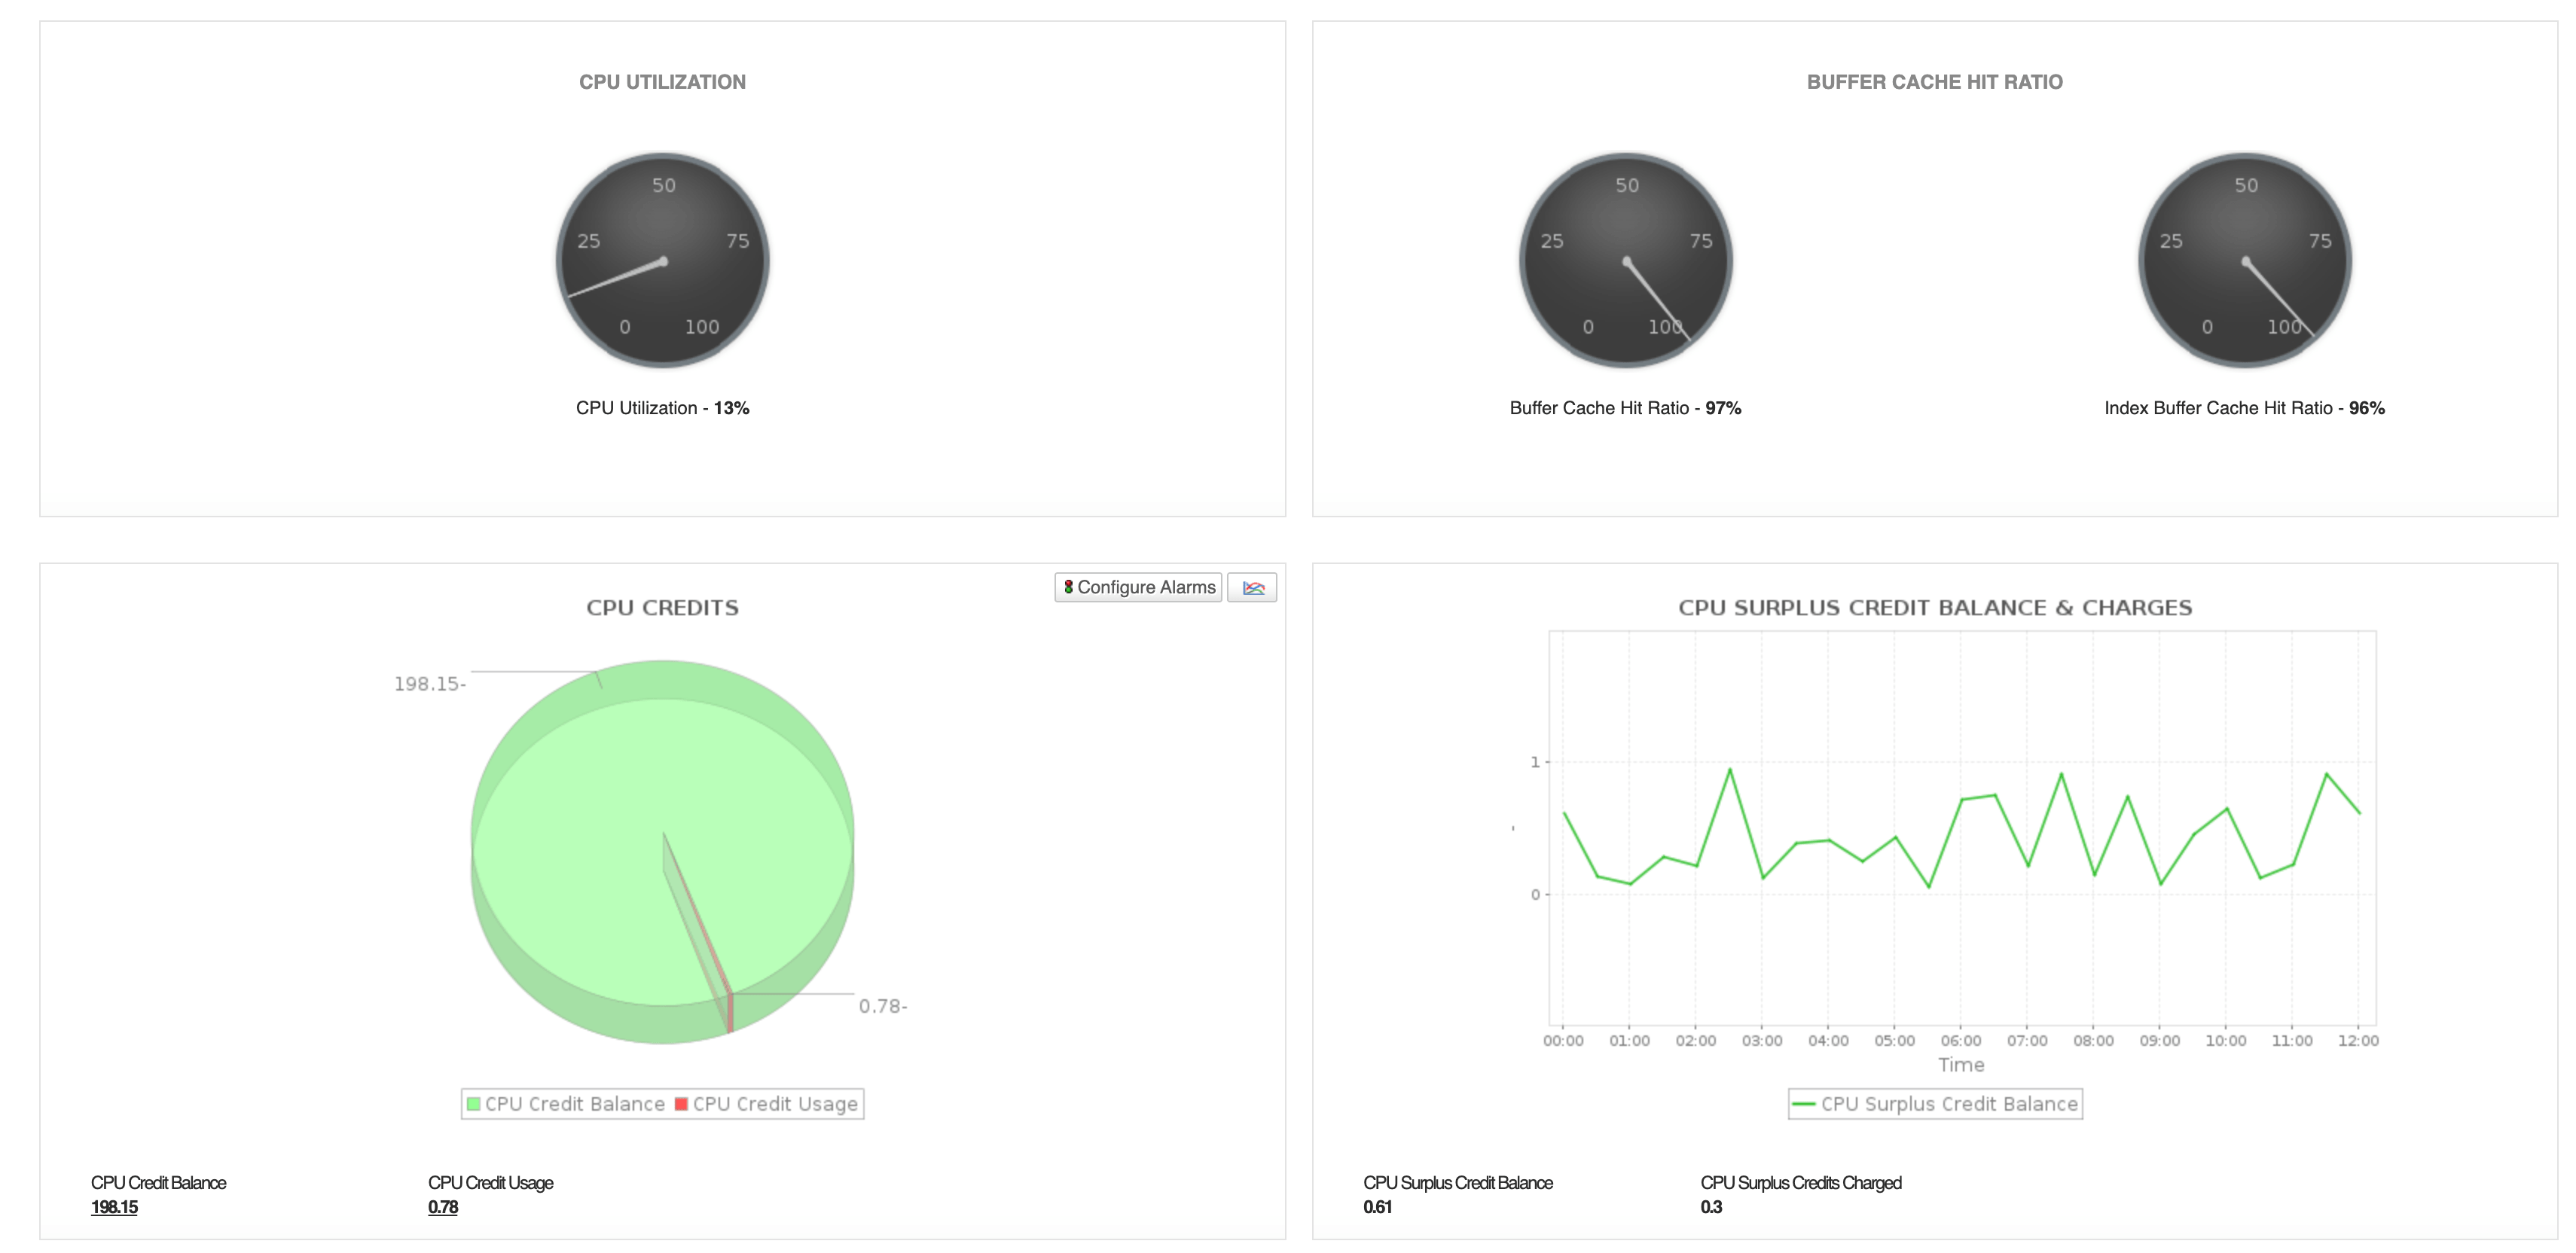
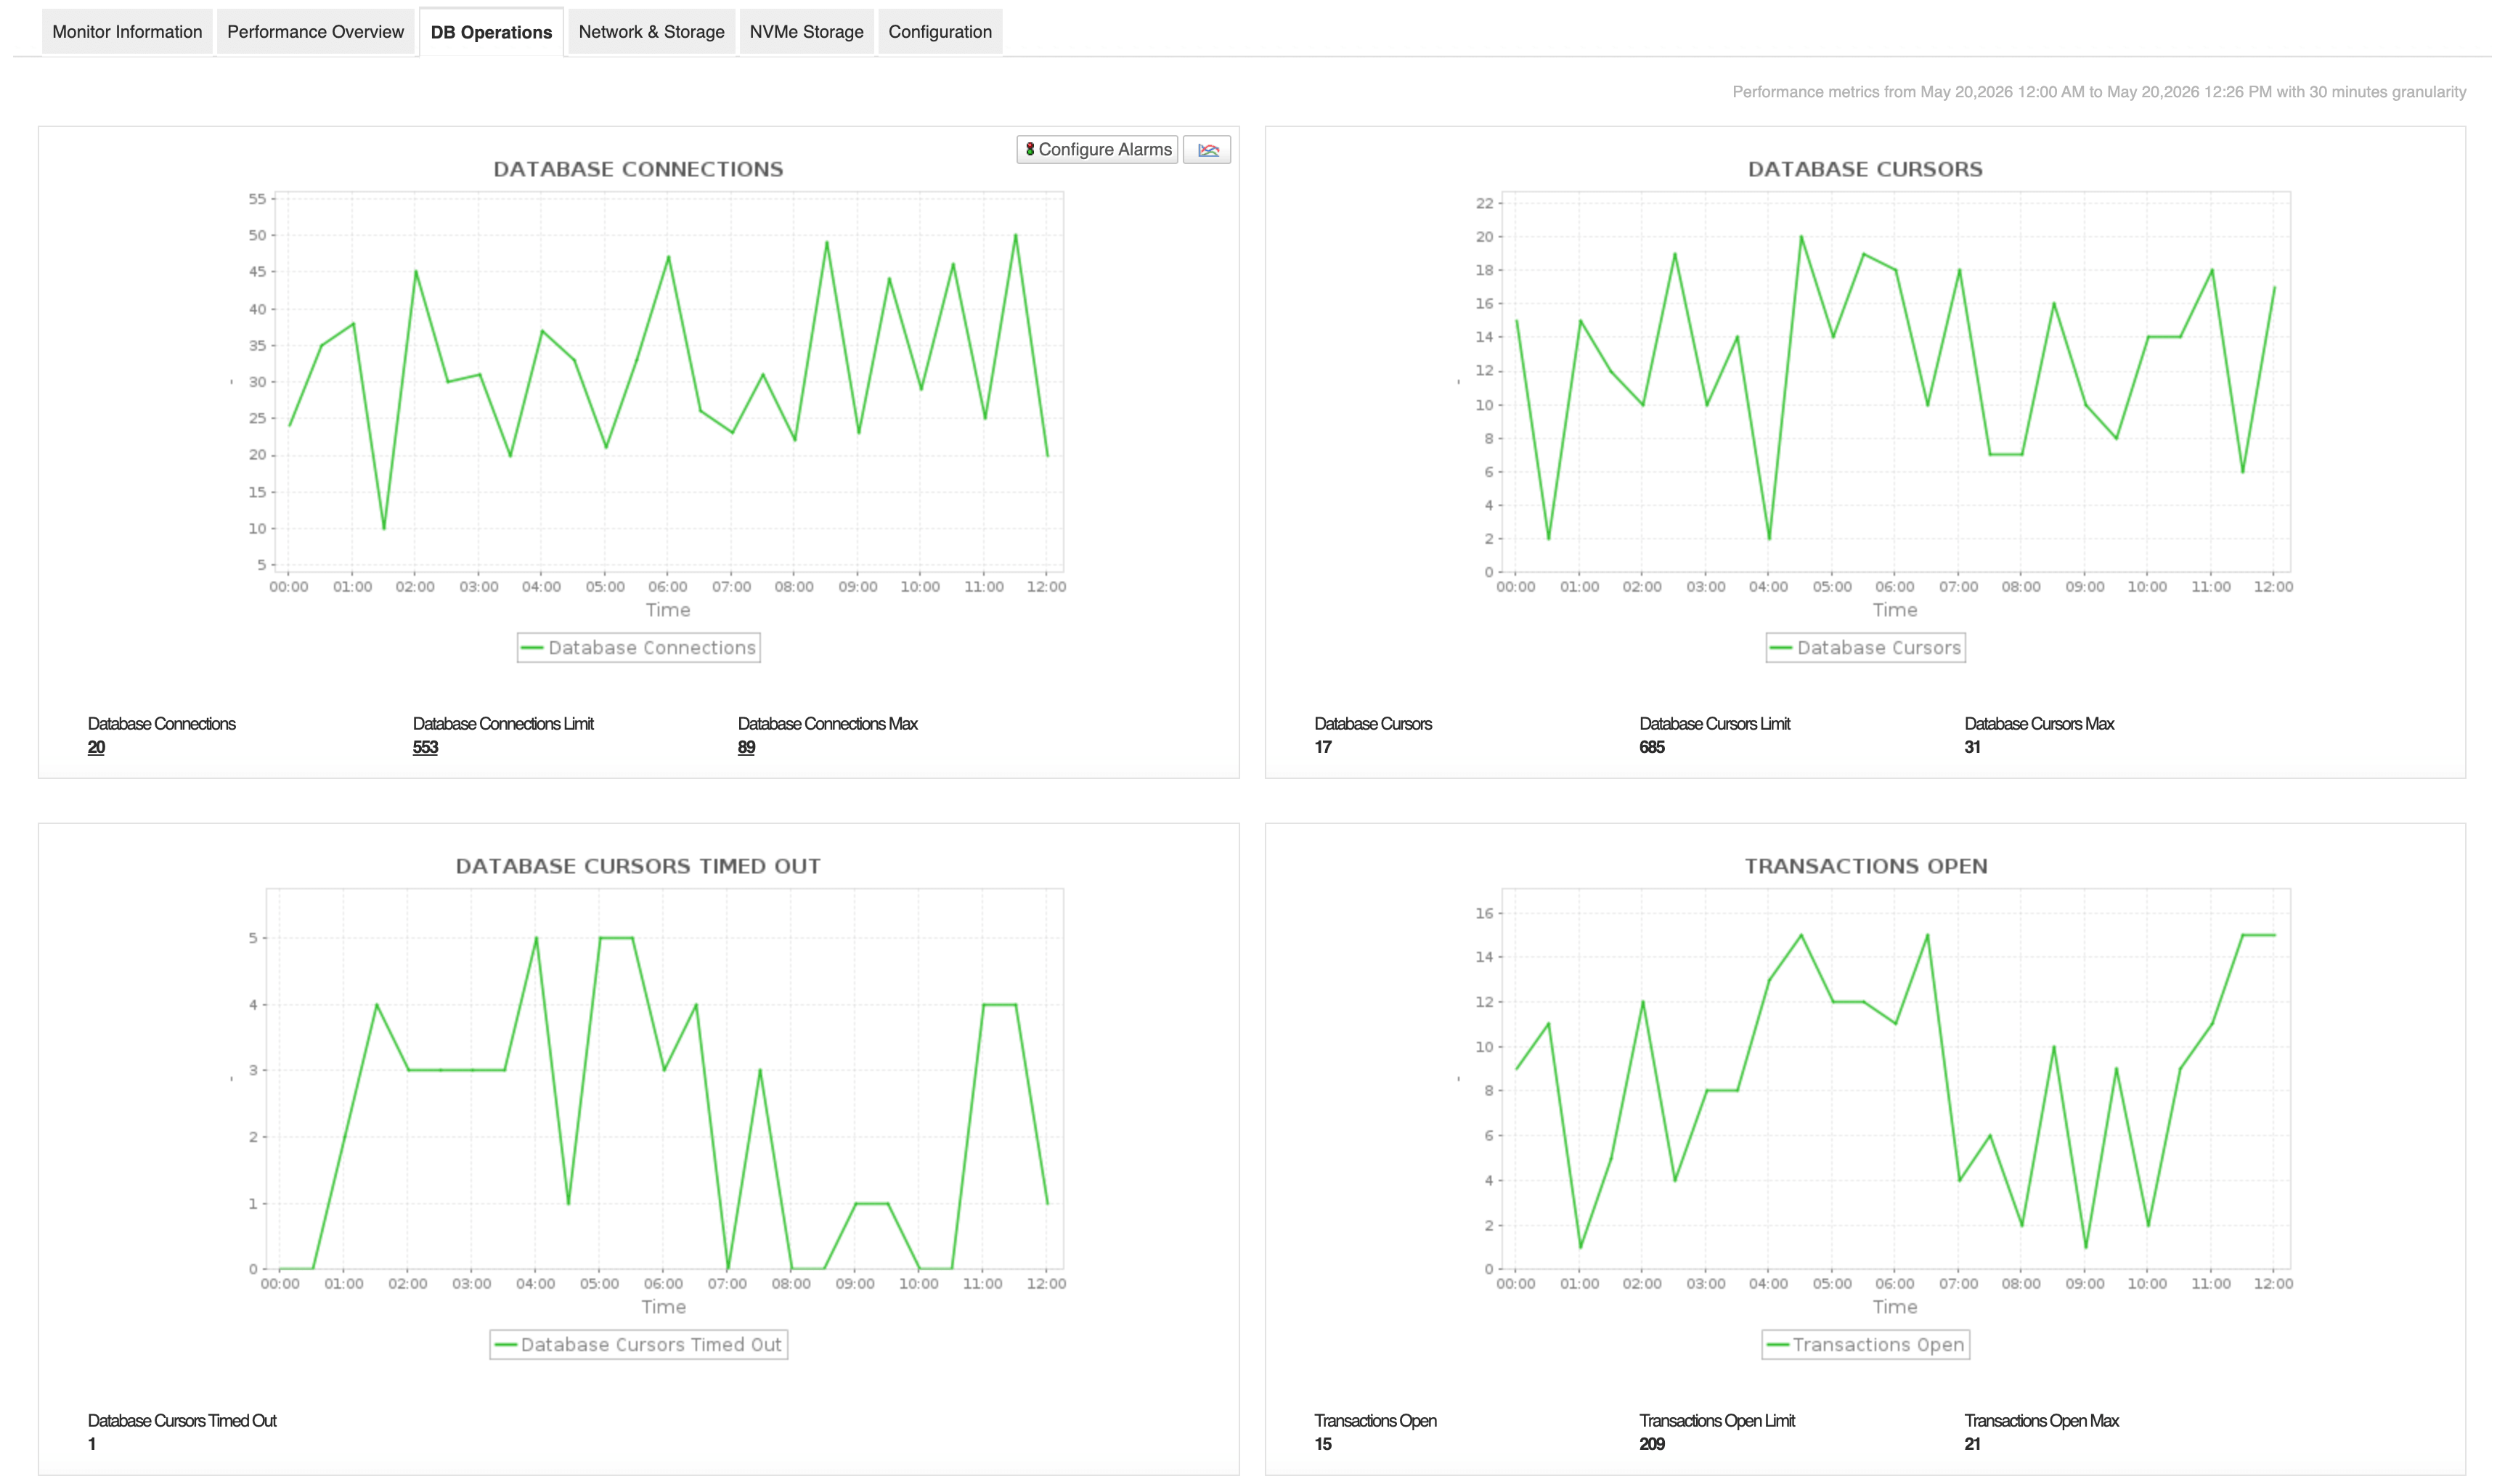
- Ensure optimal database performance by monitoring cluster health, resource utilization, and workload behavior across DocumentDB environments.
- Maintain high availability by tracking cluster status and identifying issues affecting database accessibility or replication.
- Optimize resource usage by monitoring CPU, memory, storage, and throughput metrics to prevent performance bottlenecks.
- Improve capacity planning by analyzing database utilization trends and scaling requirements proactively.
- Reduce operational risks by receiving alerts on abnormal cluster behavior and performance degradation.
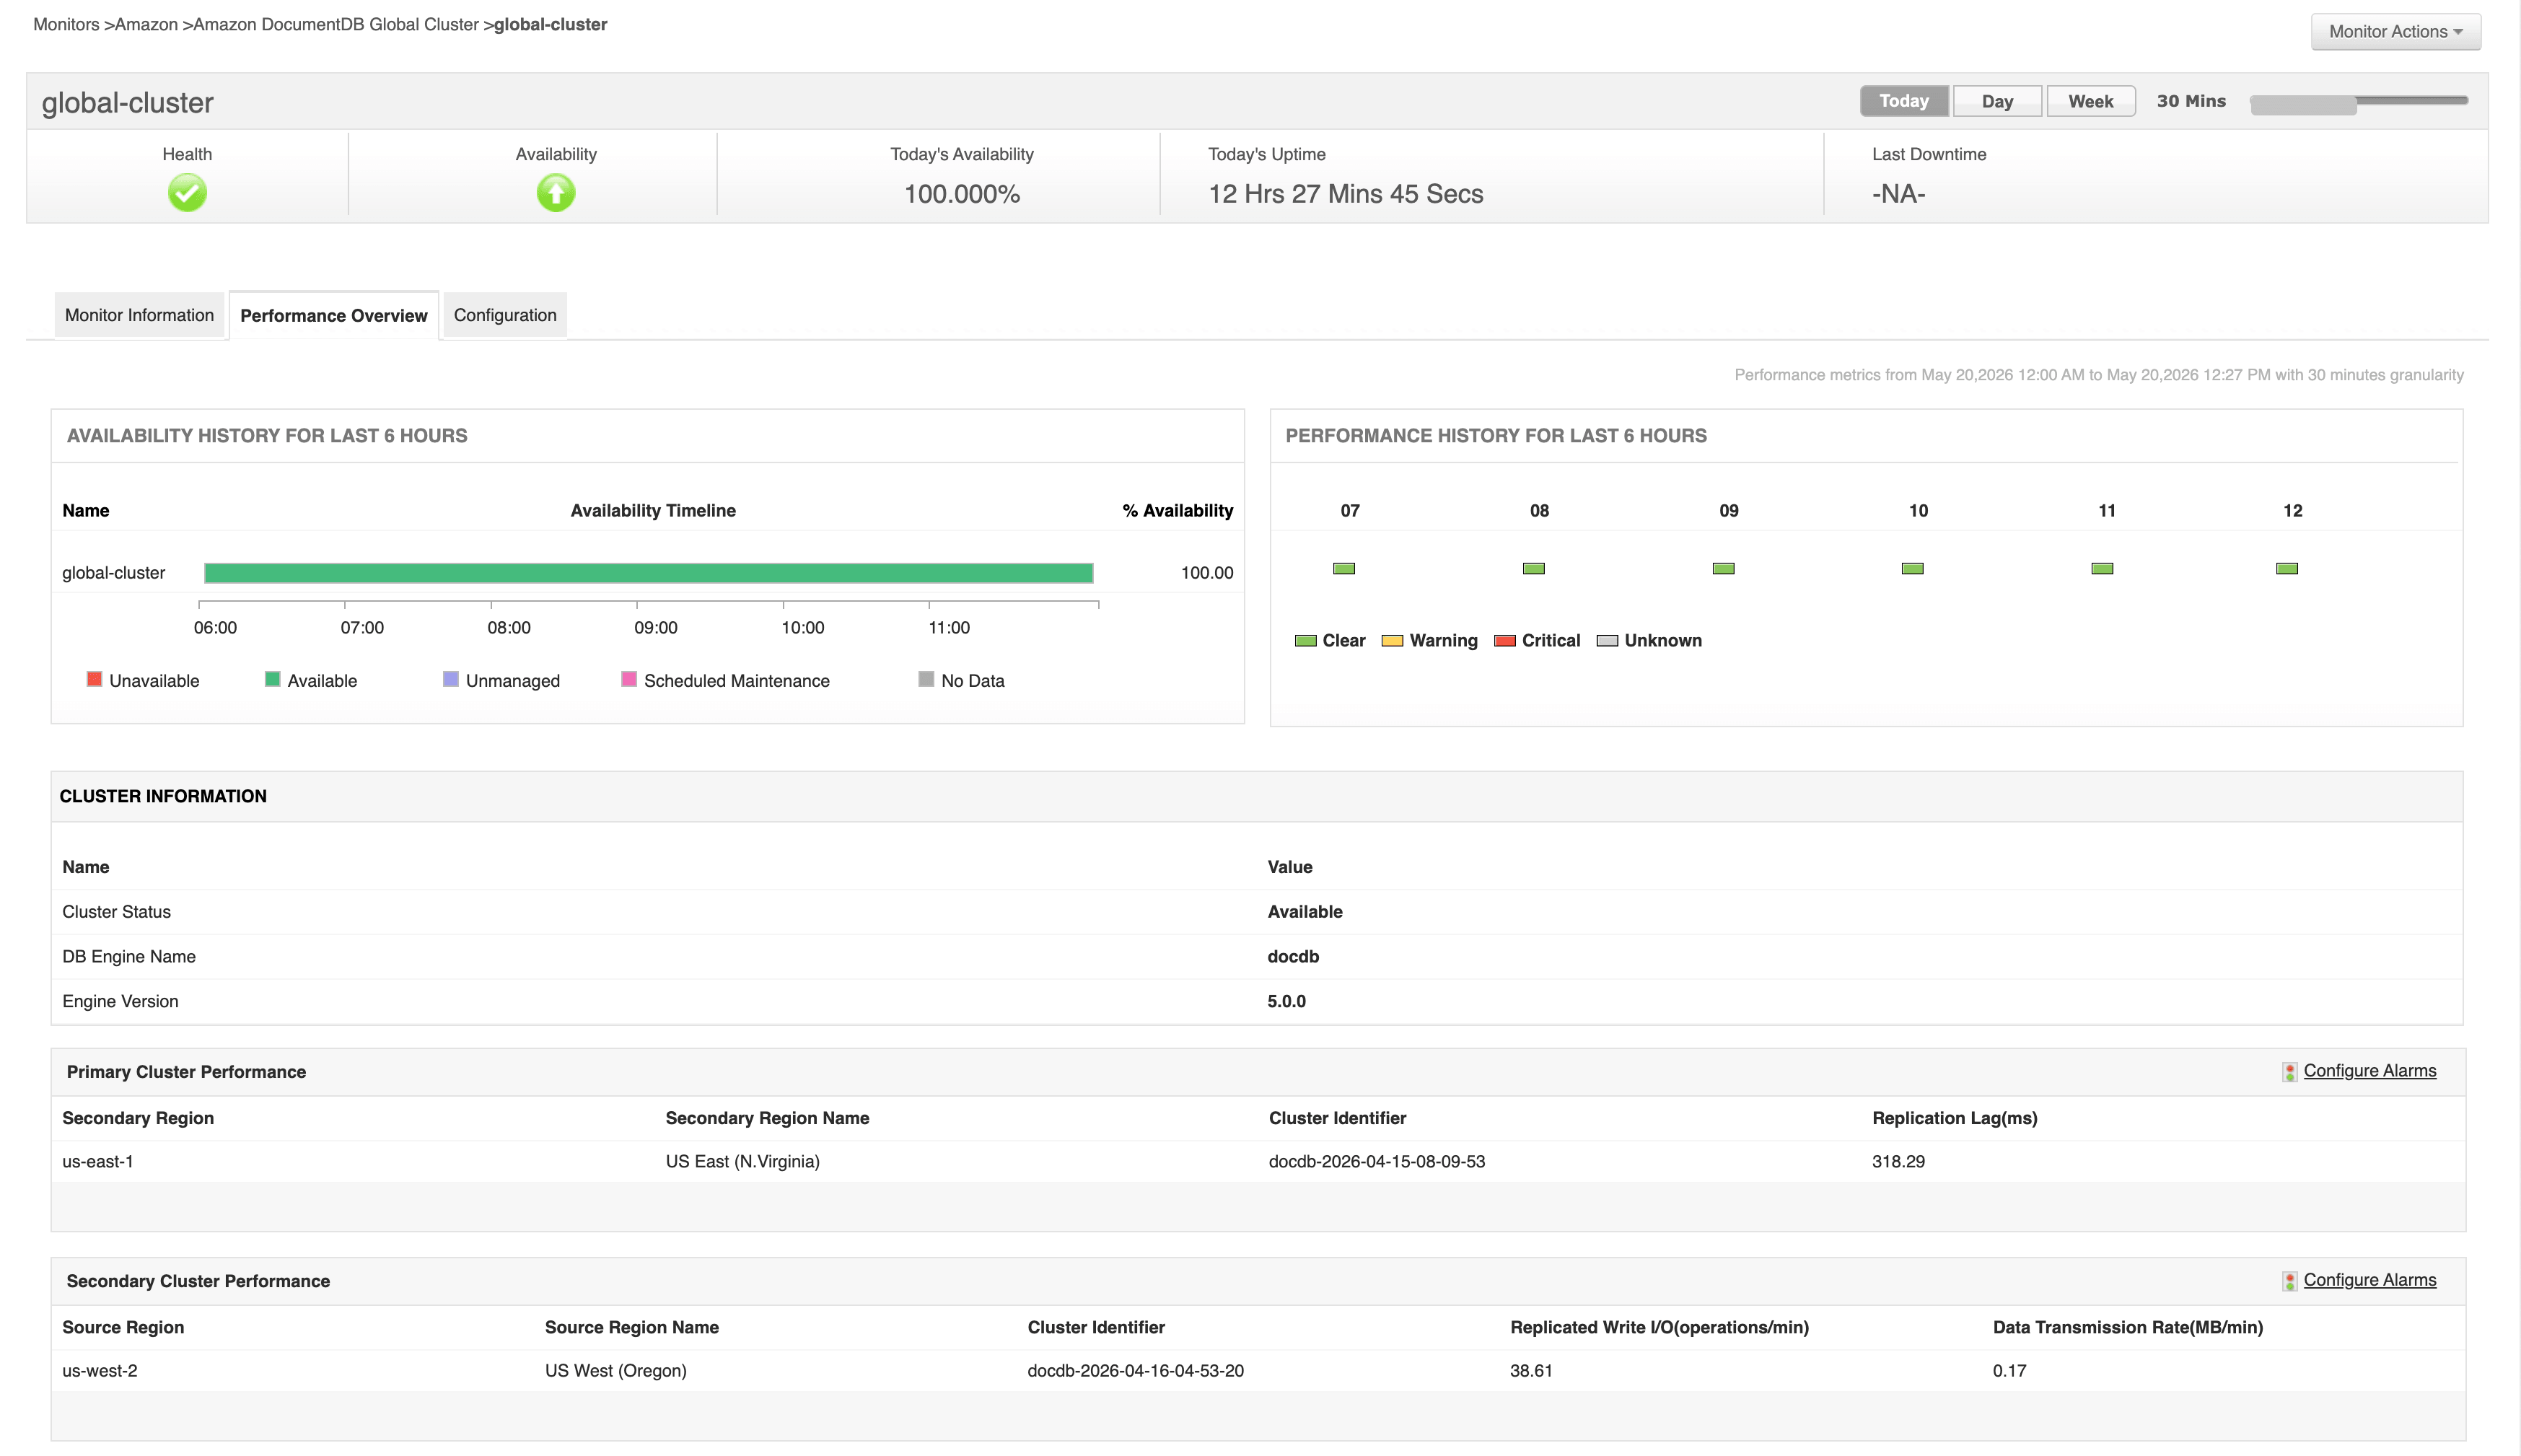
Amazon DocumentDB Global Cluster Monitoring
Amazon DocumentDB Global Cluster enables globally distributed DocumentDB deployments with cross-region replication for low-latency access and disaster recovery capabilities.
With Applications Manager, you can:
- Maintain global database availability by monitoring cross-region replication health and identifying synchronization issues.
- Reduce replication-related risks by tracking replication lag and ensuring data consistency across regions.
- Improve disaster recovery readiness through continuous visibility into global cluster status and replication performance.
- Optimize distributed workloads by monitoring regional performance variations and resource utilization.
- Accelerate issue detection with proactive alerts on replication failures or abnormal behavior.
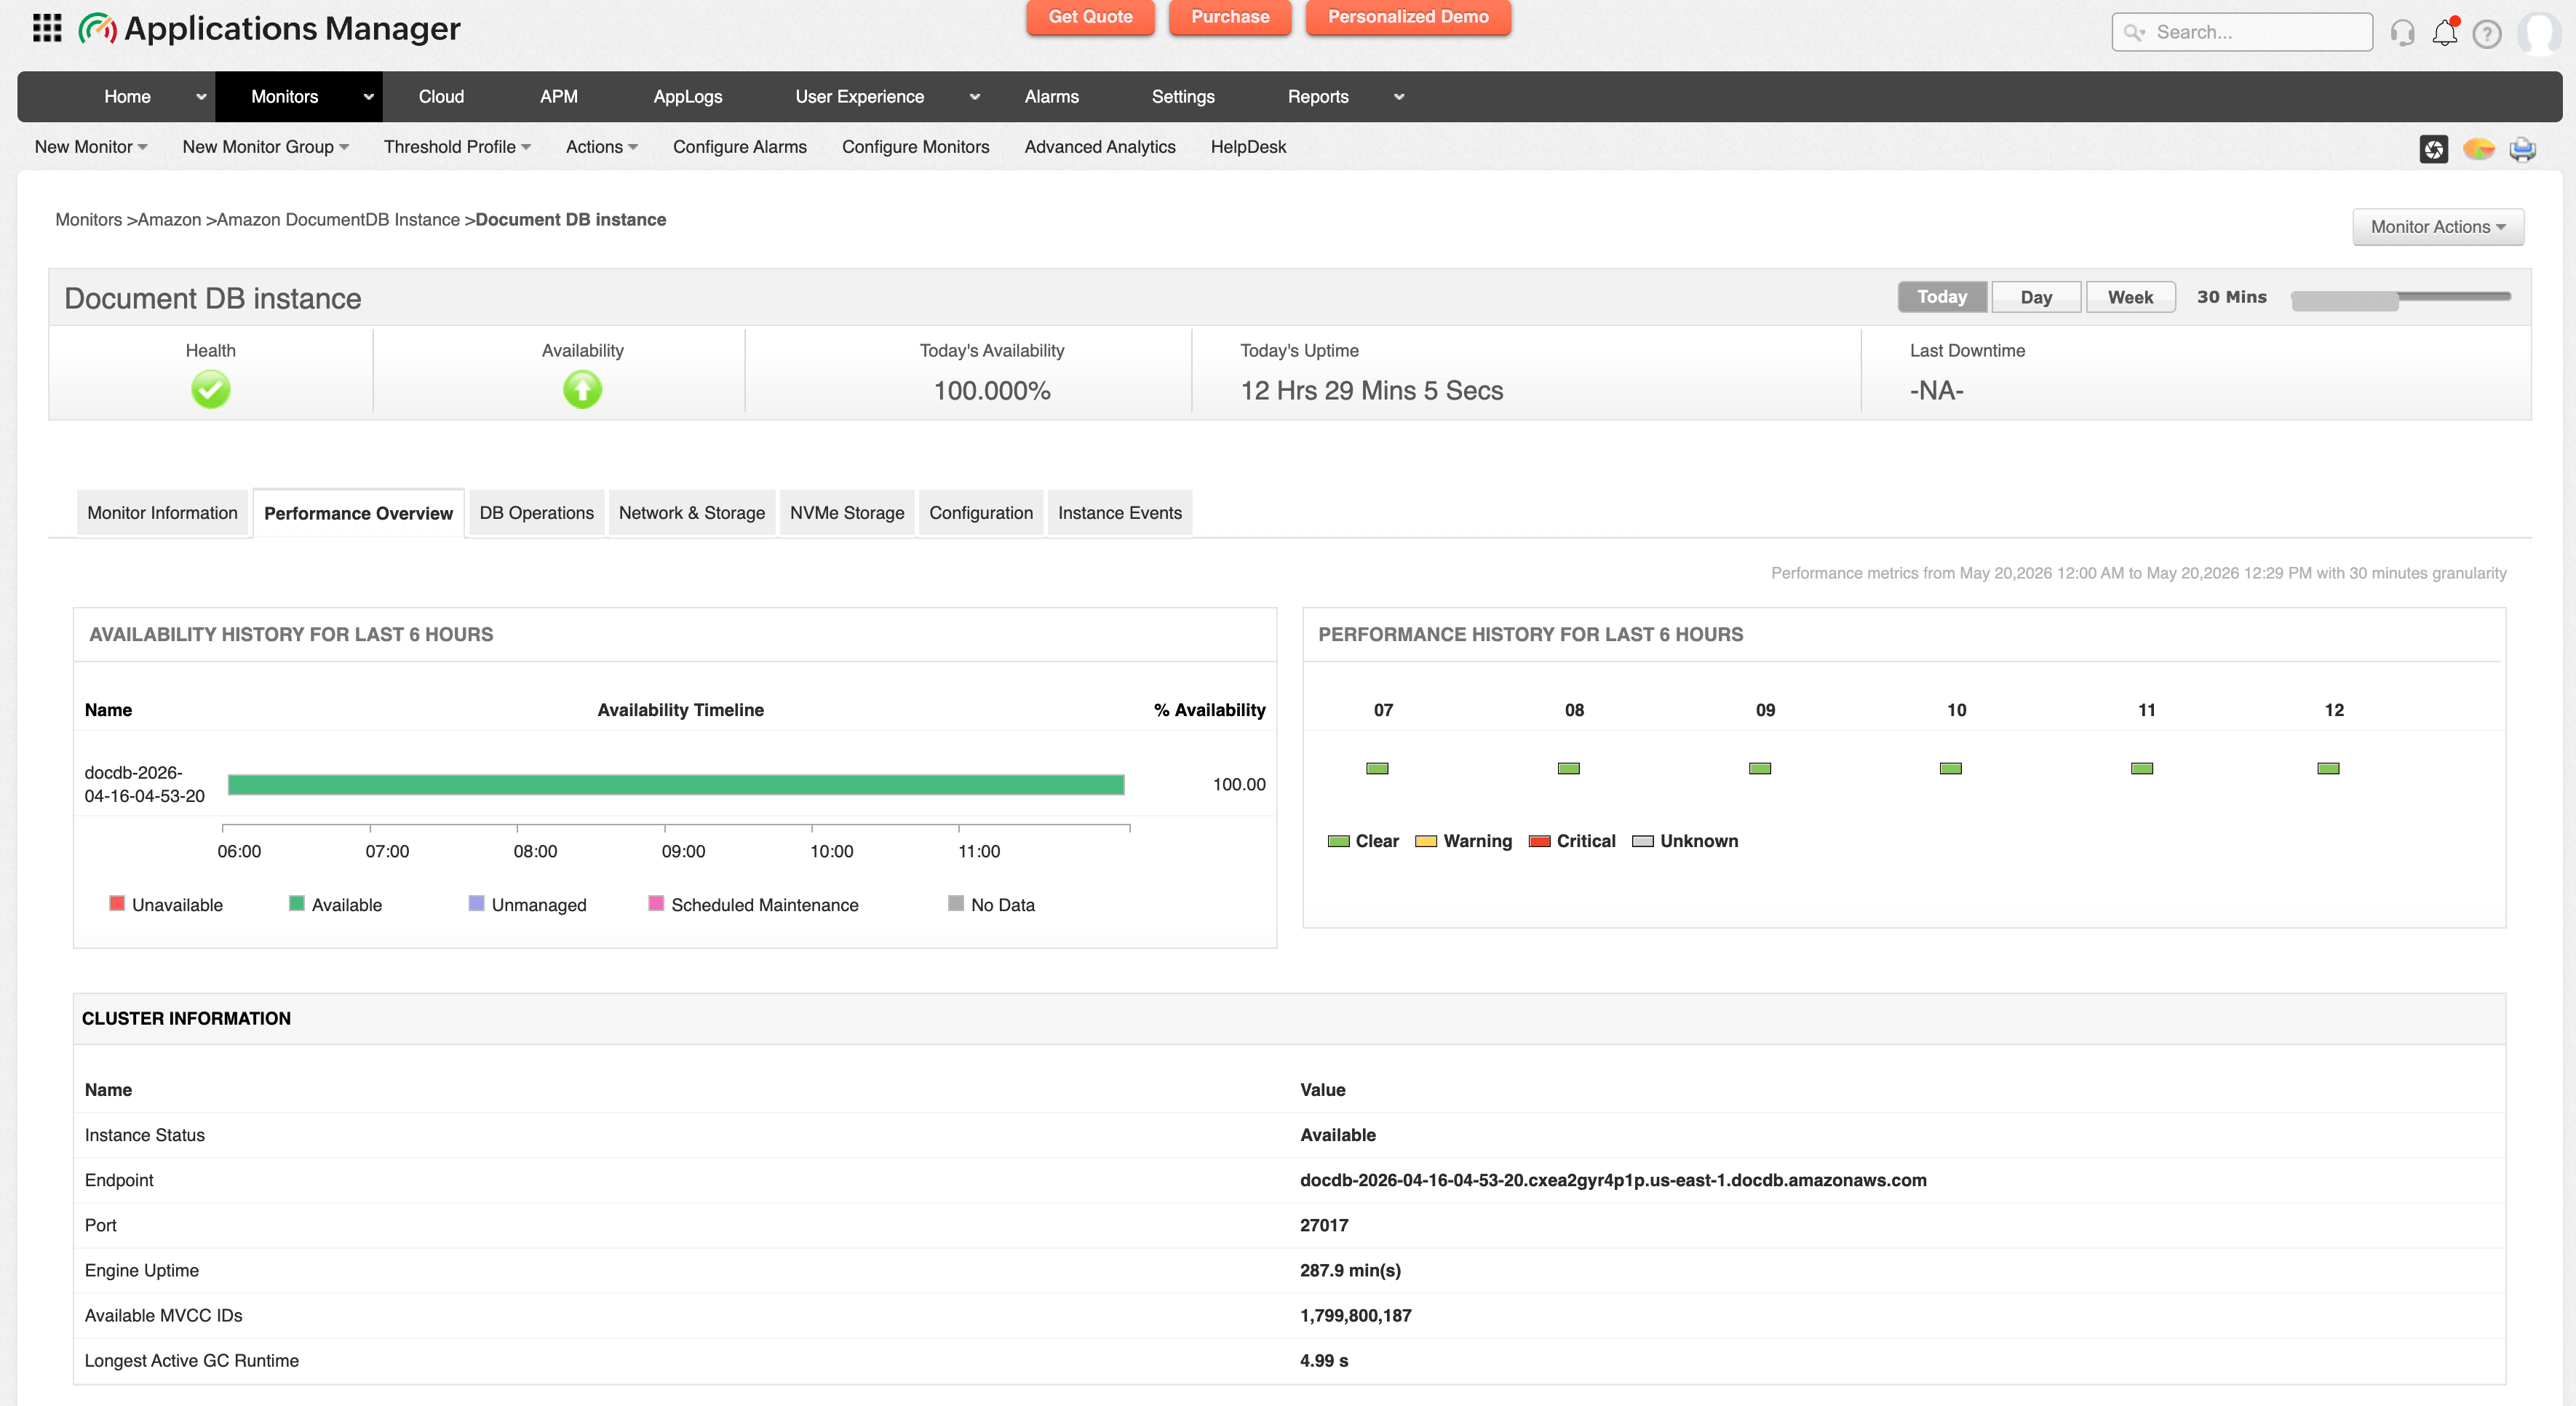
Amazon DocumentDB Instance Monitoring
Amazon DocumentDB Instances are individual compute resources within a DocumentDB cluster responsible for processing database workloads.
With Applications Manager, you can:
- Monitor instance-level performance by tracking CPU, memory, storage, and workload utilization continuously.
- Prevent performance degradation by identifying resource bottlenecks affecting query execution and application responsiveness.
- Ensure database reliability through proactive monitoring of instance health and operational status.
- Improve workload distribution by analyzing utilization patterns and balancing database workloads efficiently.
- Reduce downtime risks with alerts on abnormal instance behavior or resource exhaustion.
Amazon DynamoDB Monitoring
Amazon DynamoDB is a fully managed, serverless NoSQL database service that delivers reliable performance at any scale. It supports key-value and document data structures, offers built-in security, backup and restore, and in-memory caching for internet-scale applications.
With Applications Manager, you can:
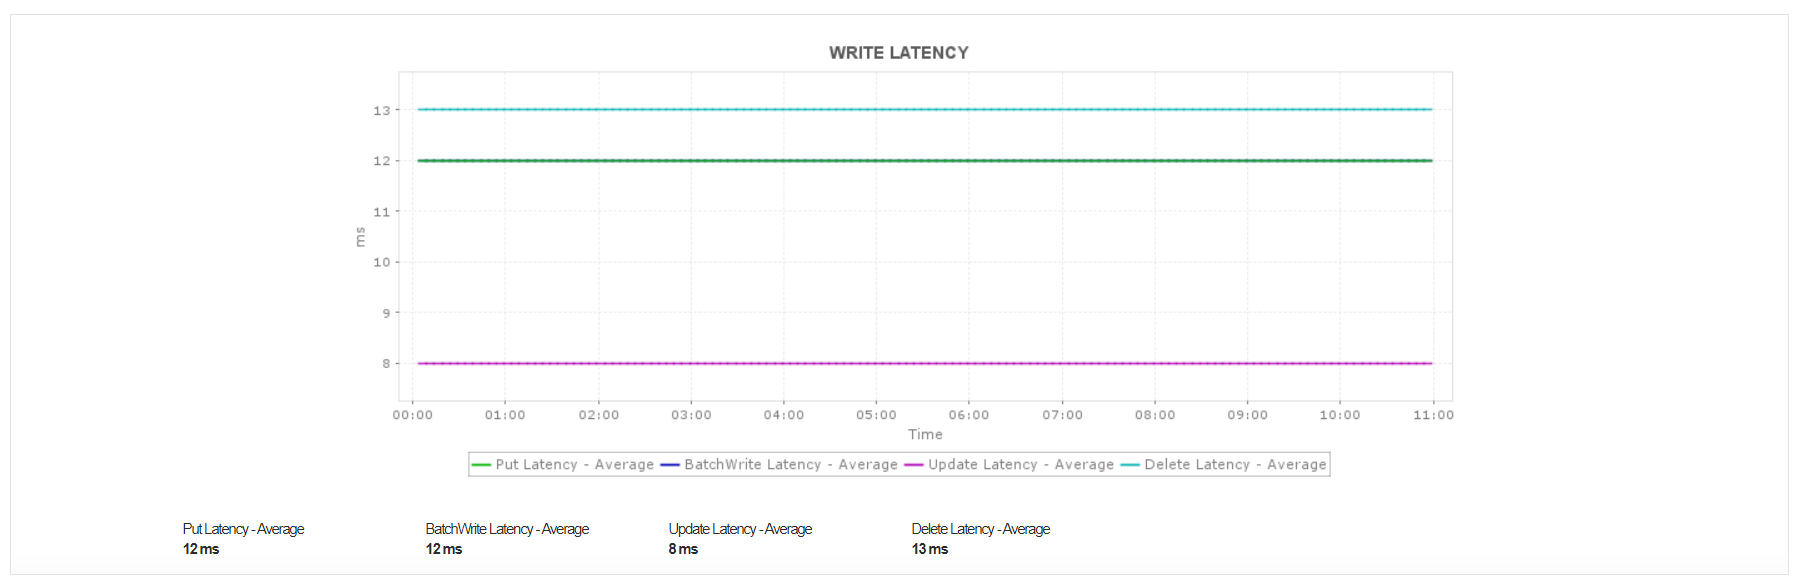
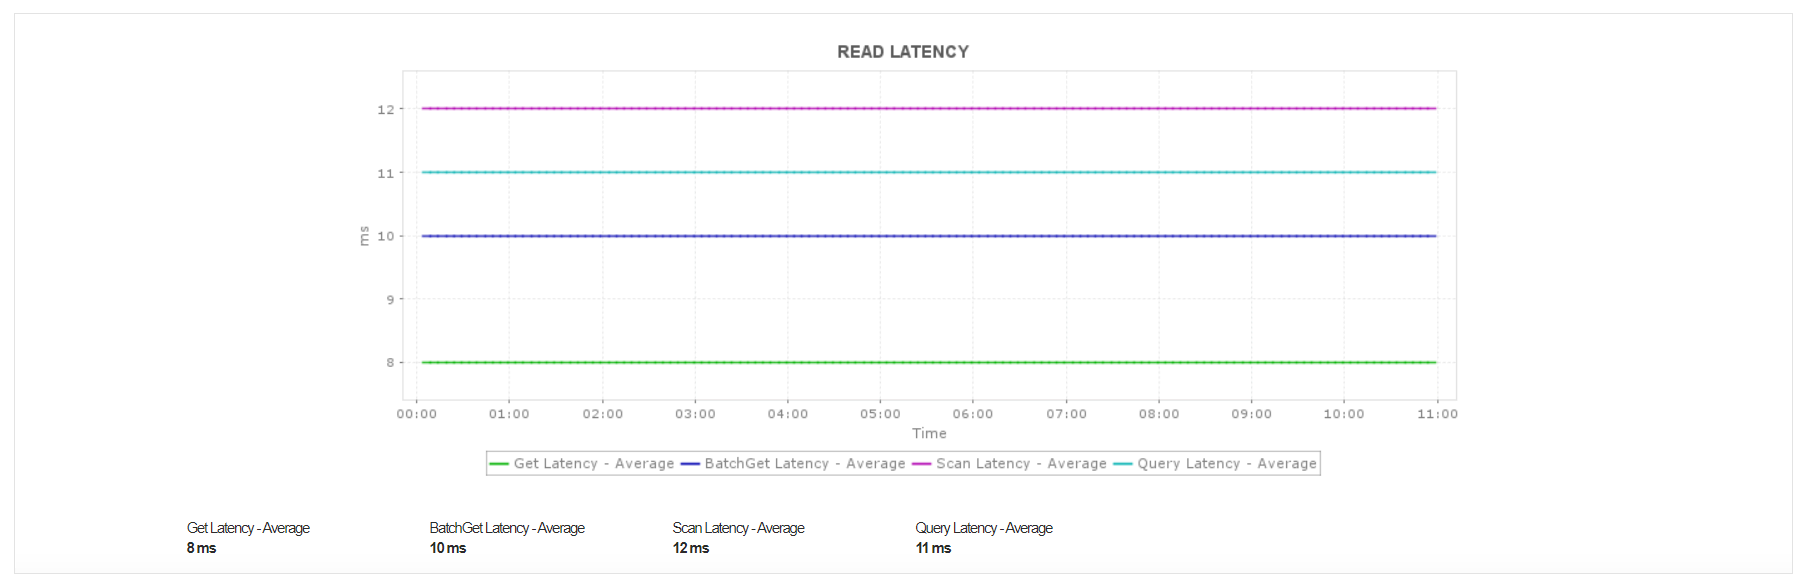
- Gain insight into database performance by tracking request latency for read/write operations like GET, PUT, and Scan.
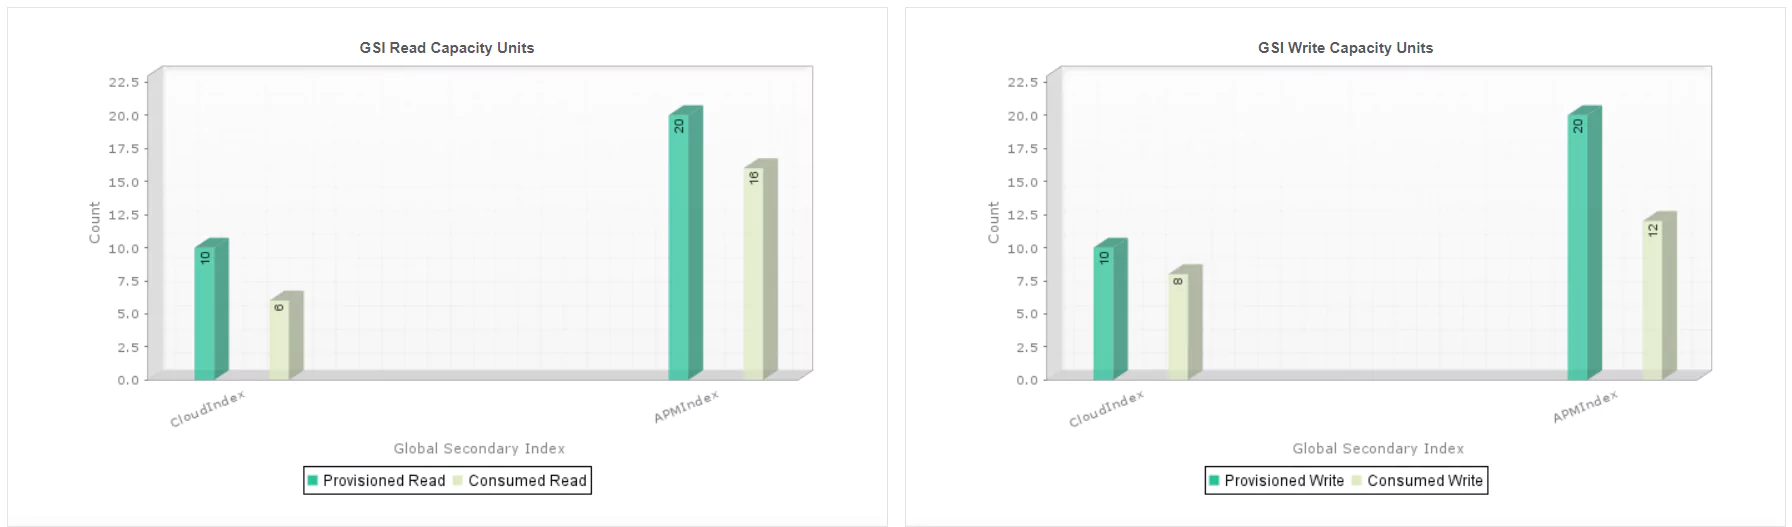
- Plan capacity and optimize resource consumption by monitoring provisioned throughput and consumed read/write capacity units.
- Troubleshoot request throttling by setting up thresholds and receiving alerts when throttled events are generated.
- Handle errors and exceptions by monitoring system errors (HTTP 500), user errors (HTTP 400), and conditional check failures.
- Detect real-time performance issues and bottlenecks to take quick remedial action before end-users are affected.
Learn more about Amazon DynamoDB monitoring.

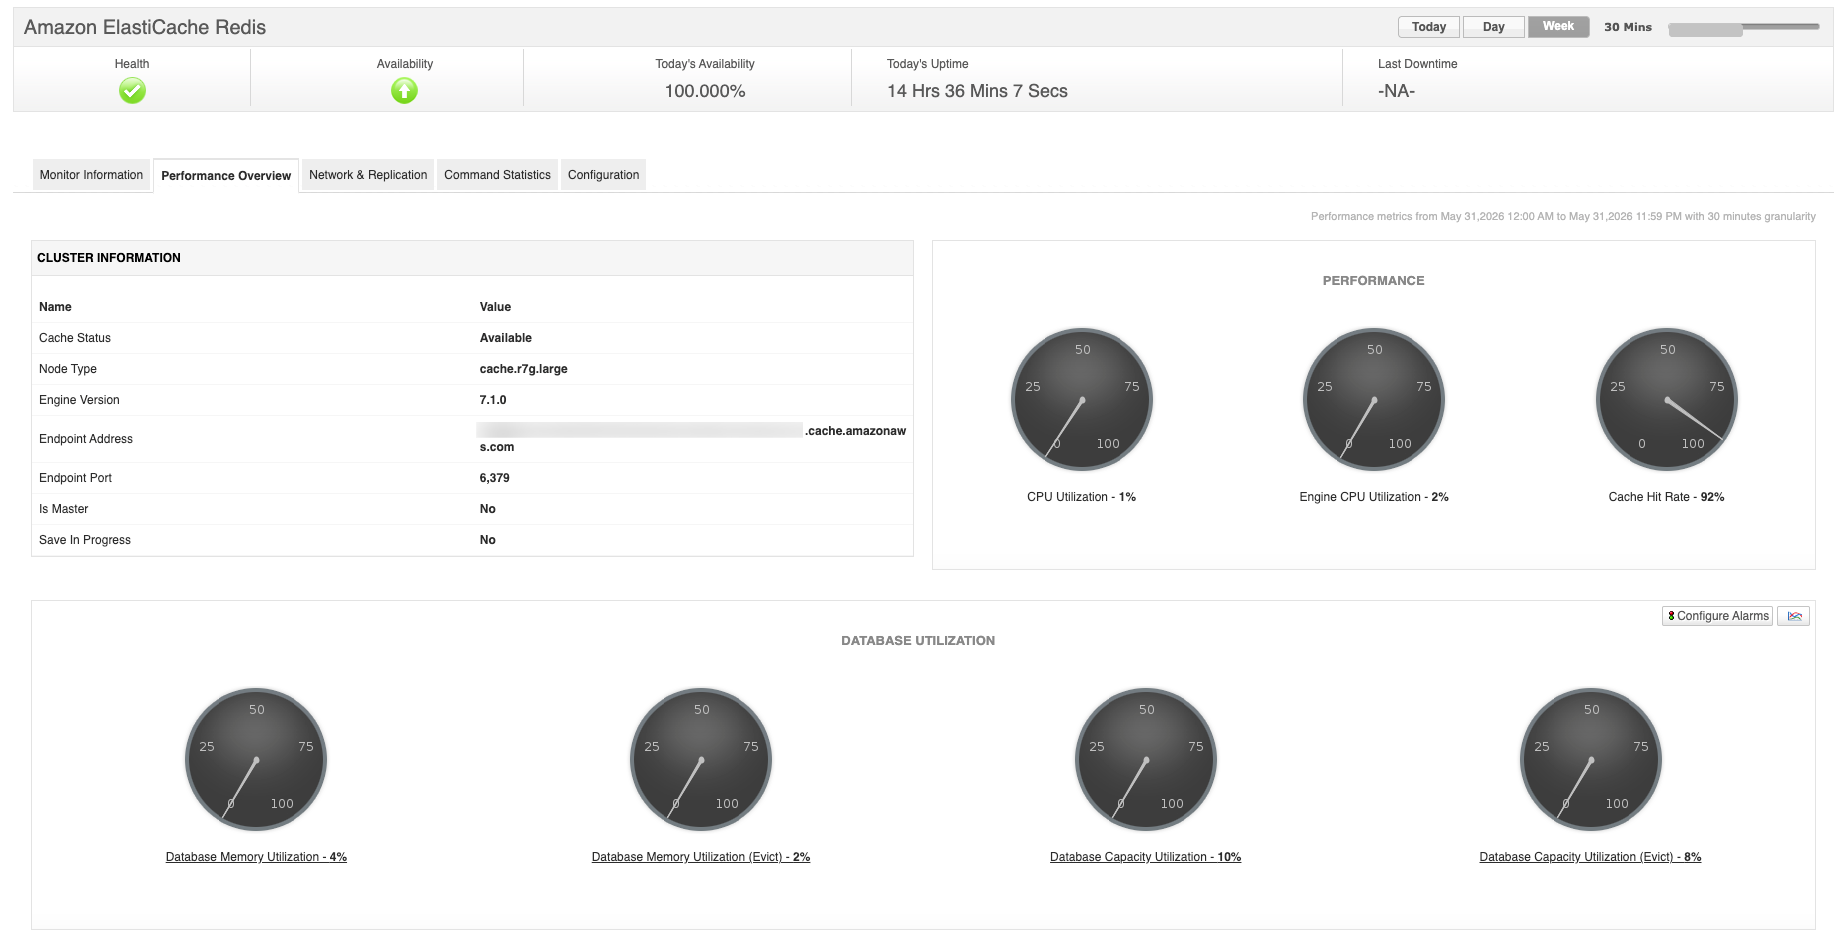
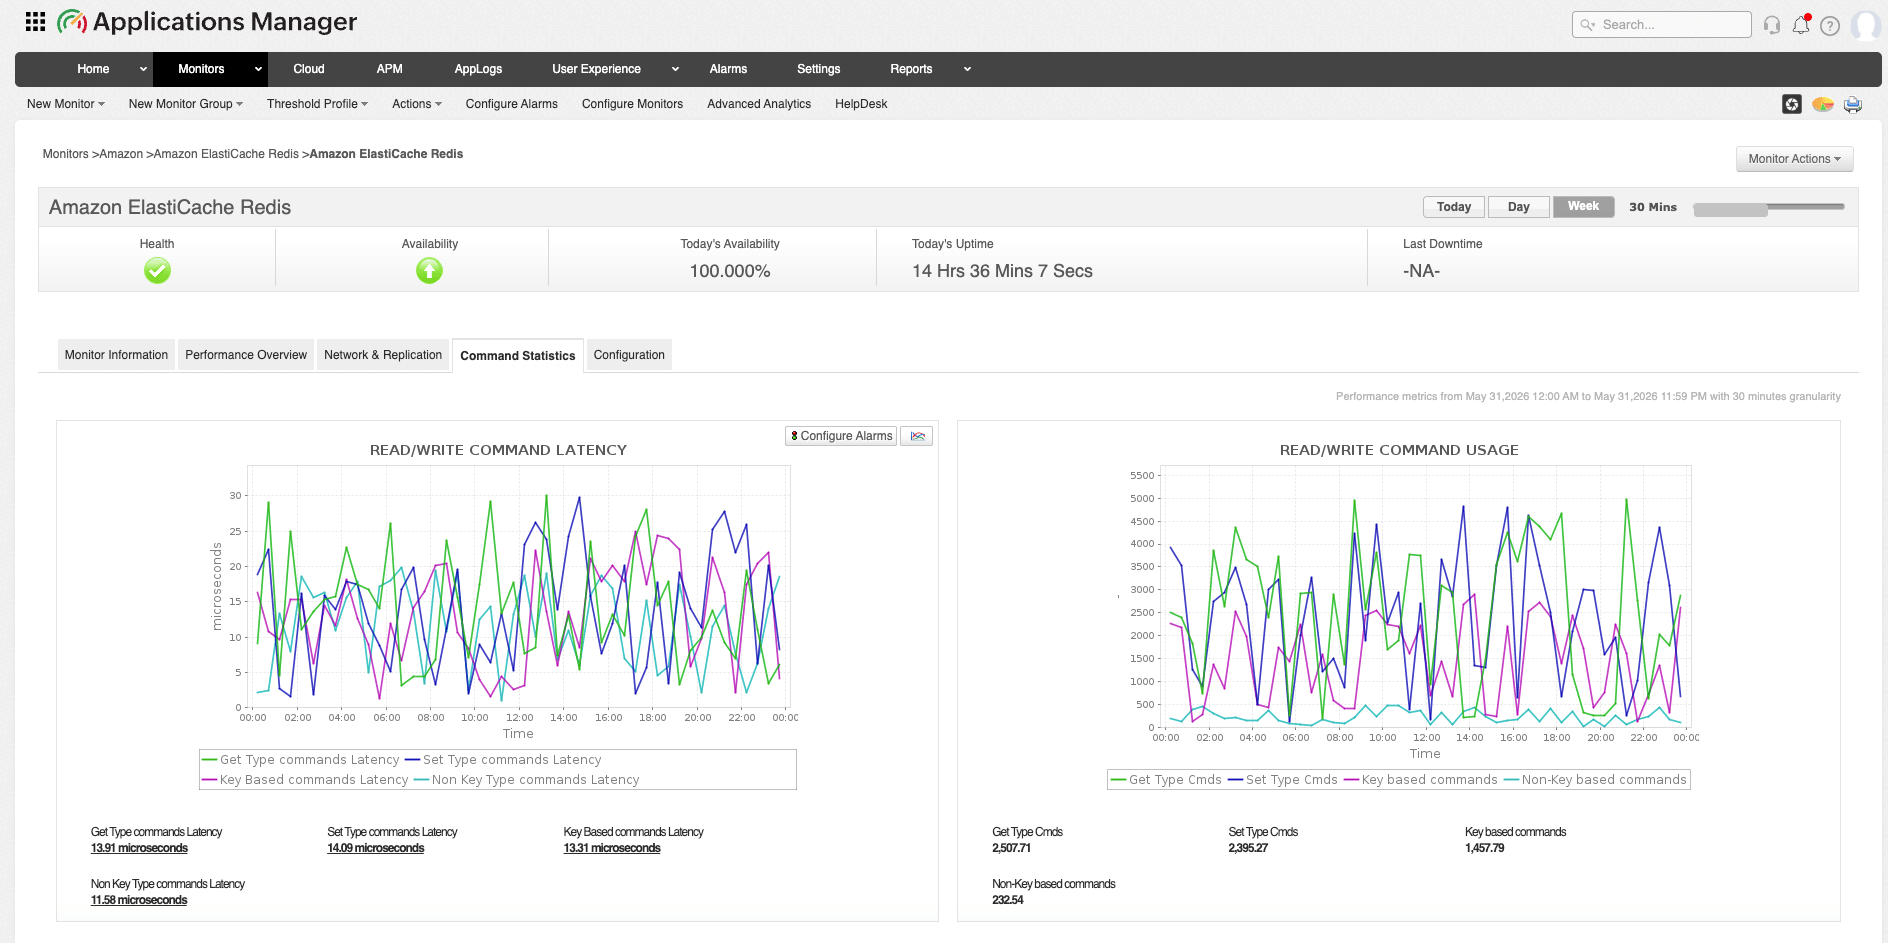
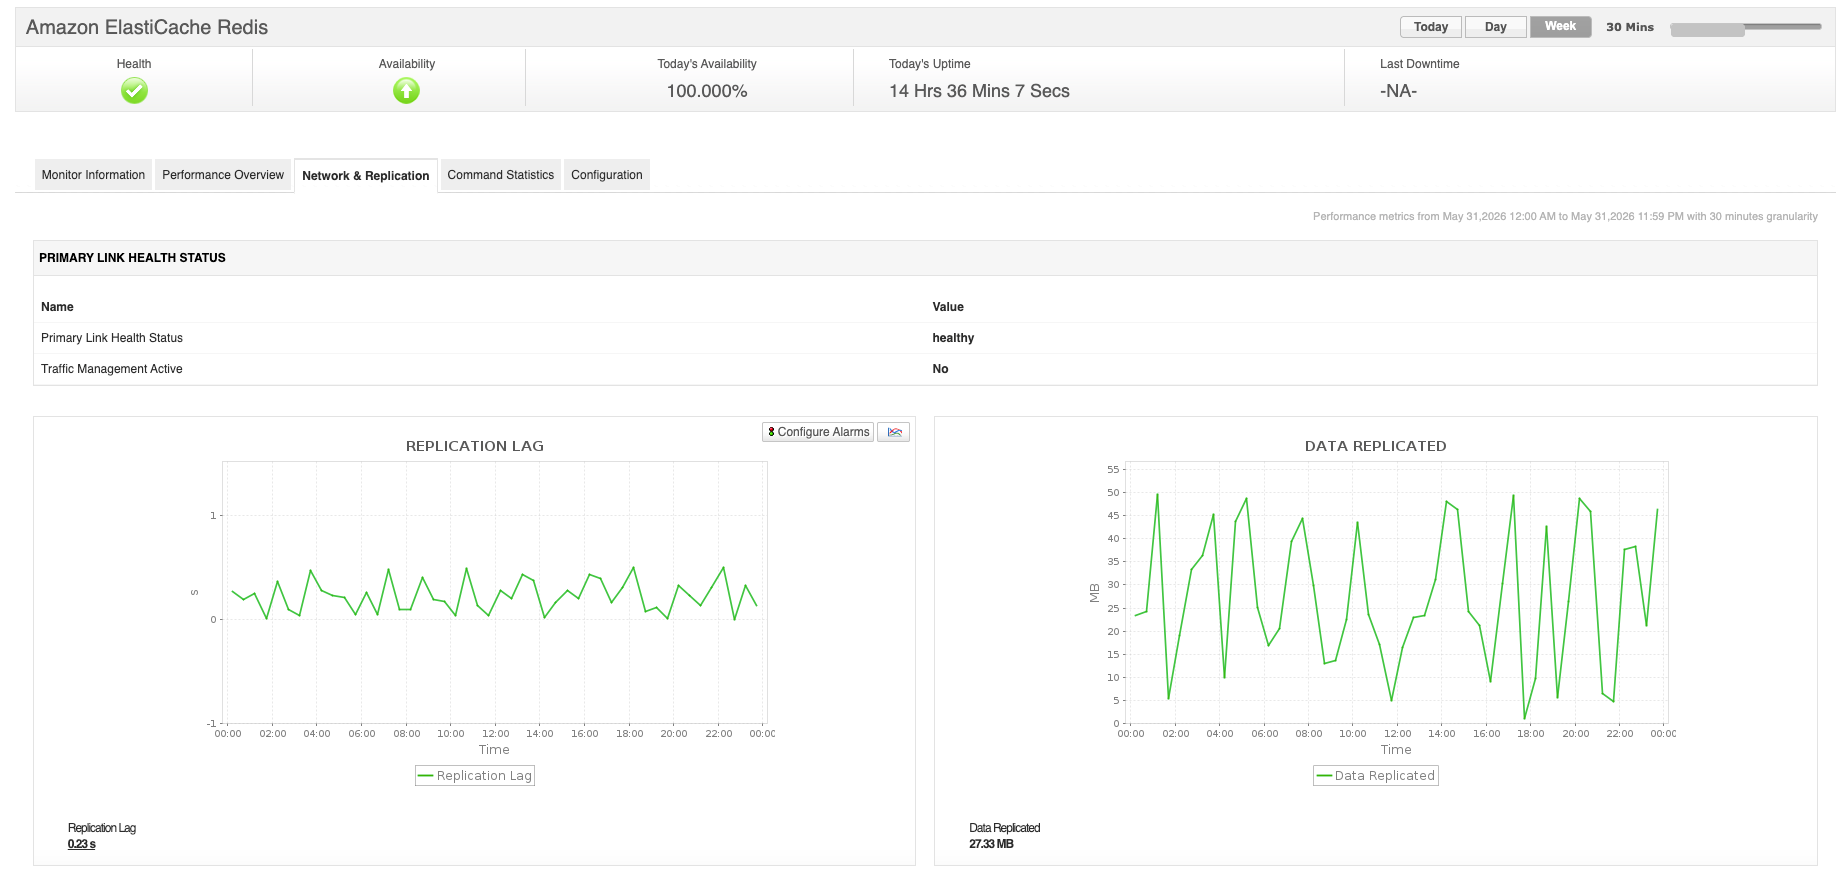
Amazon ElastiCache Redis Monitoring
Amazon ElastiCache for Redis is a fully managed, in-memory caching service that supports real-time applications with sub-millisecond latency. It is commonly used for caching, session management, real-time analytics, and message brokering.
With Applications Manager, you can:
- Ensure optimal cache performance by monitoring CPU utilization, memory usage, and cache hit rates across your Redis nodes.
- Maintain high availability by tracking replication health, primary link status, and cluster operational state.
- Optimize resource usage by monitoring connections, swap usage, and memory fragmentation metrics to prevent performance bottlenecks.
- Improve capacity planning by analyzing cache utilization trends and key eviction patterns.
- Reduce operational risks by receiving alerts on authentication failures, connection limits exceeded, and abnormal network behavior.
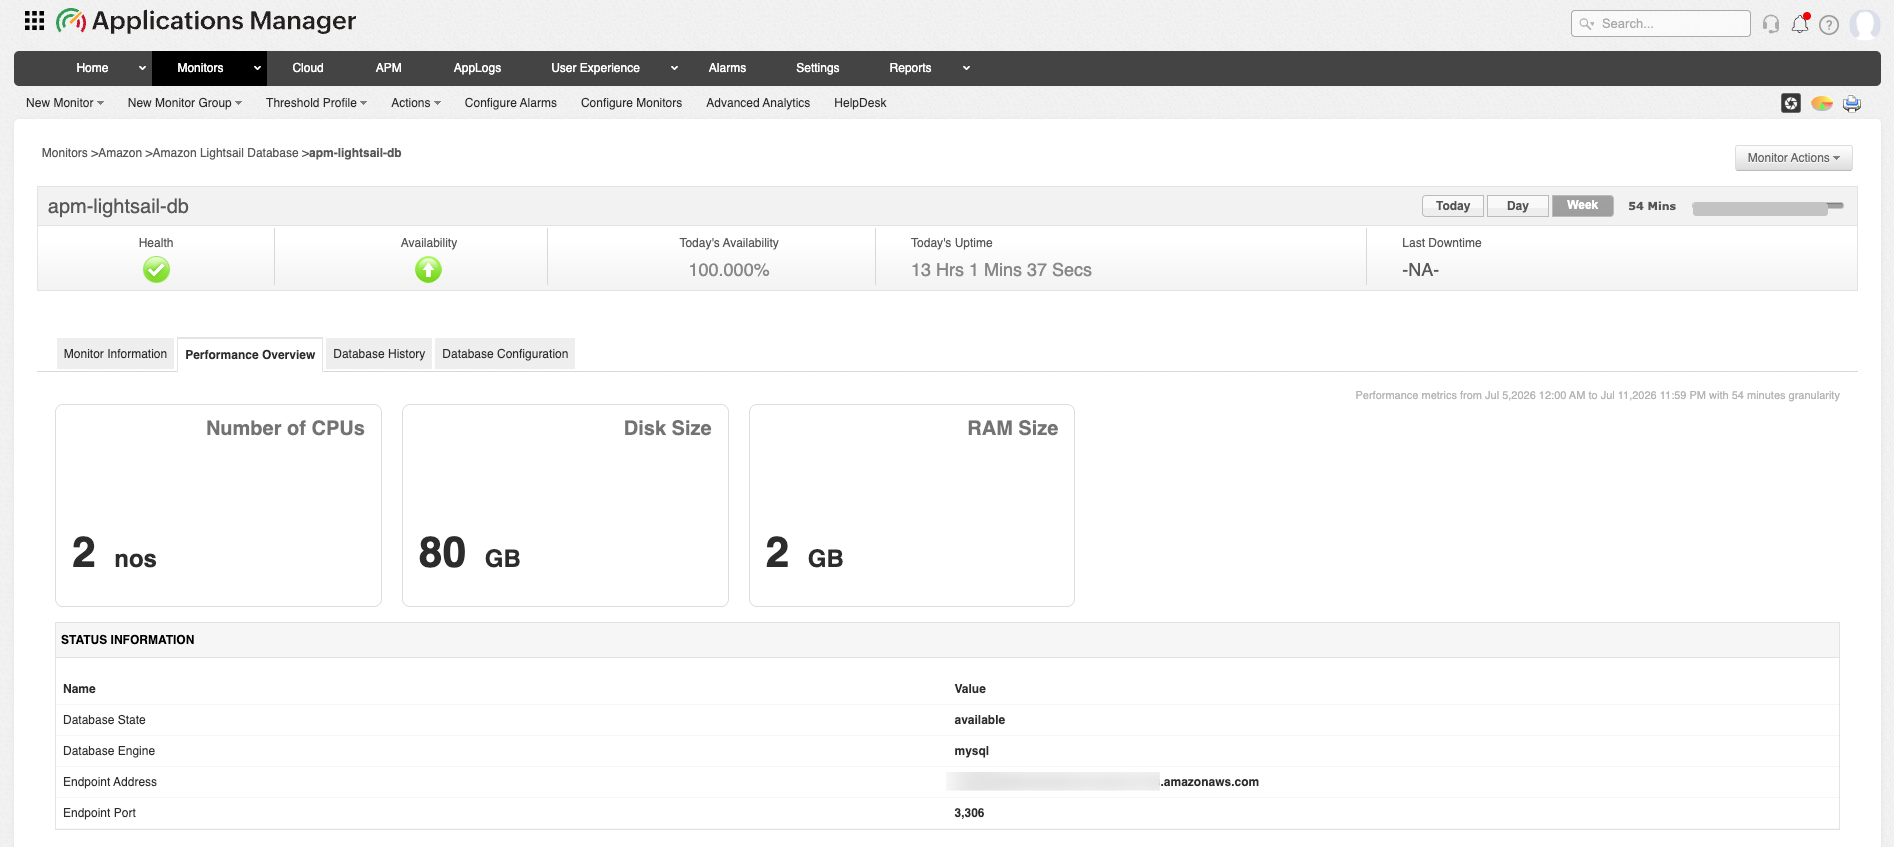
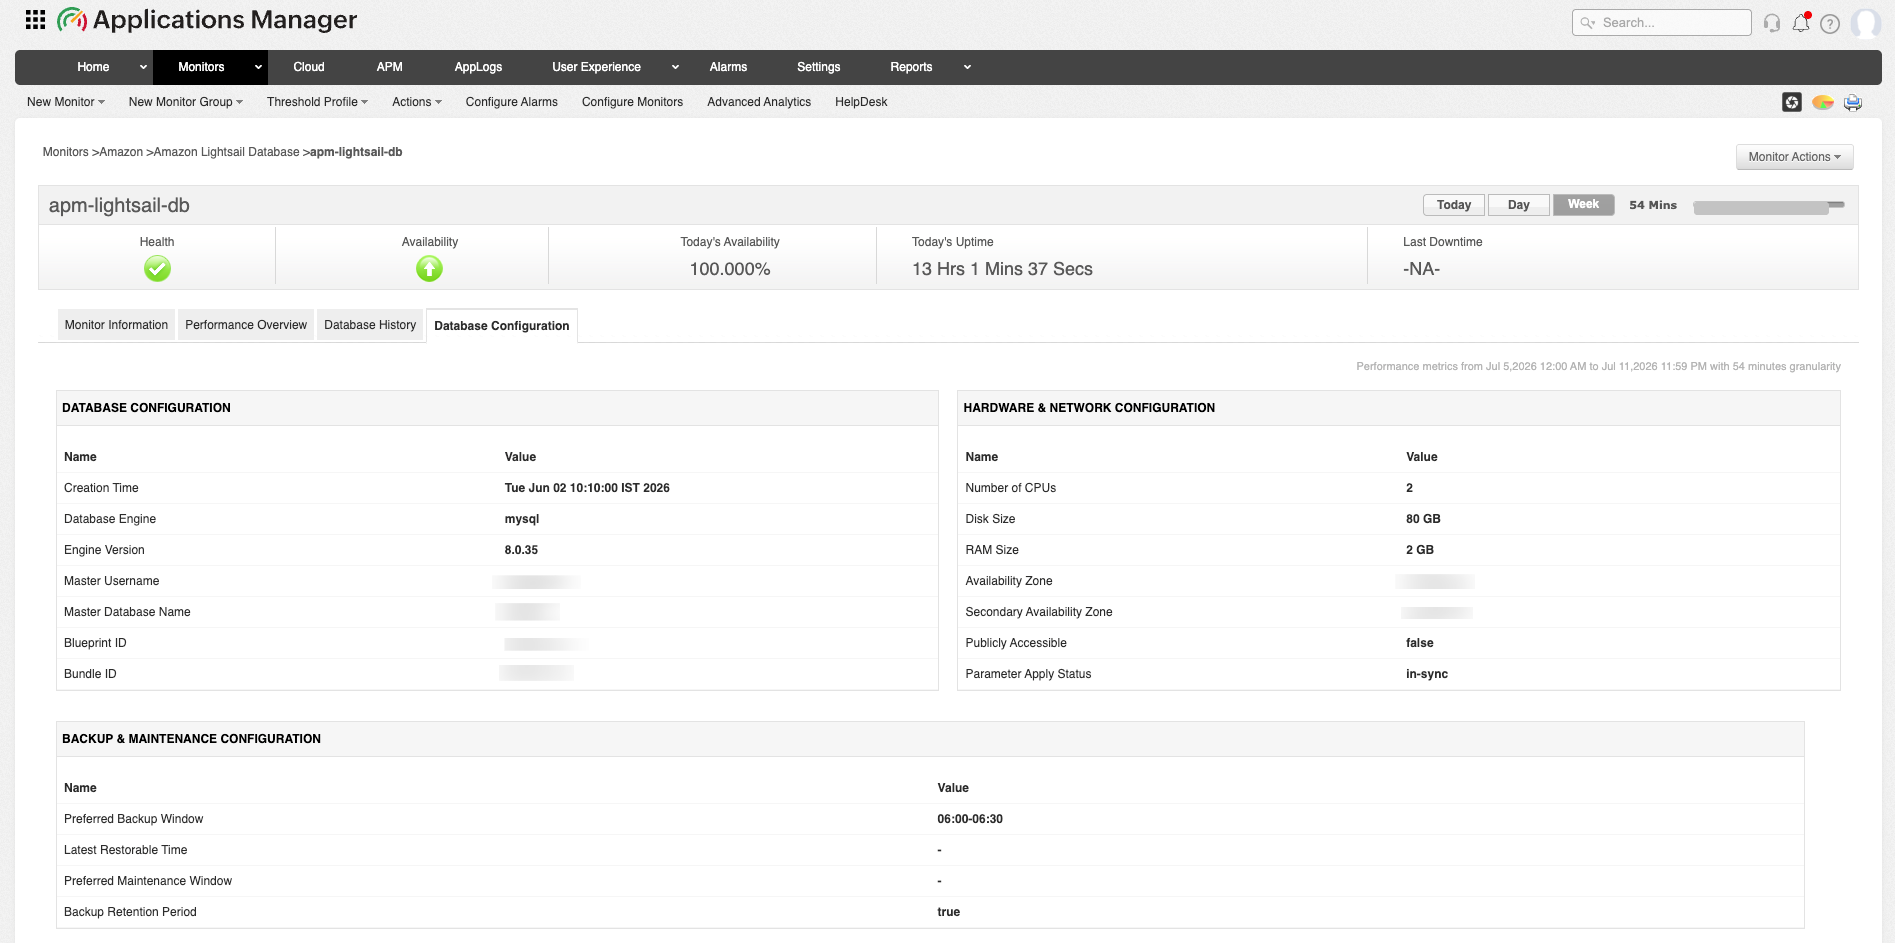
Amazon Lightsail Database Monitoring
Amazon Lightsail Database is a fully managed relational database service that provides pre-configured MySQL and PostgreSQL instances at a predictable monthly price. It simplifies database management by handling hardware provisioning, software patching, backups, and maintenance windows automatically.
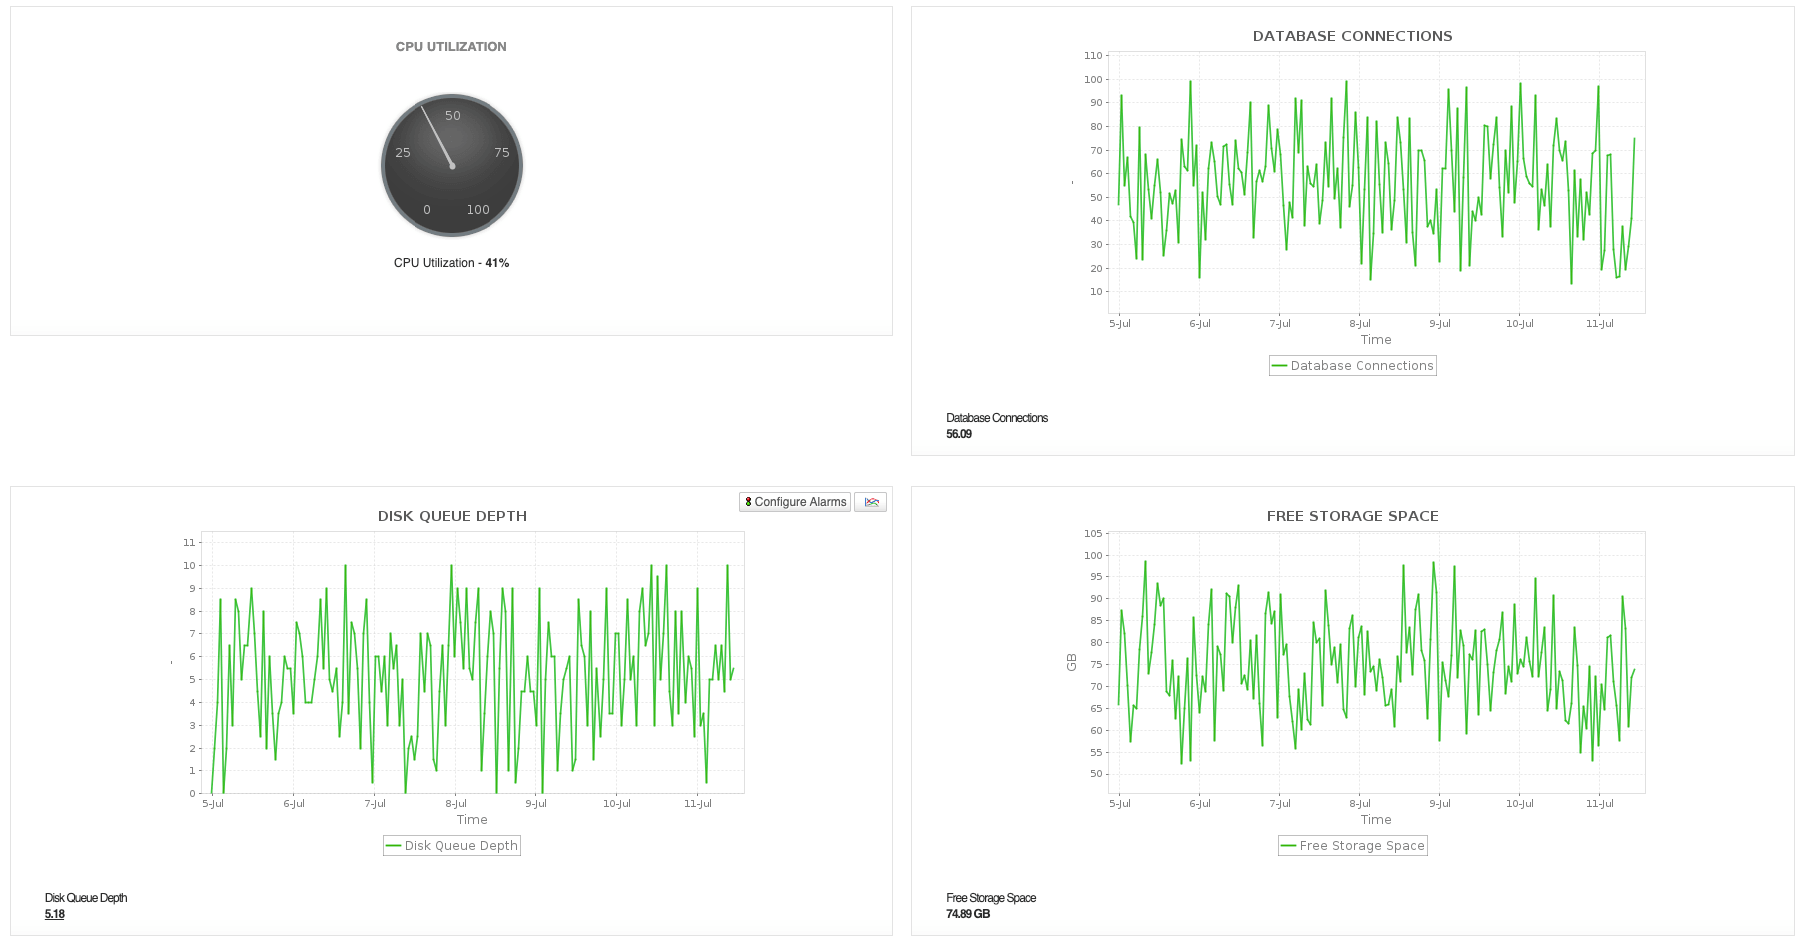
With Applications Manager, you can:
- Monitor CPU utilization to identify instances under heavy load and prevent performance bottlenecks before they impact application responsiveness.
- Track active database connections to detect connection exhaustion and ensure continuous database availability.
- Monitor disk queue depth to identify storage I/O bottlenecks and optimize read/write operations.
- Track free storage space to proactively prevent disk exhaustion and plan capacity before storage limits are reached.
- Gain visibility into network receive and transmit throughput to monitor data transfer rates and detect traffic anomalies in real time.
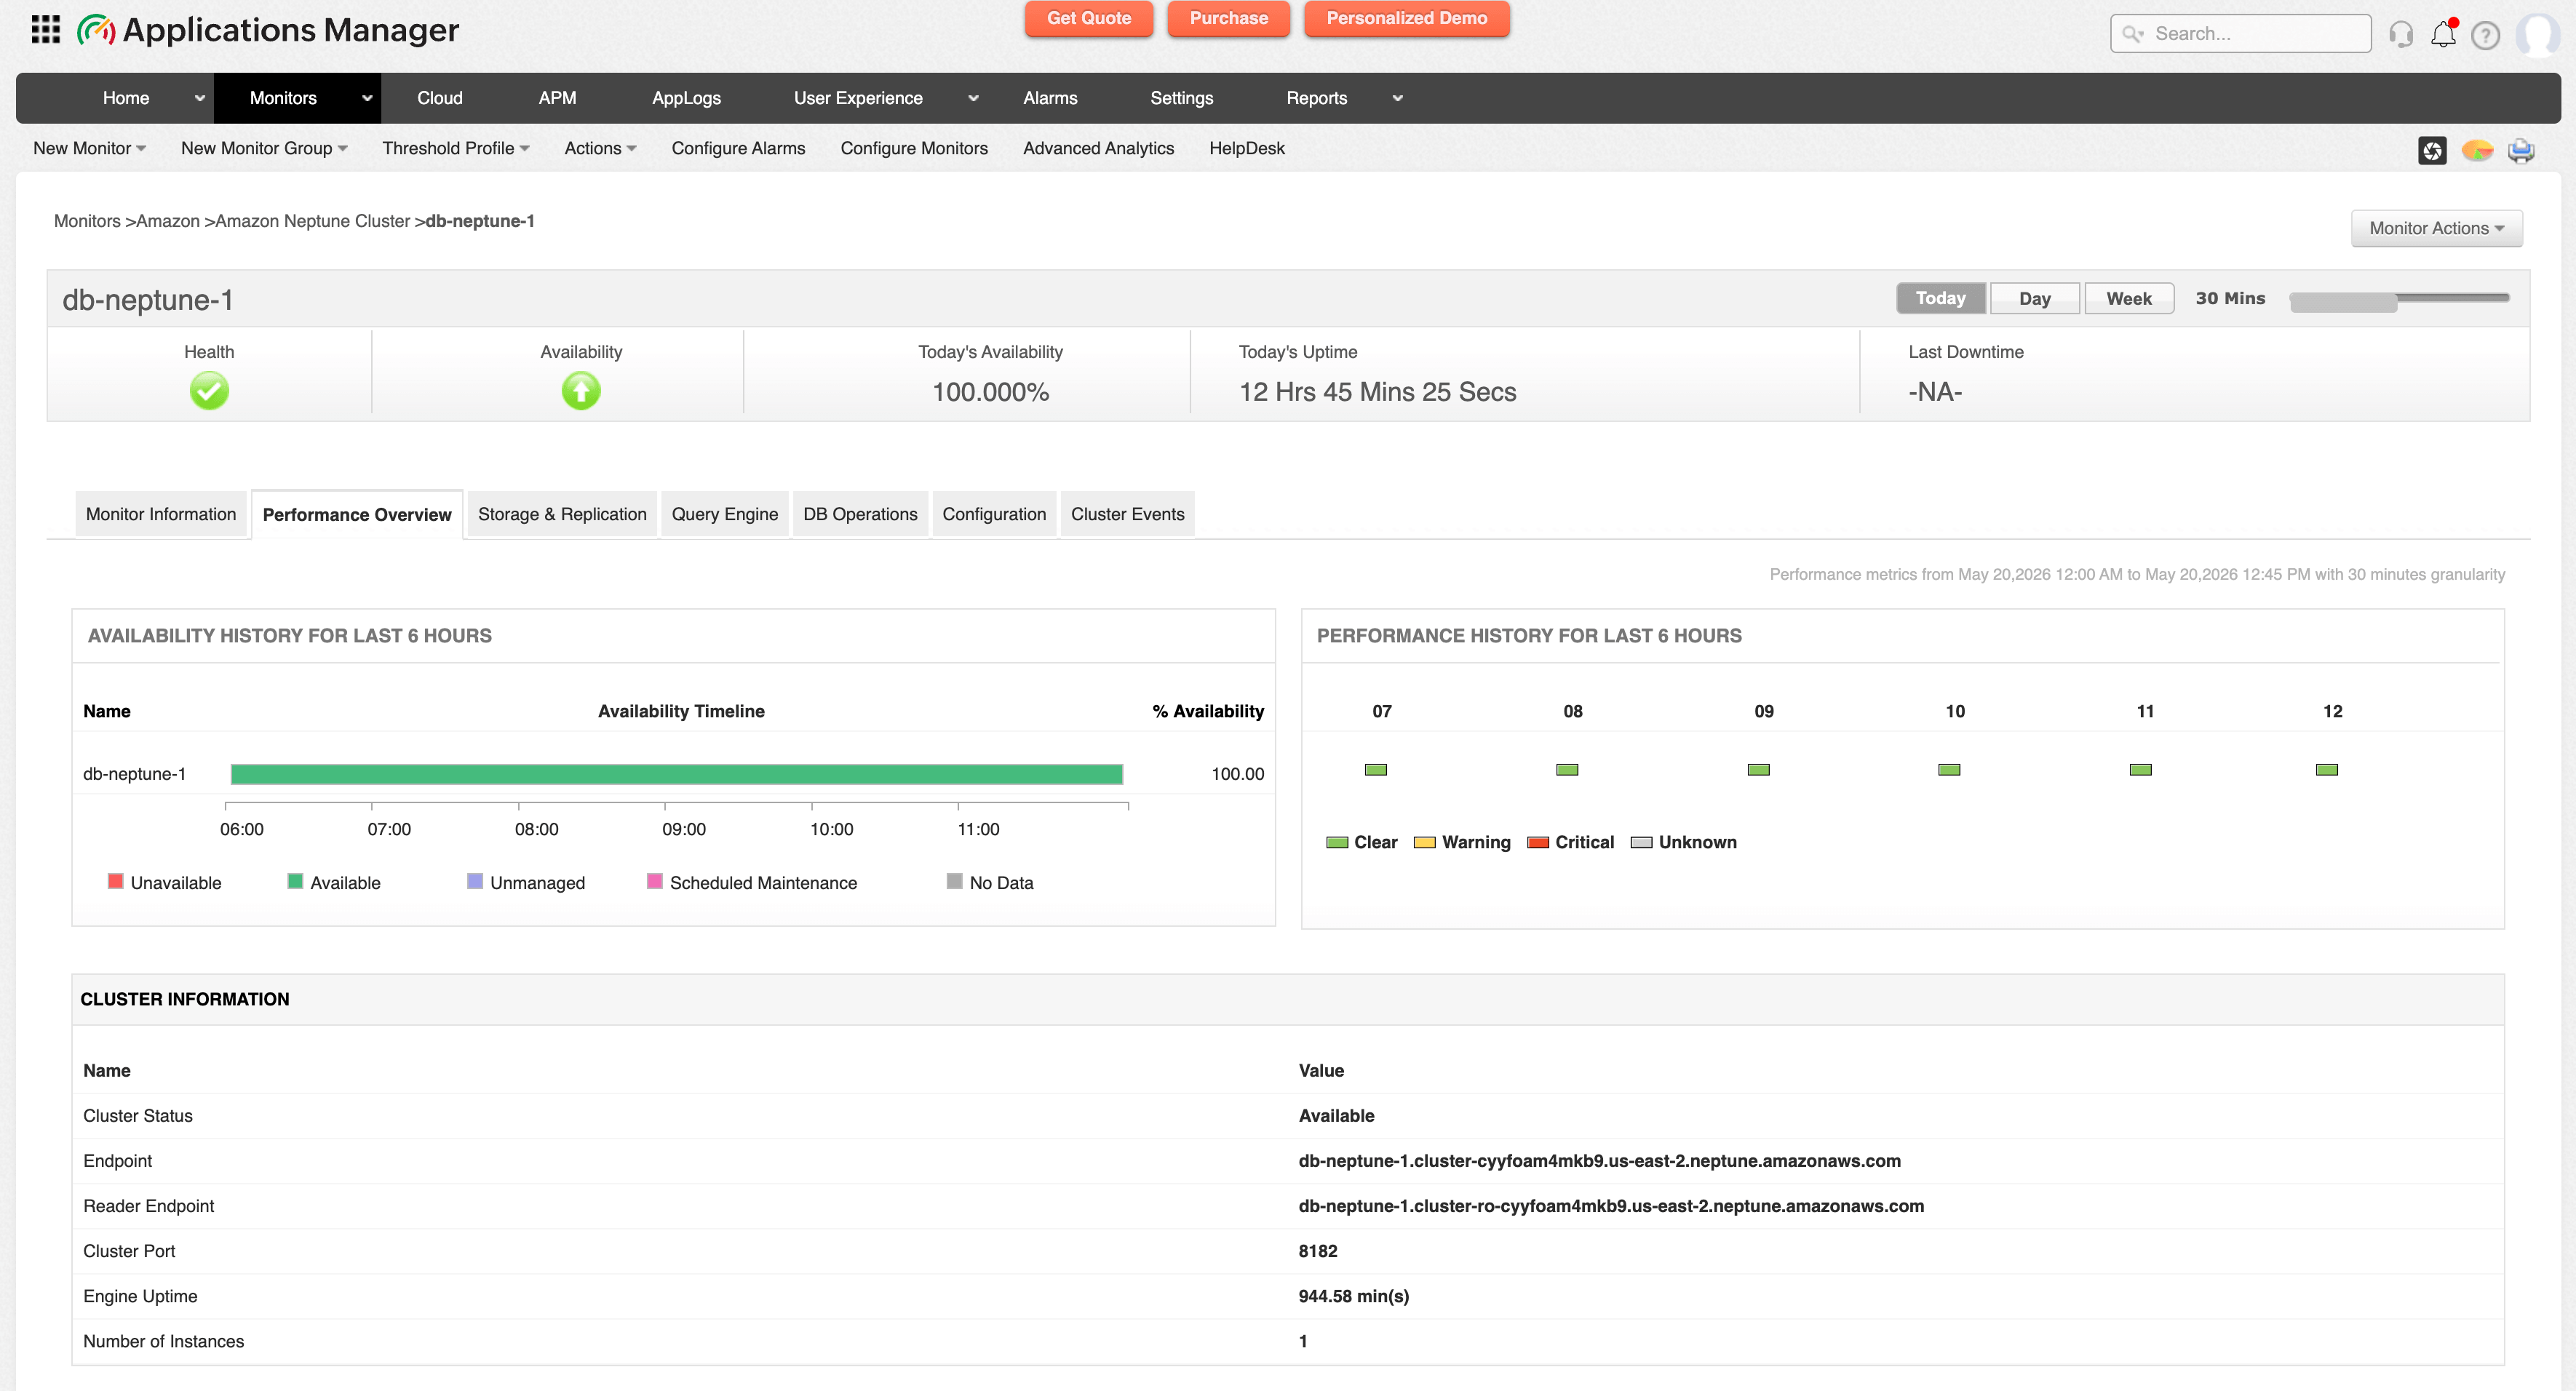
Amazon Neptune Cluster Monitoring
Amazon Neptune Cluster is a fully managed graph database service optimized for highly connected datasets and graph workloads such as recommendation engines, fraud detection, and knowledge graphs.
With Applications Manager, you can:
- Maintain graph database performance by monitoring cluster health and identifying workload bottlenecks affecting query execution.
- Ensure high availability by tracking cluster operational status and detecting replication or failover issues.
- Optimize resource consumption through continuous monitoring of CPU, memory, storage, and throughput metrics.
- Improve scalability planning by analyzing usage trends and workload growth patterns.
- Reduce performance disruptions by receiving alerts on abnormal cluster activity.
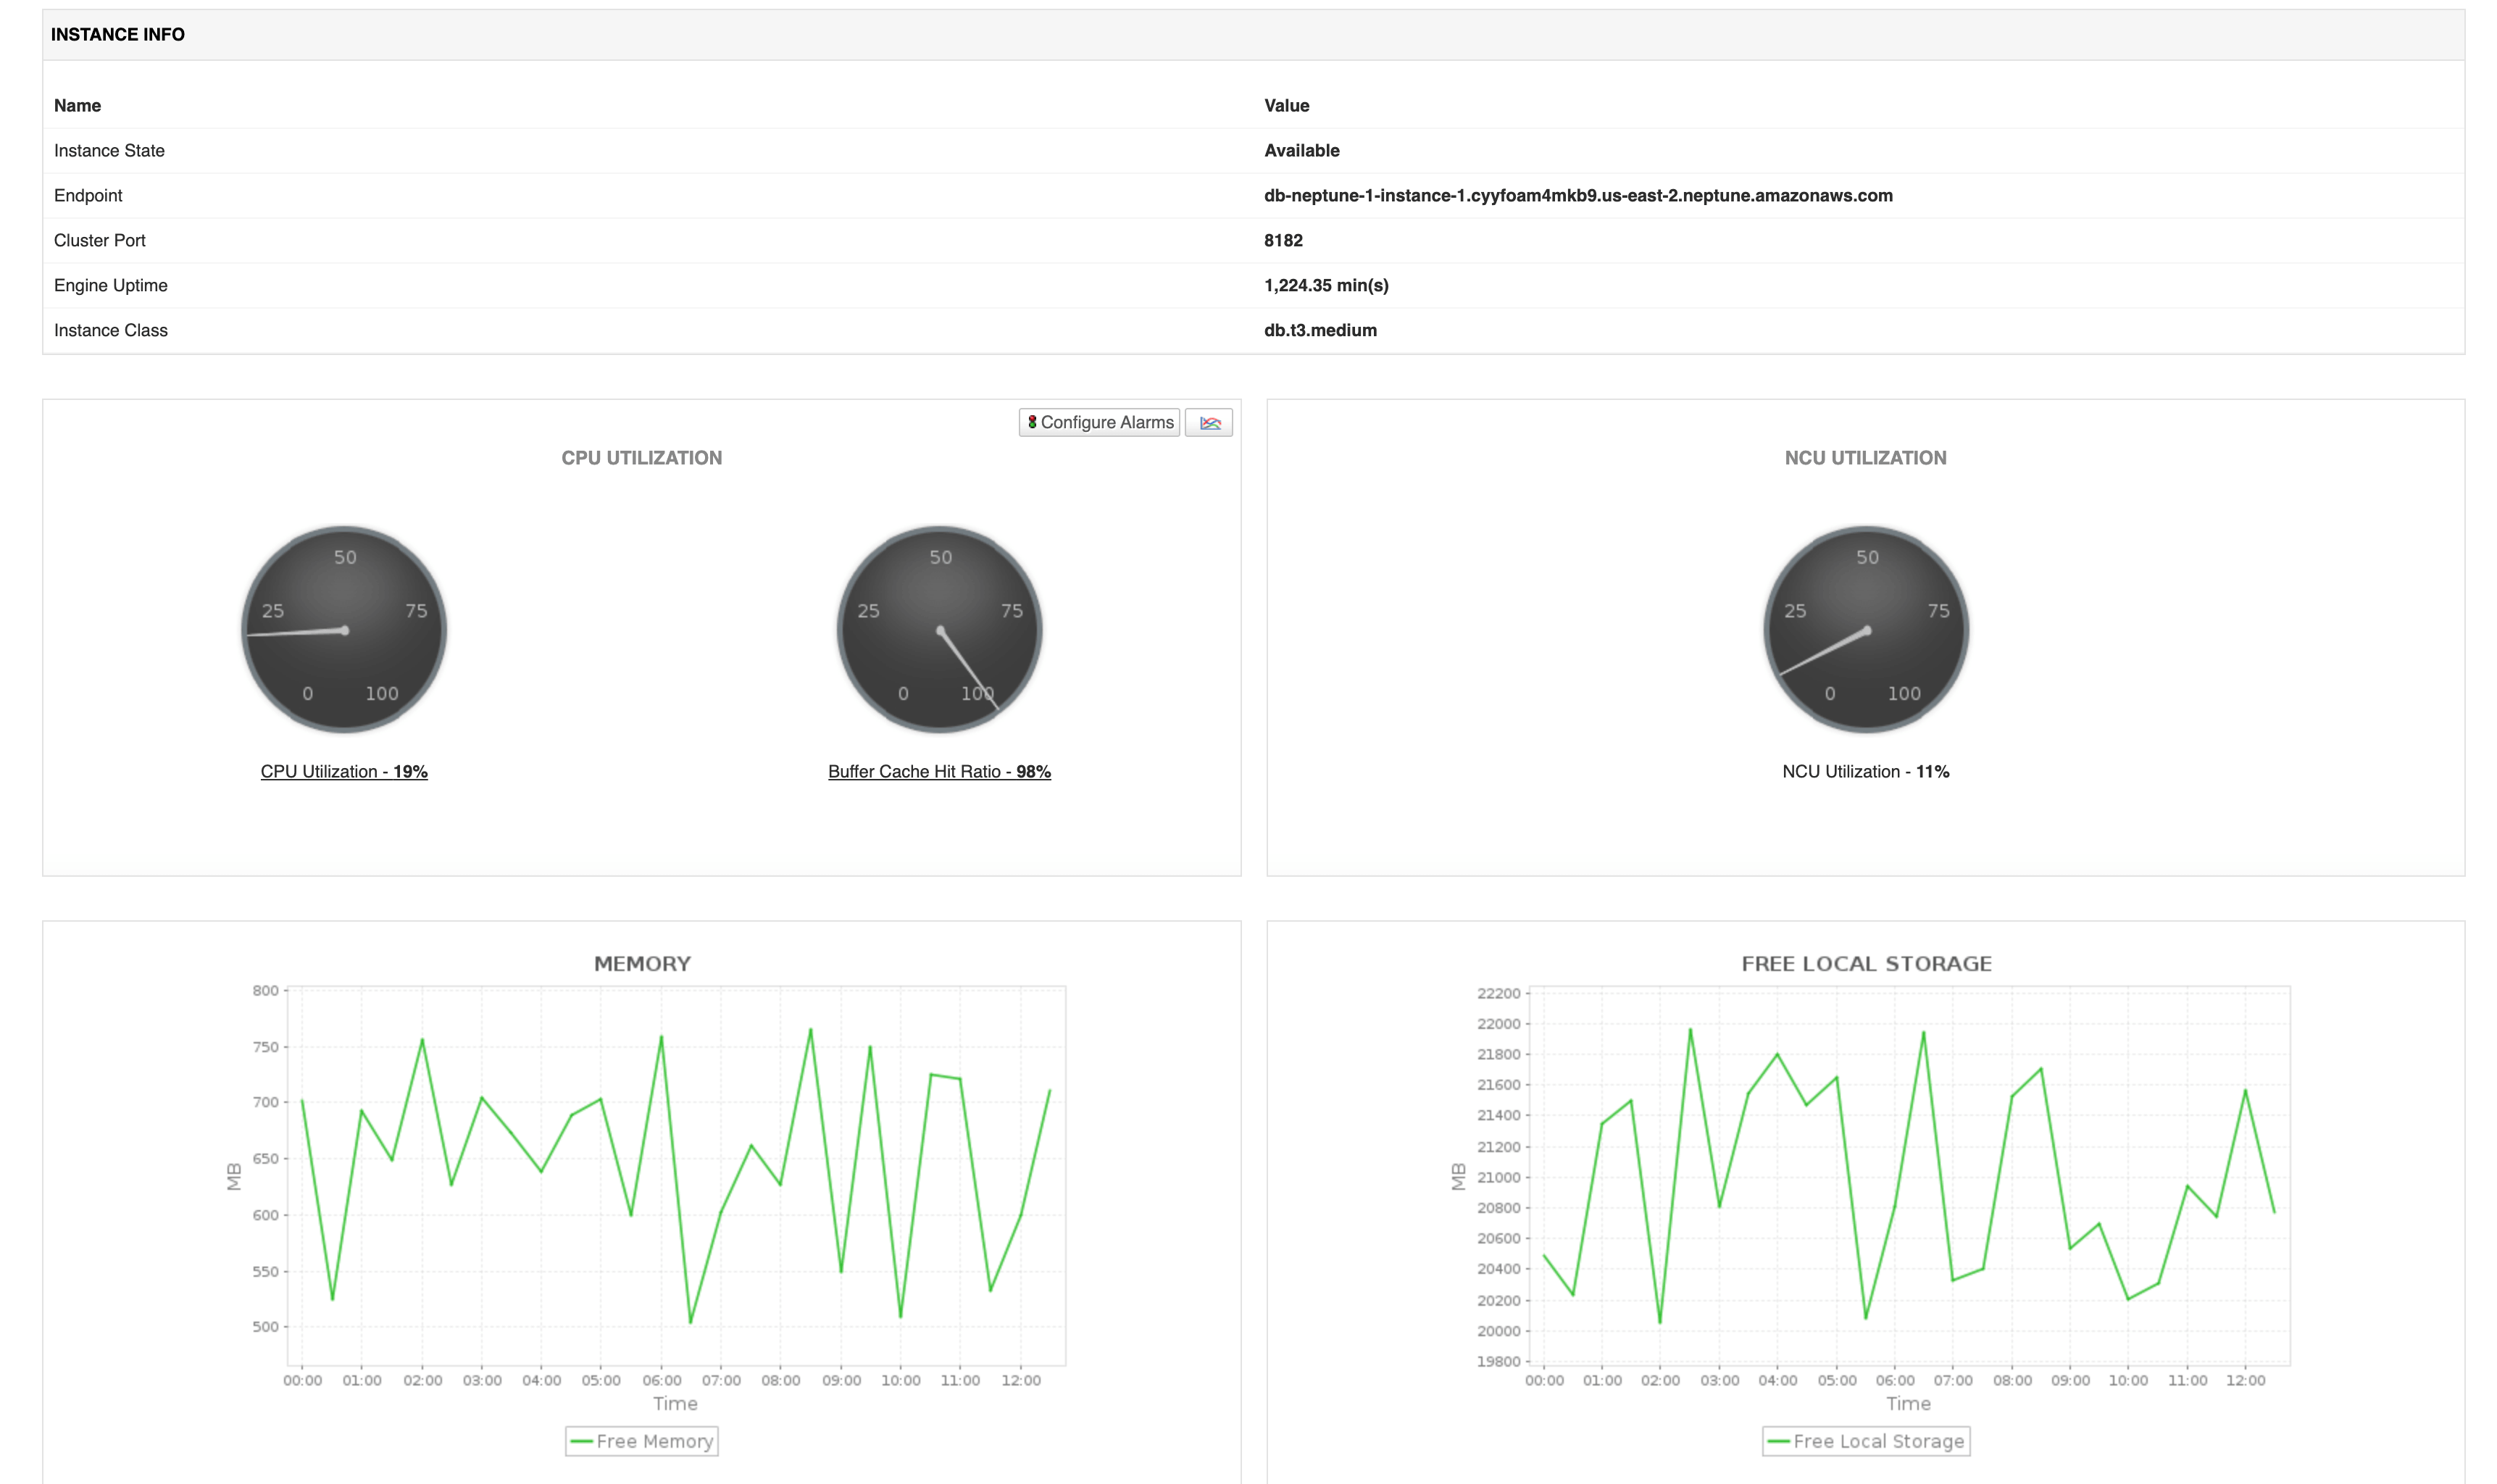
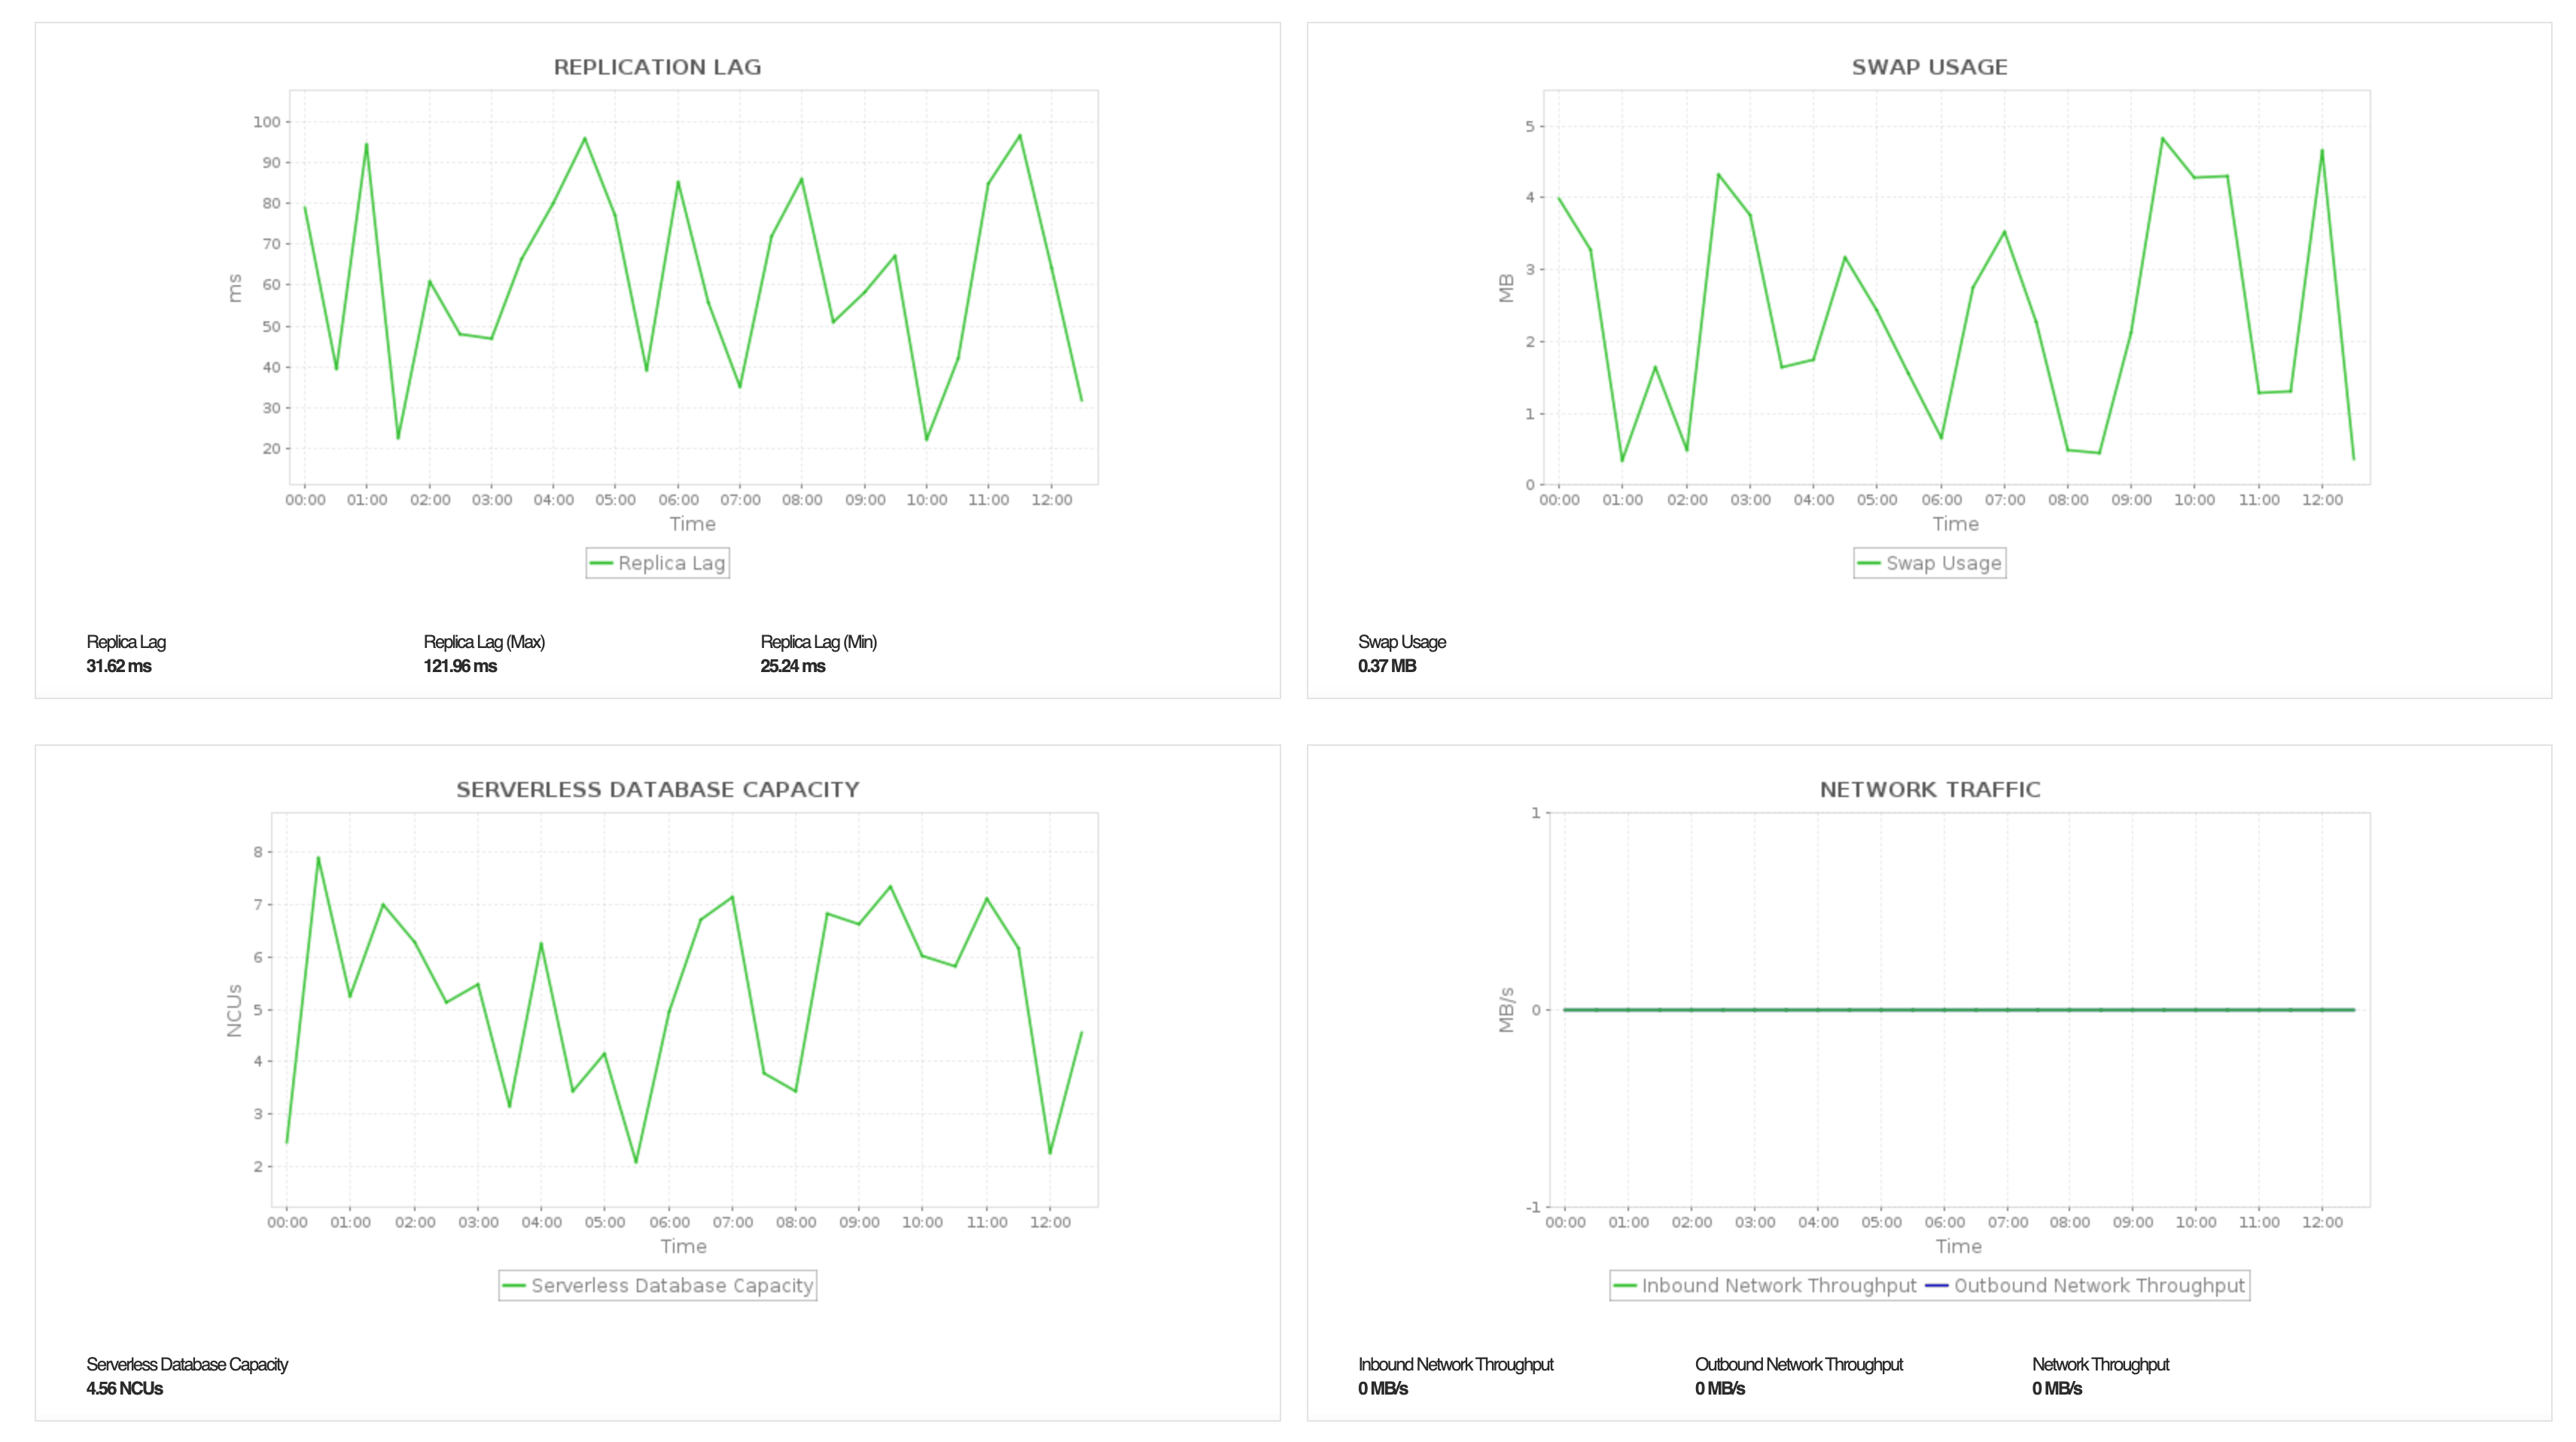
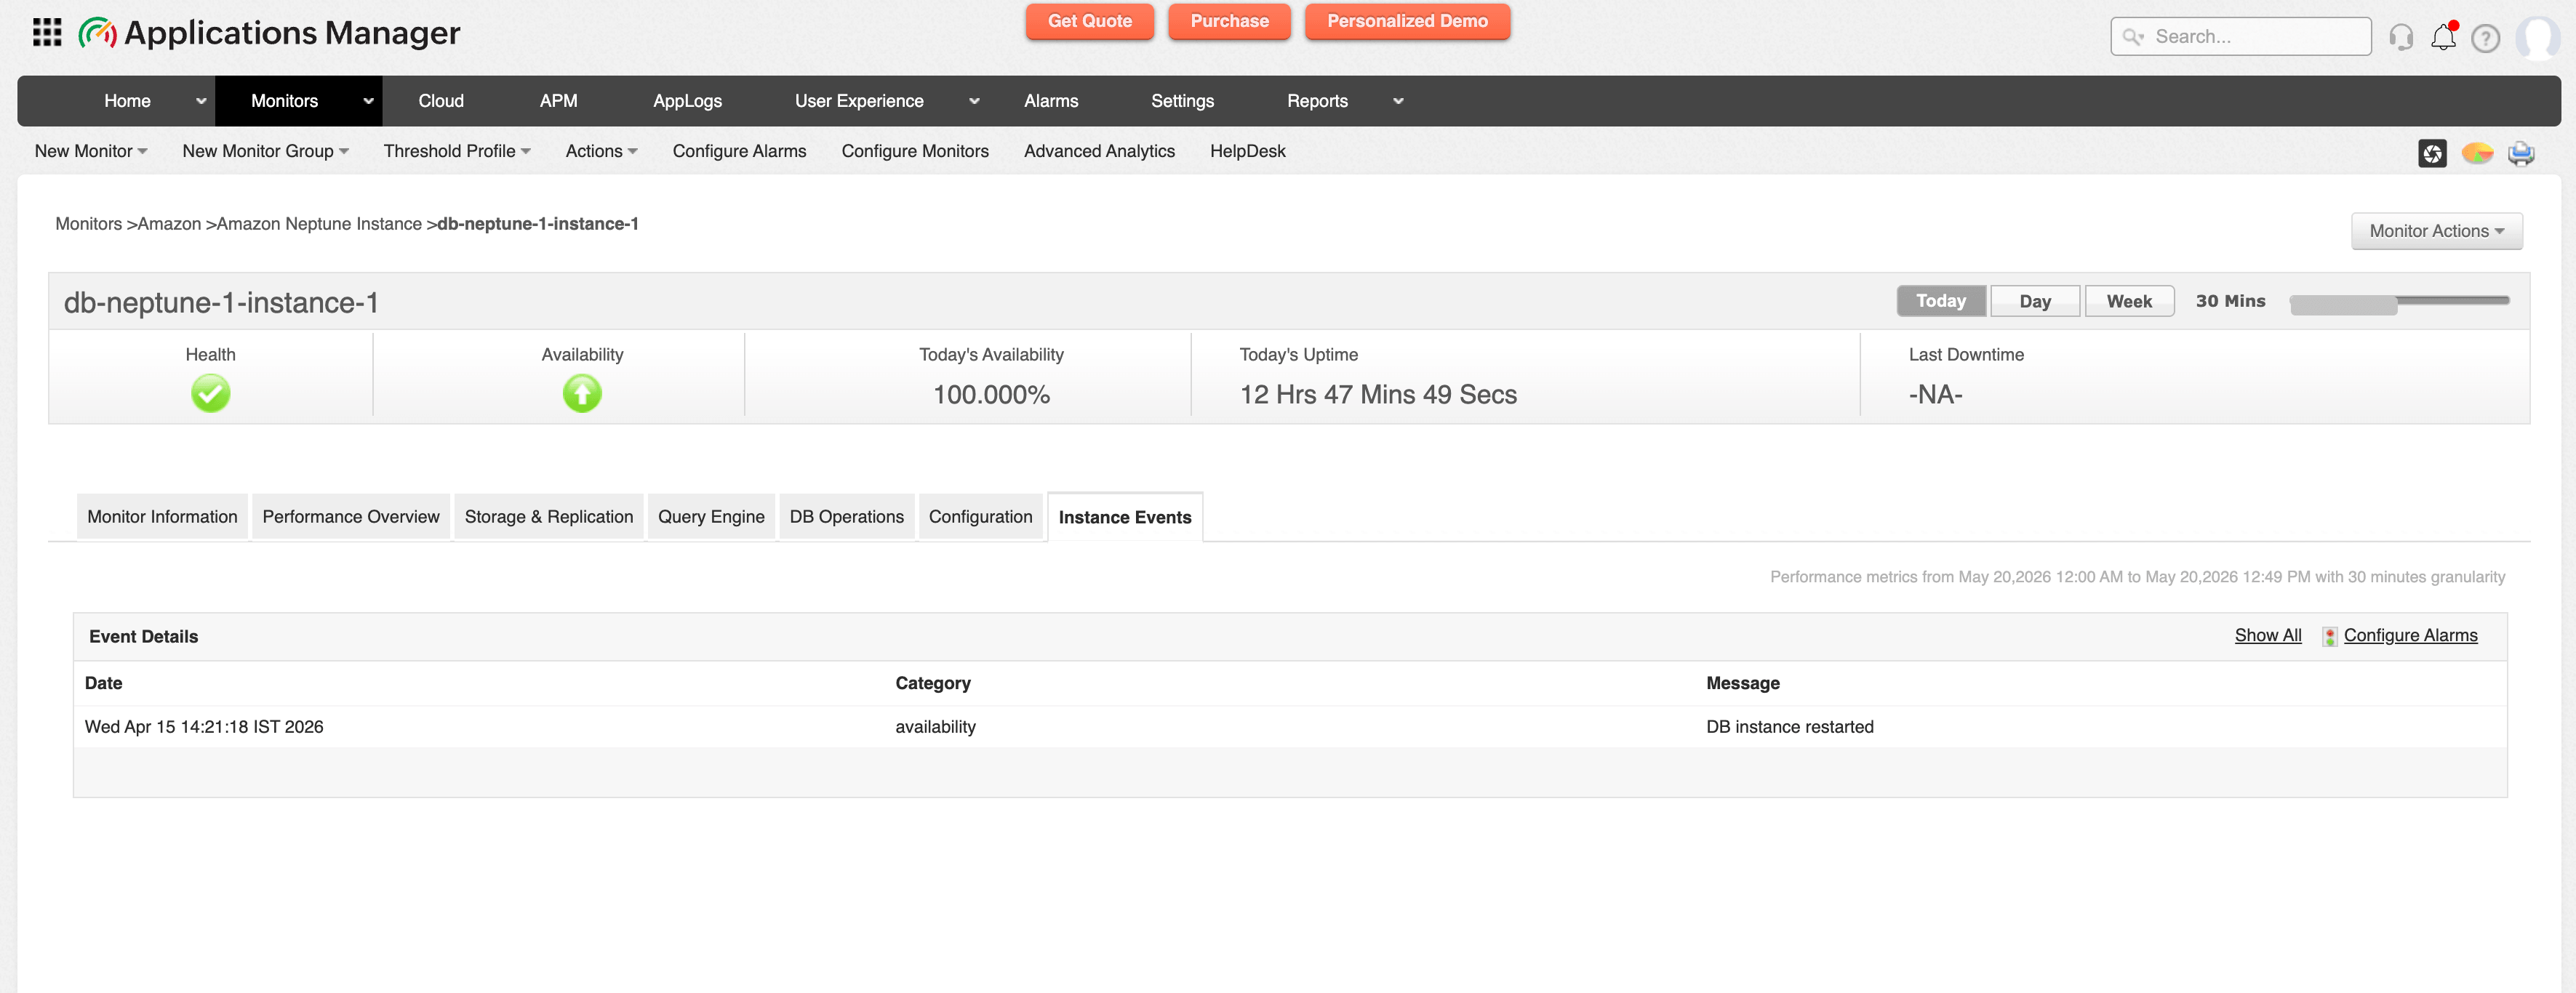
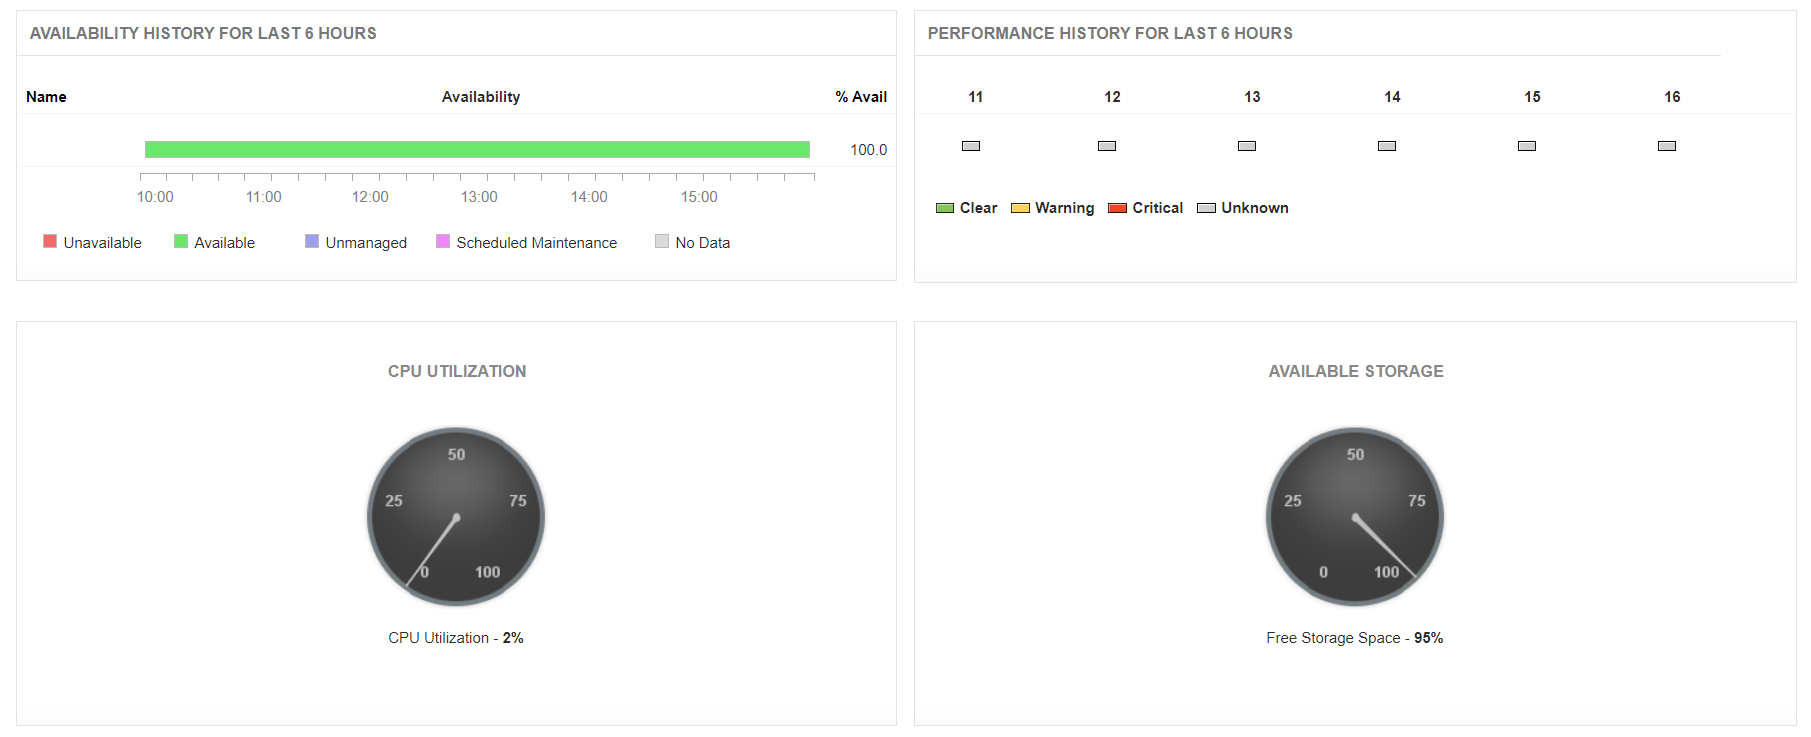
Amazon Neptune Instance Monitoring
Amazon Neptune Instances are compute resources within Neptune clusters that process graph queries and database operations.
With Applications Manager, you can:
- Monitor instance performance continuously by tracking CPU, memory, storage, and query workload utilization.
- Prevent performance bottlenecks by identifying resource constraints affecting graph database responsiveness.
- Improve operational reliability through proactive monitoring of instance health and availability.
- Optimize workload distribution by analyzing instance-level performance trends.
- Minimize downtime risks with alerts on abnormal instance behavior or performance degradation.
Amazon RDS Monitoring
Amazon Relational Database Service (RDS) is a web service that makes it easy to set up, operate, and scale a relational database in the cloud. It provides cost-efficient and resizable capacity while automating time-consuming administration tasks such as hardware provisioning, database setup, patching, and backups.
With Applications Manager, you can:
- Monitor the availability and health status of RDS instances and troubleshoot problems through the Root Cause Analysis (RCA) window.
- Track CPU utilization and storage space to ensure optimal resource allocation and prevent performance degradation.
- Monitor database connections, network traffic, and read/write latency to identify connectivity and throughput bottlenecks.
- Analyze disk I/O operations to ensure storage volumes keep pace with read and write requests.
- Generate comprehensive reports for performance analysis and capacity planning of your RDS infrastructure.
Learn more about Amazon RDS monitoring.
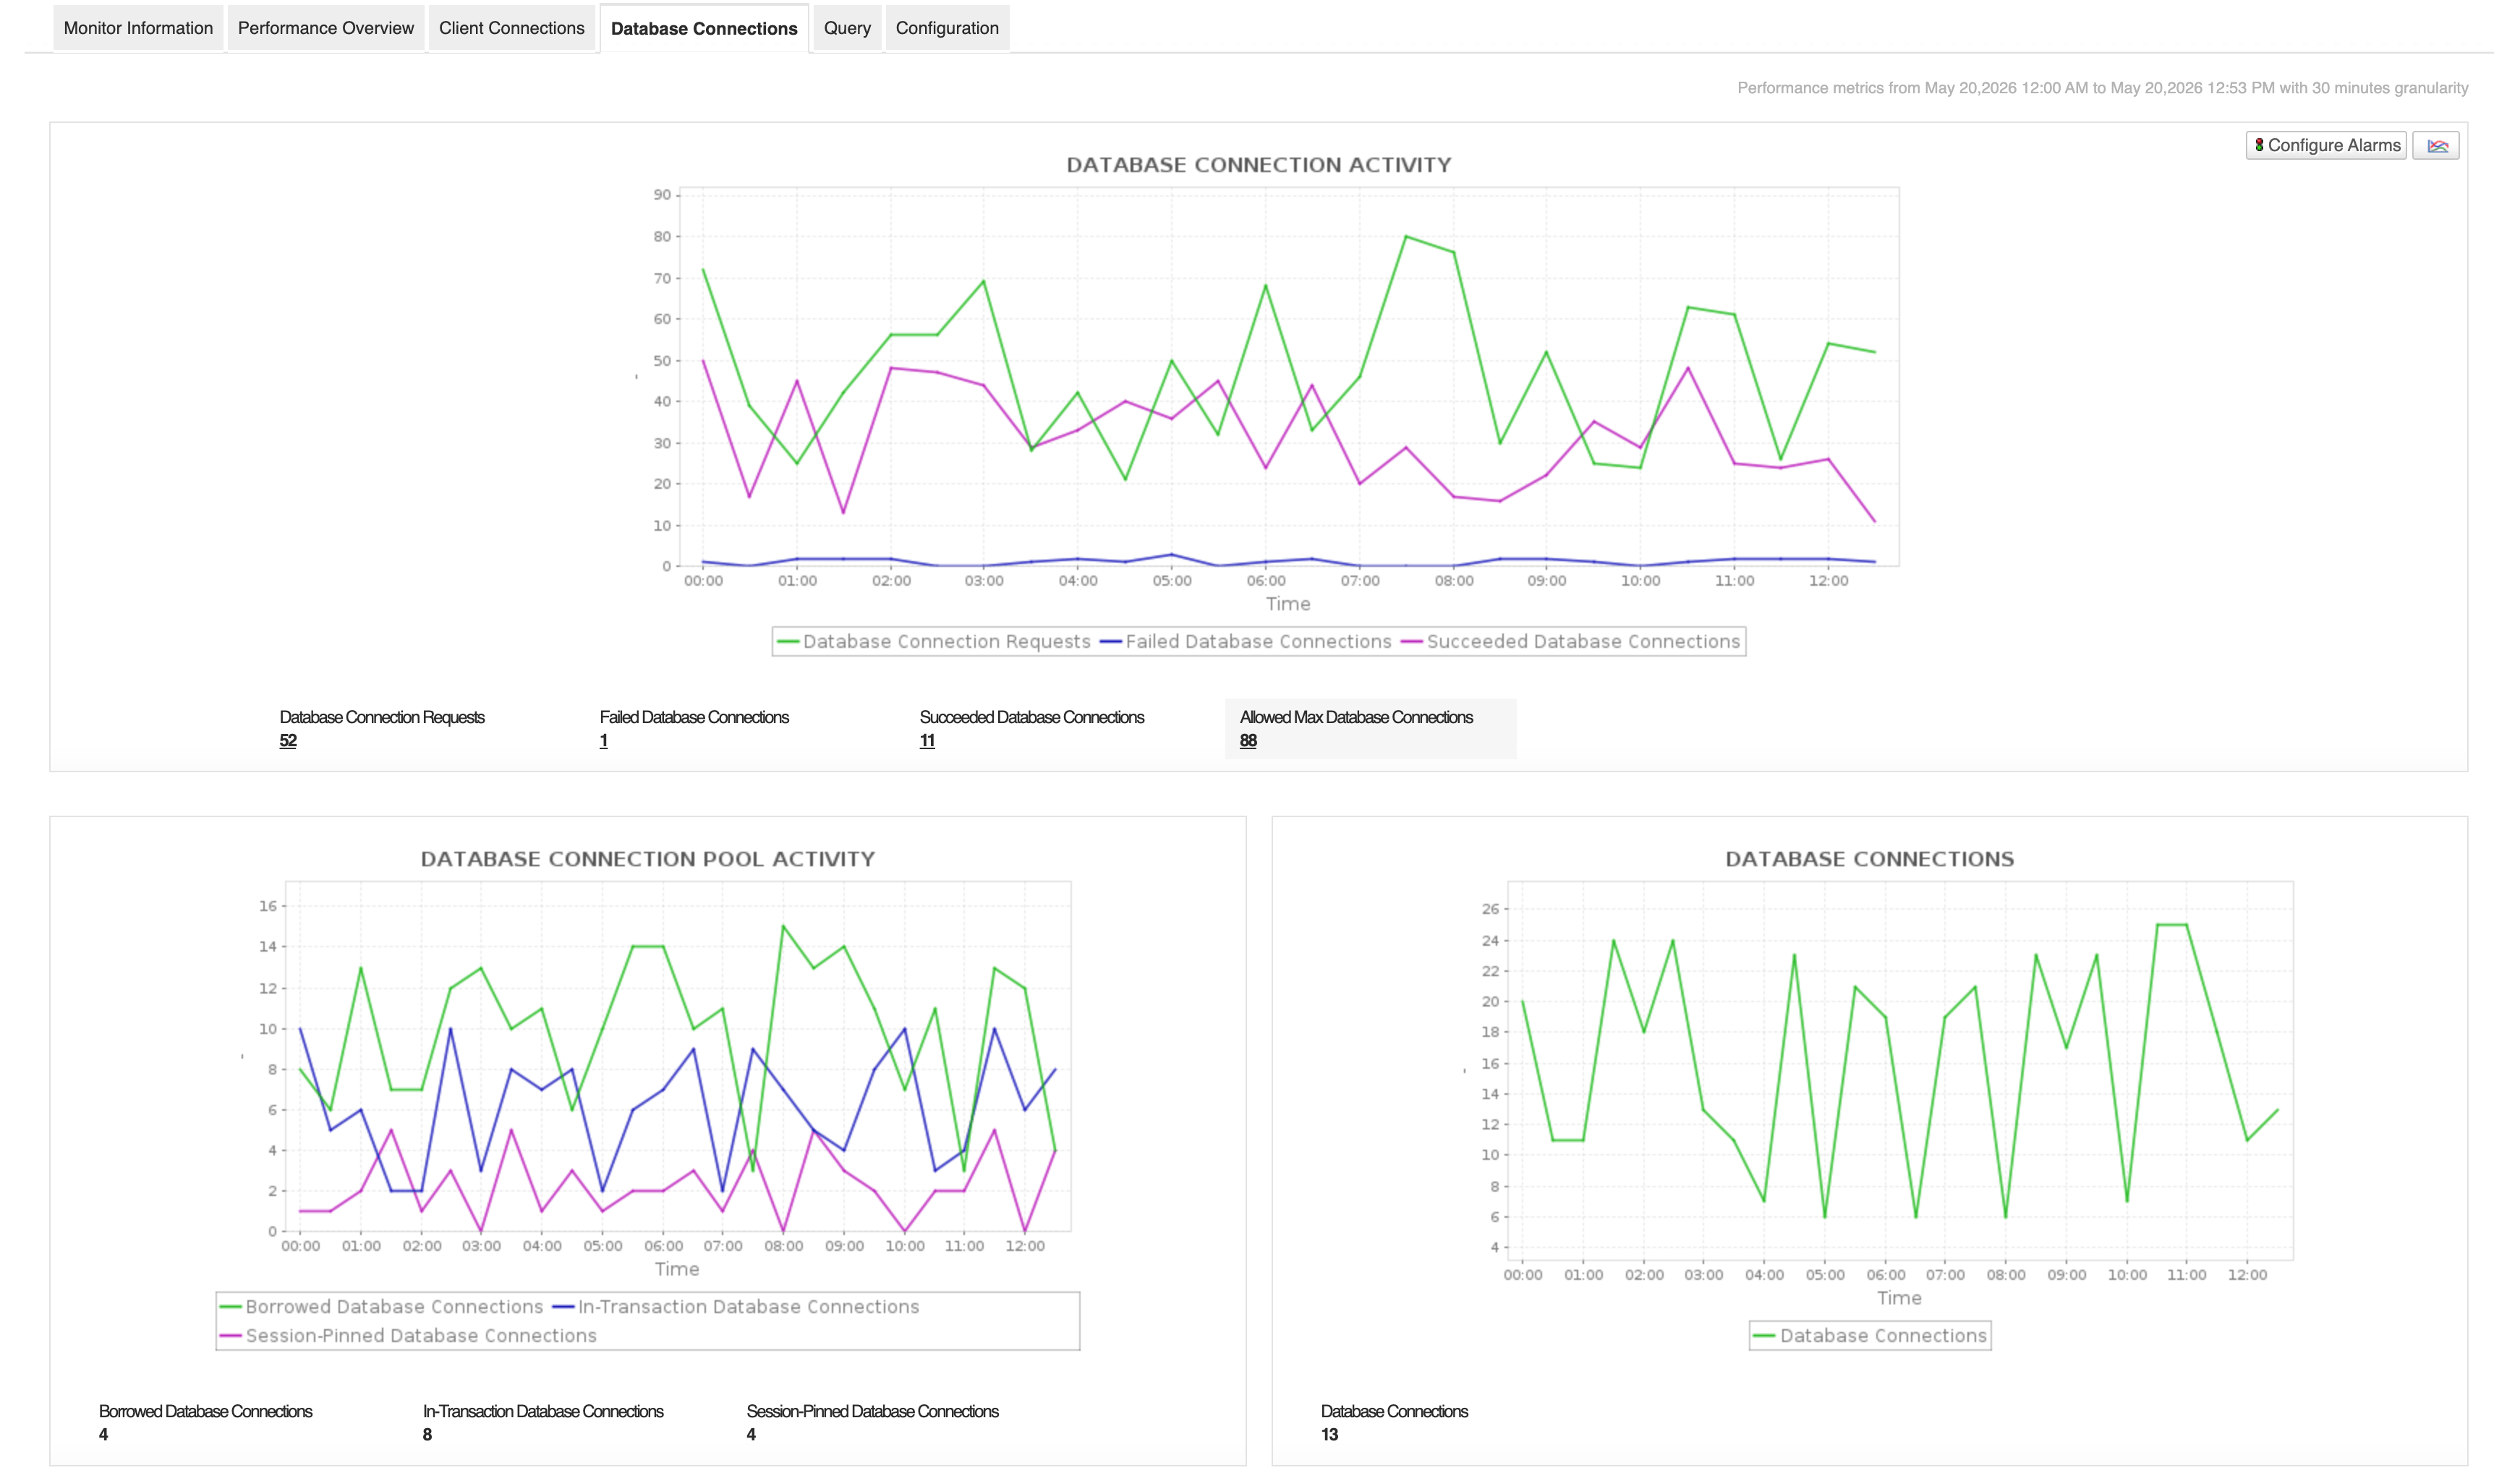
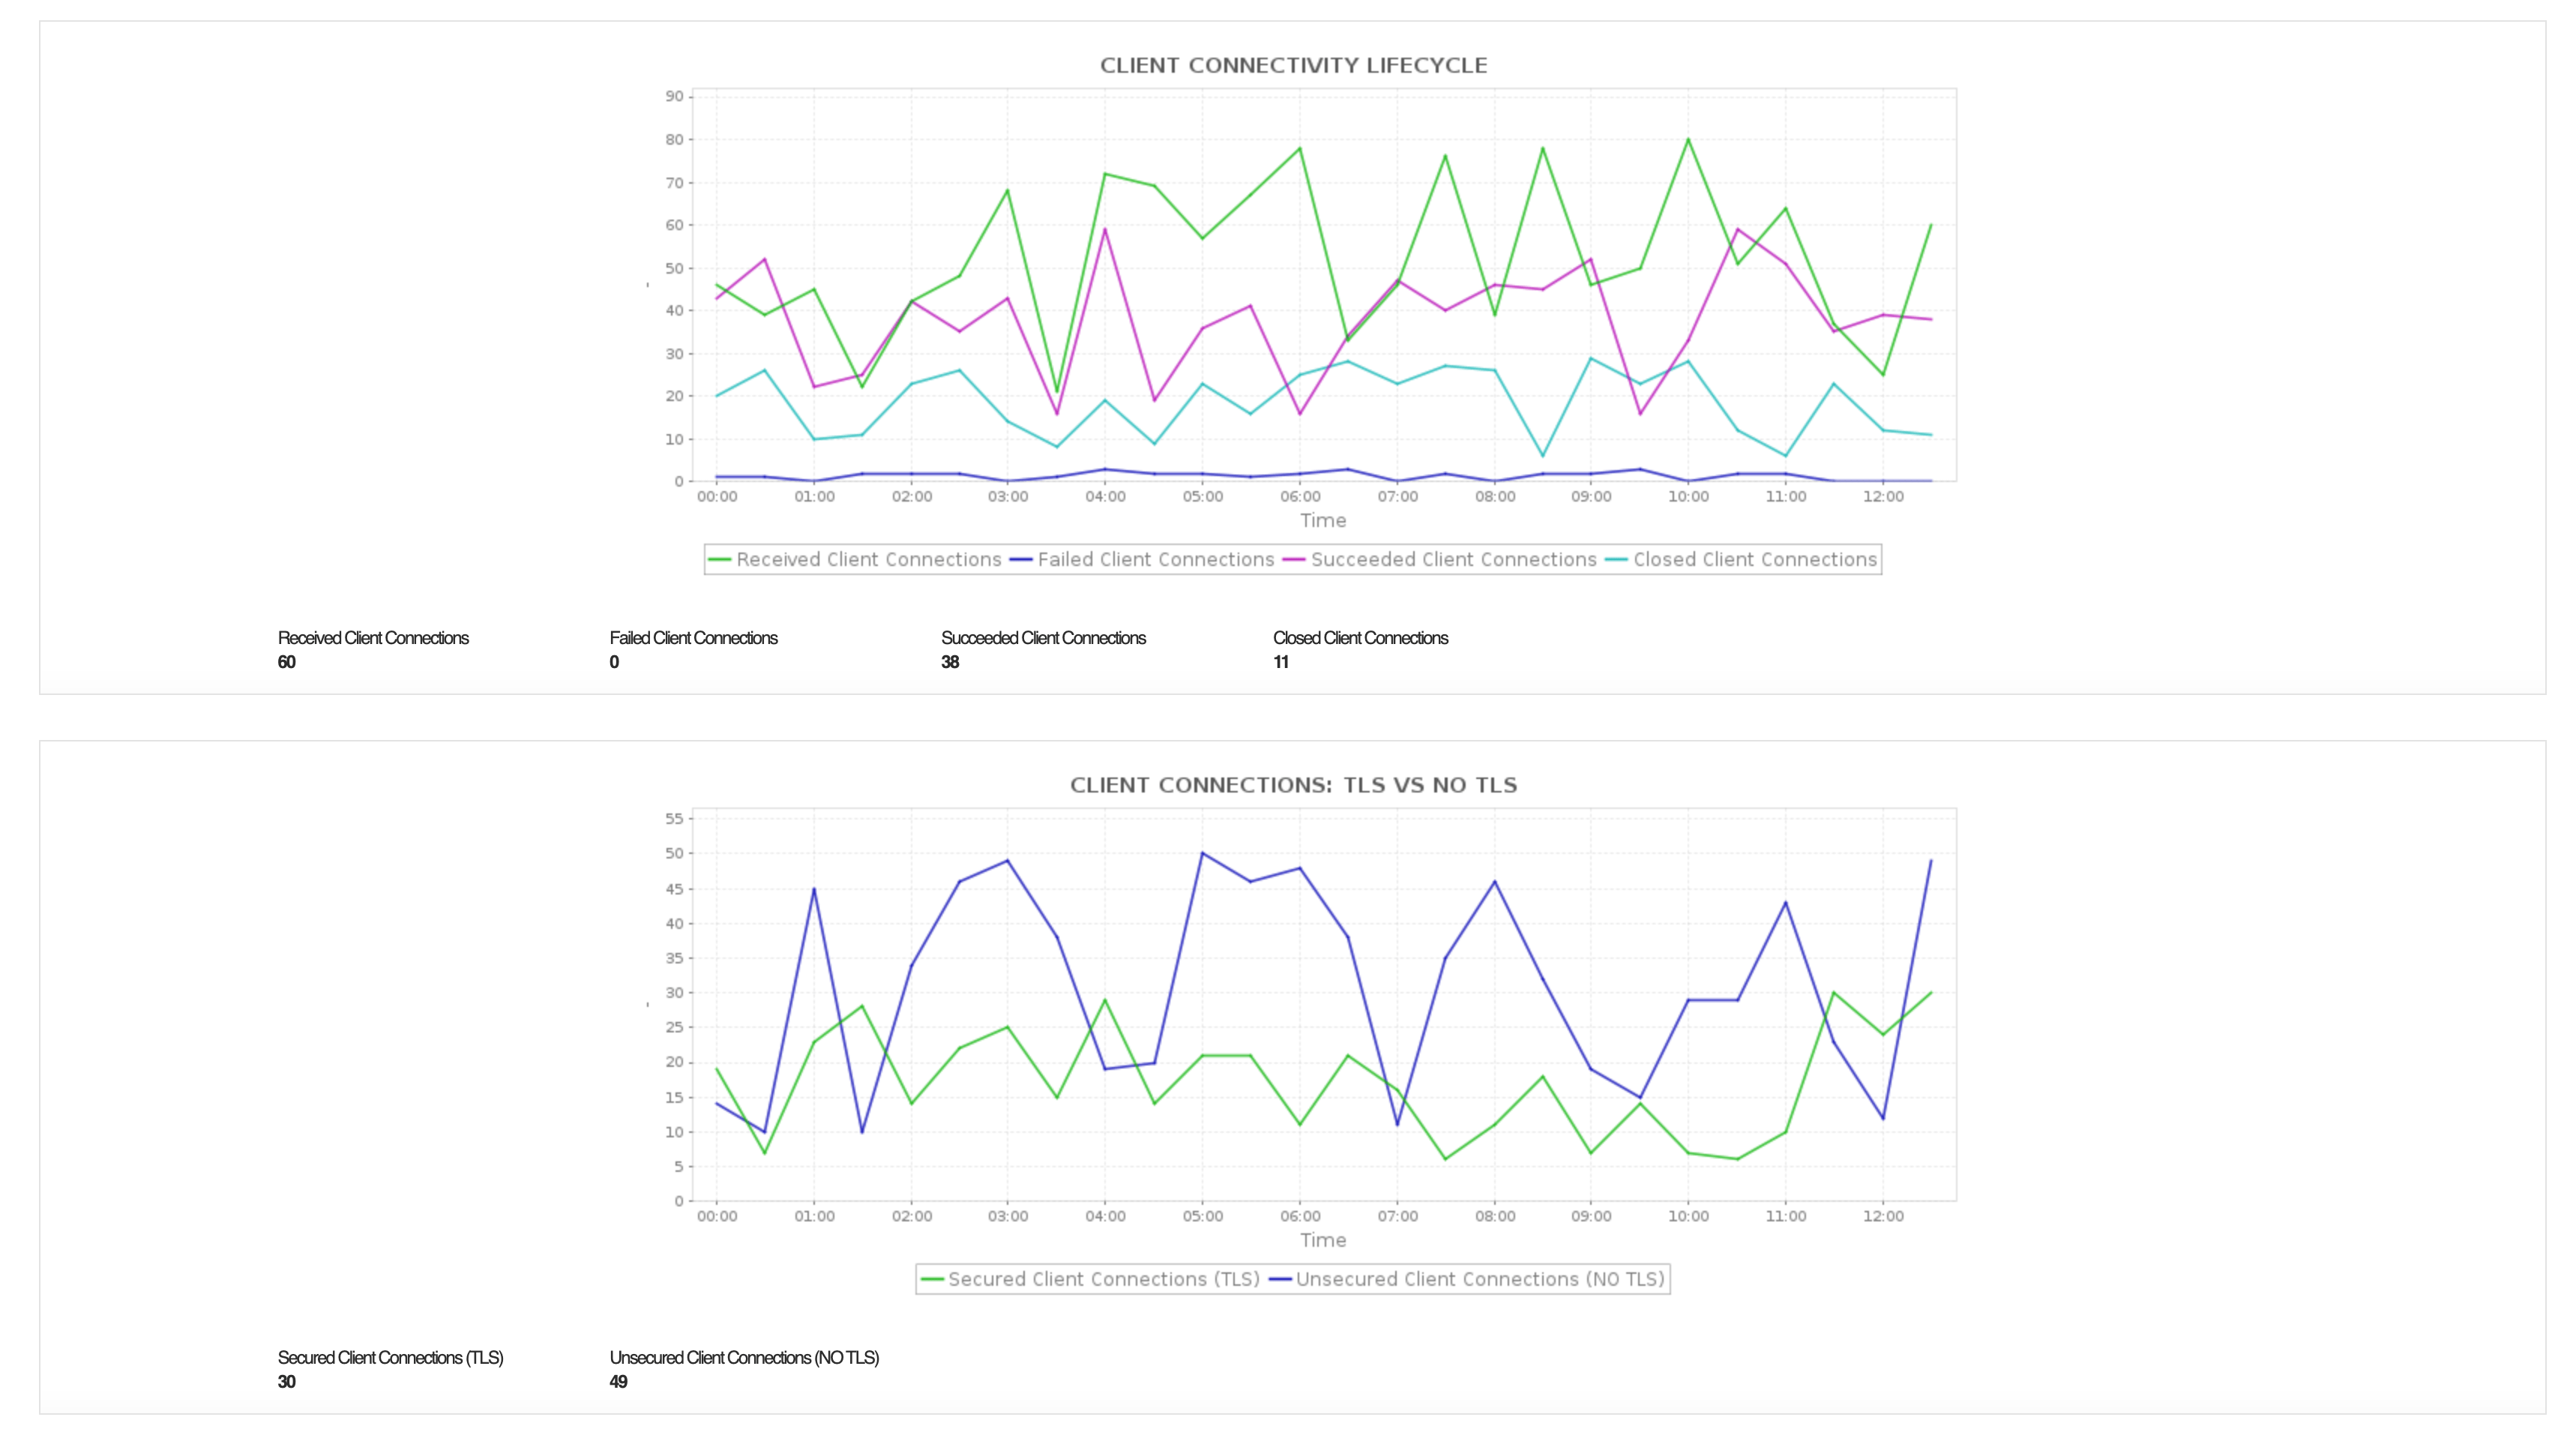
Amazon RDS Proxy Monitoring
Amazon RDS Proxy is a fully managed database proxy service that improves application scalability, resiliency, and security by managing database connections efficiently.
With Applications Manager, you can:
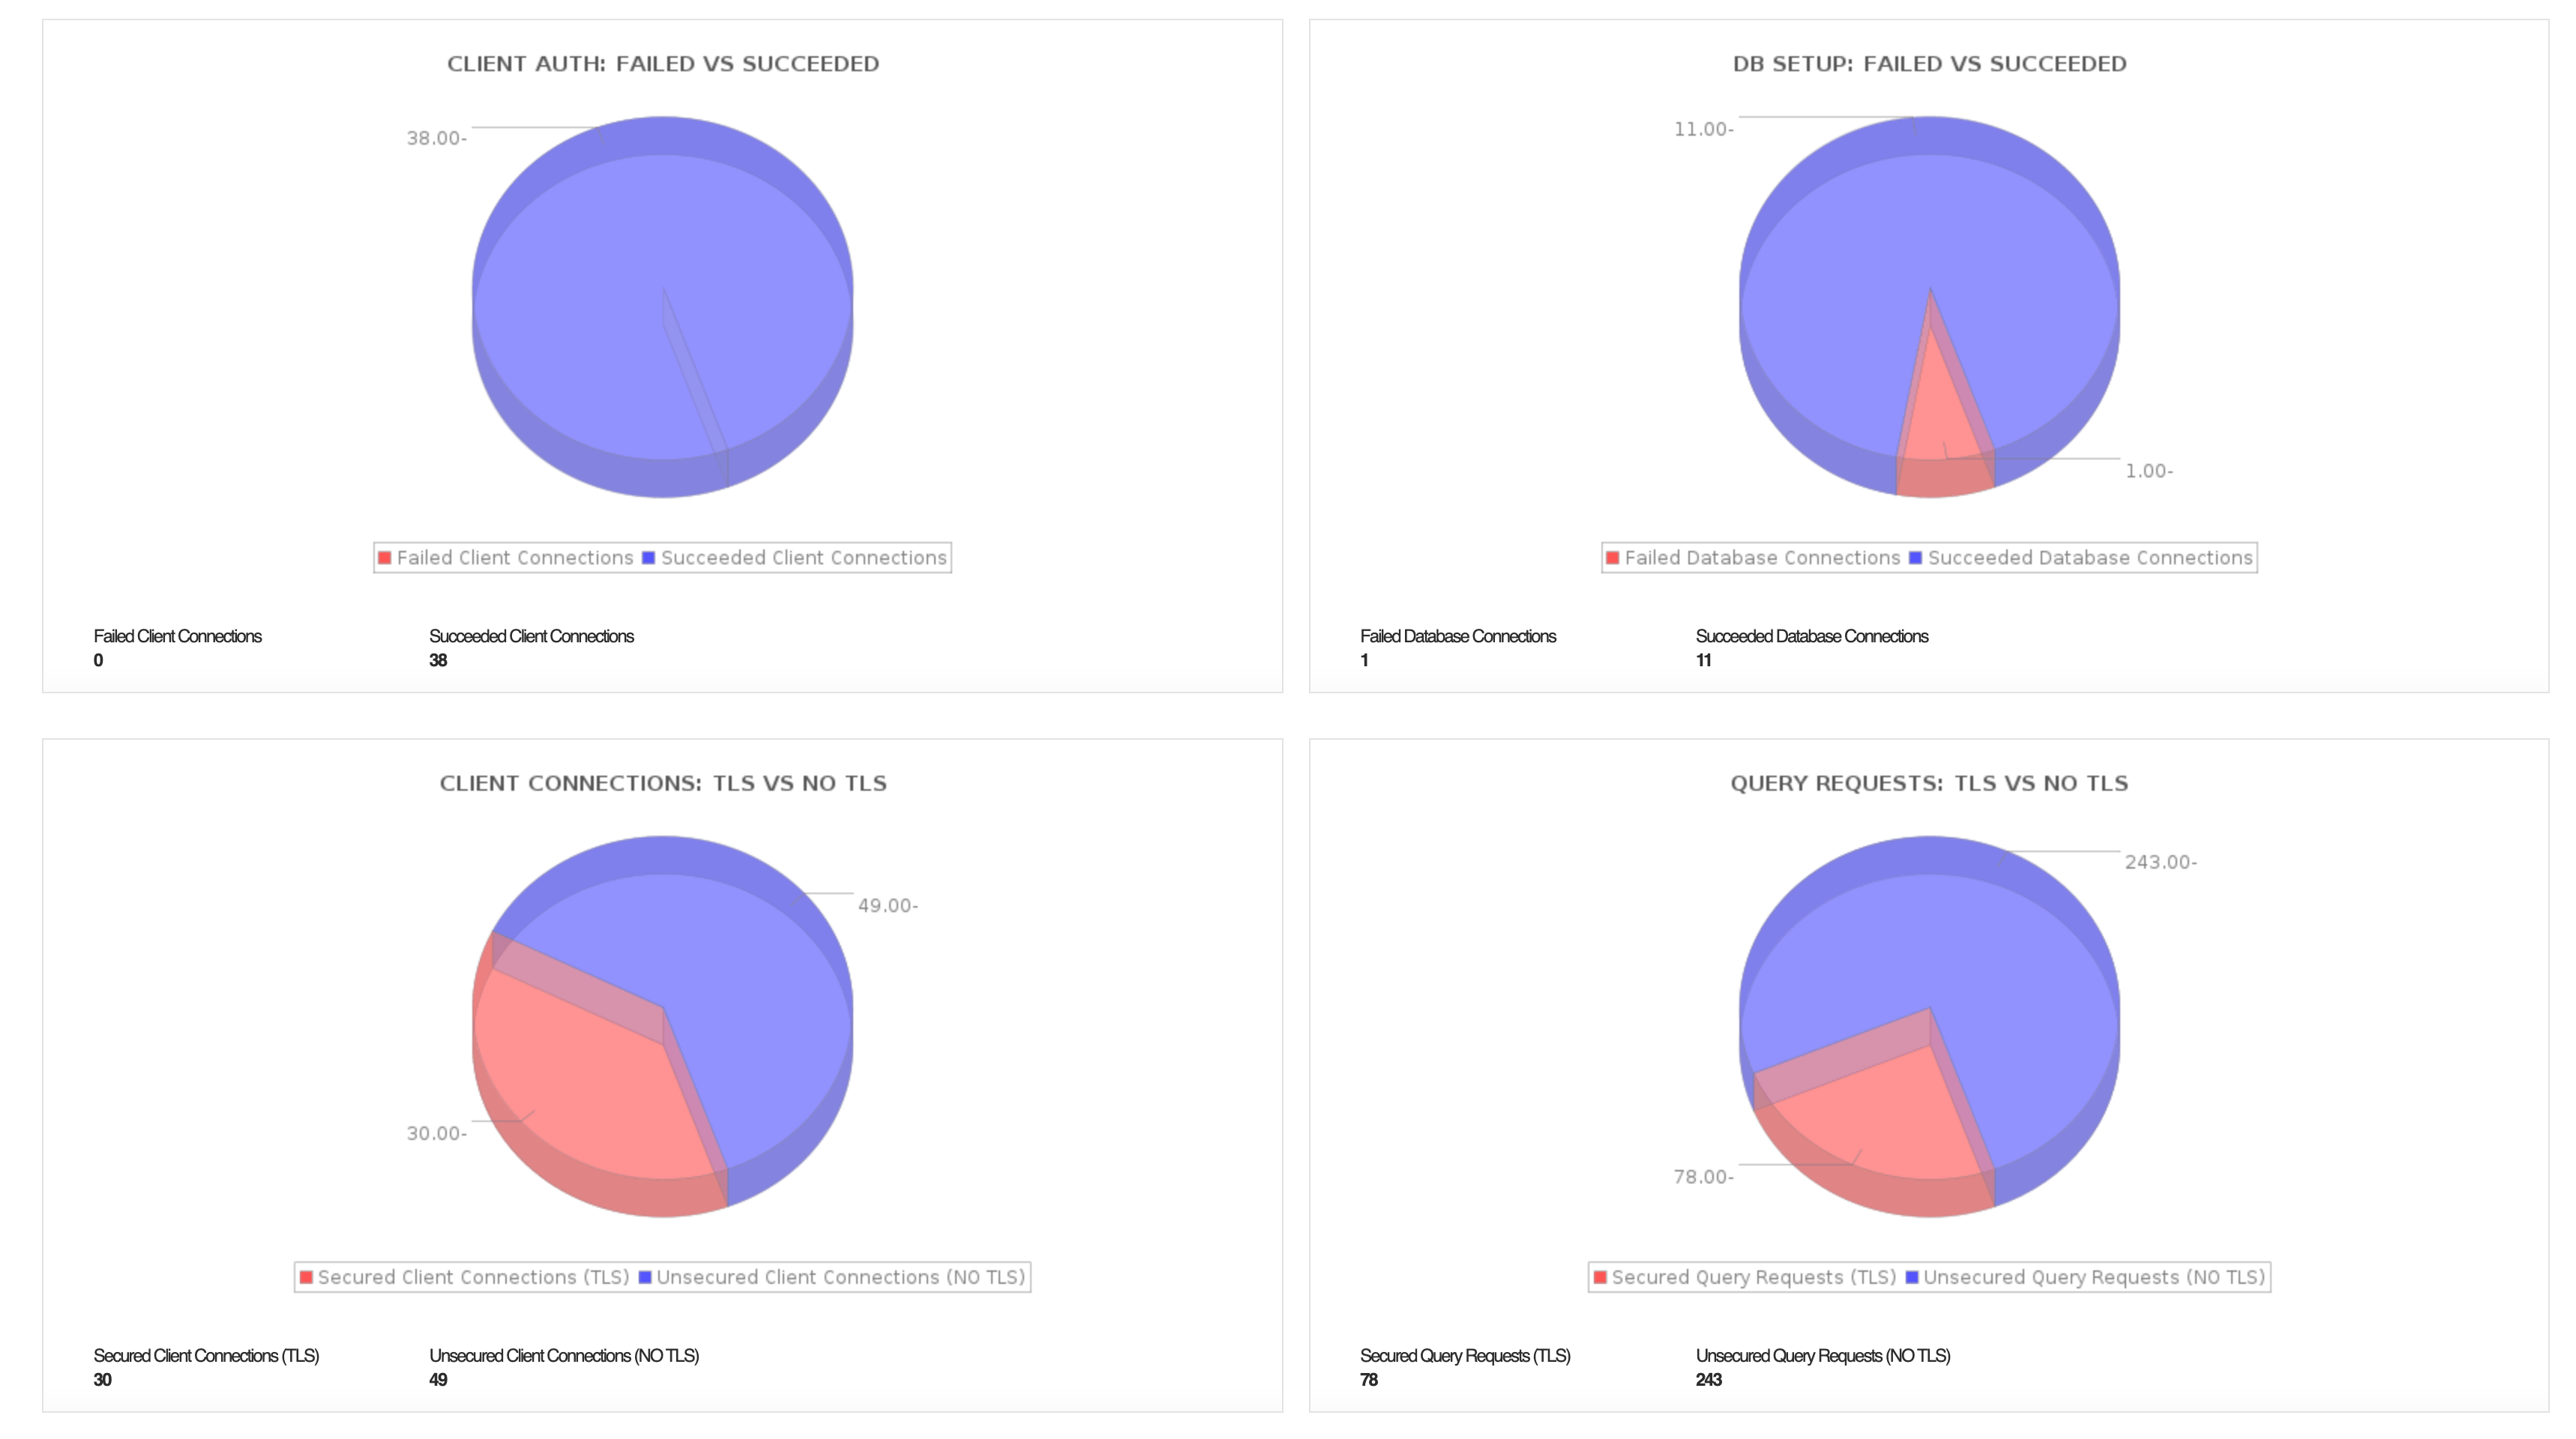
- Optimize database connectivity by monitoring active connections and identifying connection bottlenecks affecting application performance.
- Improve application scalability through visibility into connection pooling efficiency and proxy performance.
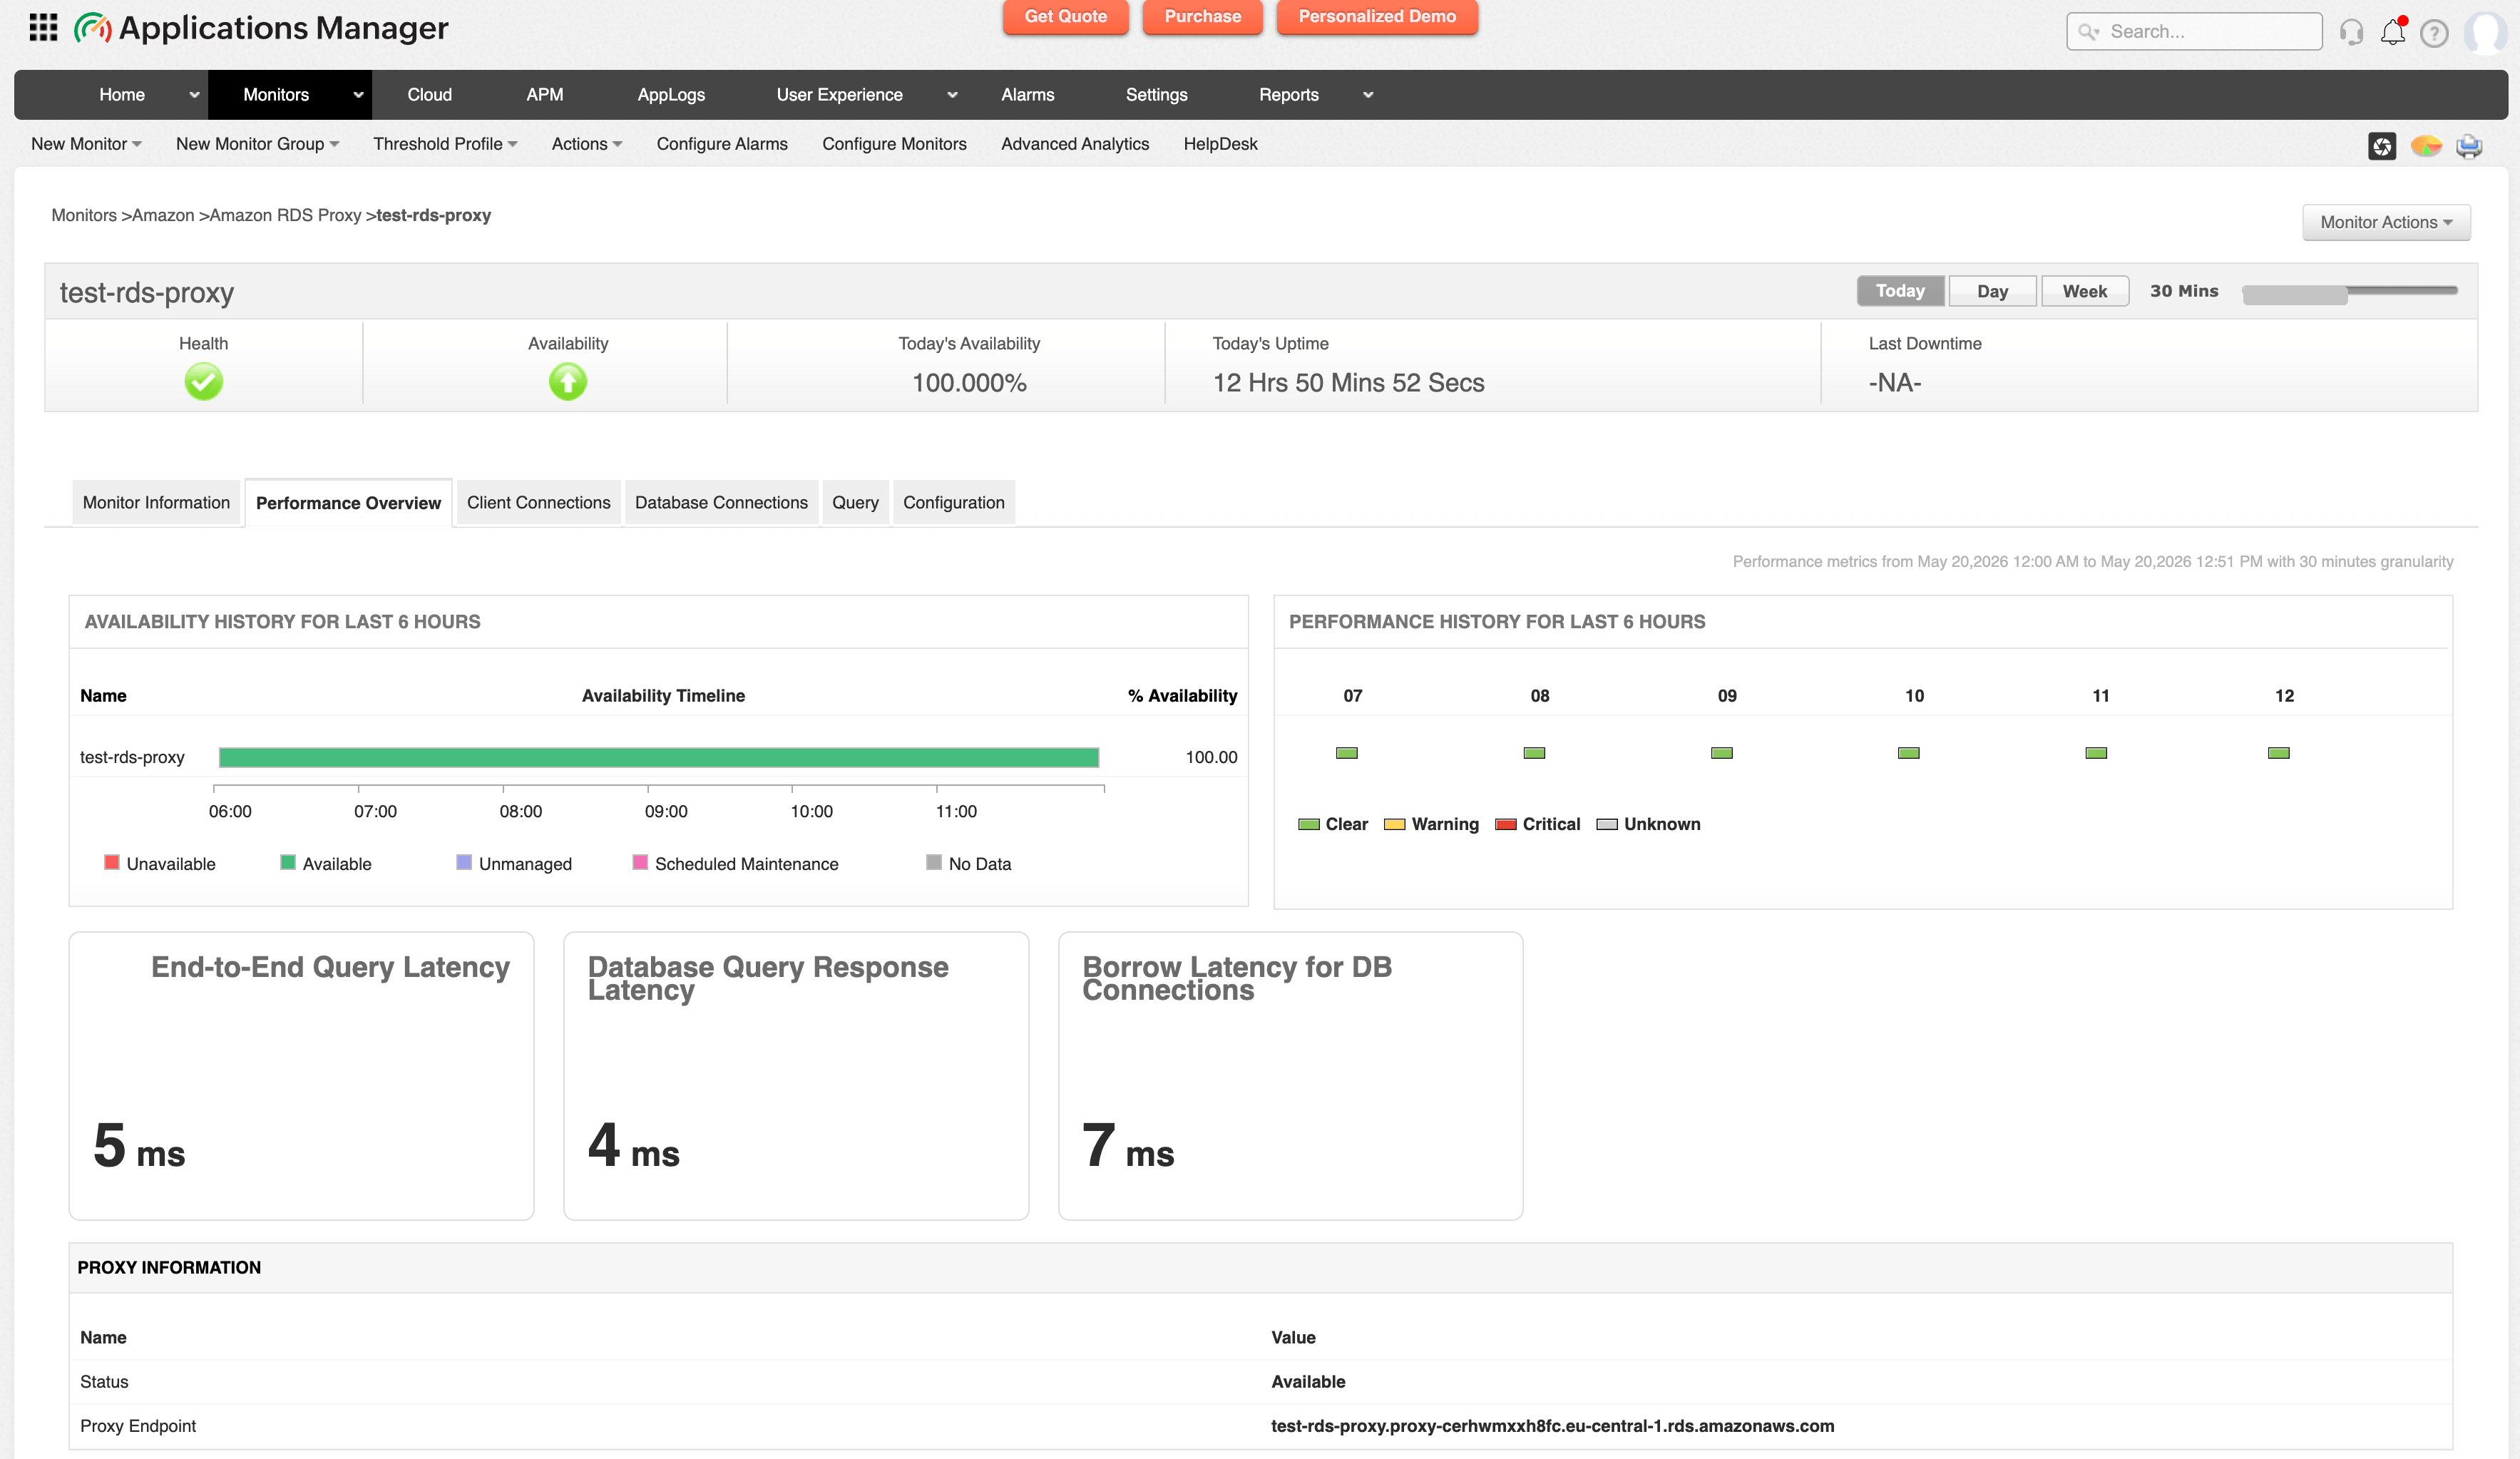
- Maintain database availability by tracking proxy health and detecting connectivity issues proactively.
- Reduce failover impact by monitoring proxy status and ensuring seamless database connection management.
- Enhance operational reliability through alerts on abnormal connection patterns or degraded proxy performance.
Looking to monitor your Amazon Database Services?
Applications Manager is an all-in-one monitoring tool that effectively monitors a wide range of Amazon services. Start monitoring your AWS resources and management services in minutes with Applications Manager's comprehensive AWS monitoring solution and ensure uninterrupted cloud operations. Download a 30-day free trial today!
Do more with Applications Manager's AWS monitoring with:
