Amazon Integration Services Monitoring
Amazon Integration Services enable organizations to streamline operations, enhance scalability, and improve interoperability between cloud-based and on-premise environments. It provides a range of services including serverless computing, API management, event-driven architecture, workflow automation, secured data transfer, data integration and real-time data streaming.
Monitoring integration services allow you to detect and resolve latency issues, API failures, event delivery delays, and data transfer bottlenecks. It is also essential to enhance security compliance by tracking unauthorized access, failed authentication attempts, and unusual activity. Applications Manager provides support for monitoring the following Amazon integration services:
Amazon ActiveMQ Brokers Monitoring
Gain deep insights into resource usage and prevent bottlenecks by monitoring Utilization % (CPU, Heap, Burst balance, Storage, Job Scheduler store). Monitor key metrics such as network I/O throughput and CPU credit balance to ensure smooth data transmission and consistent processing power.


Tracking Message flow rate helps detect backlogs or delays, while volume IOPS ensures the broker can handle high read/write operations. Perform Journal recovery comparison to monitor logs for failures in message recovery and ensure efficient message processing by maintaining producers vs. consumers balance. You can also monitor Open transactions to prevent performance degradation due to long-running transactions.Additionally, monitoring protocol connection usage helps optimize and troubleshoot messaging protocols.


Amazon RabbitMQ Brokers Monitoring
Applications Manager's RabbitMQ monitoring tool offers real-time insights into broker performance, availability, and health, ensuring smooth message queuing and communication. Track the number of exchanges, queues, and bindings to prevent unexpected resource expansion. Stats on the resource utilization like CPU, memory, and disk ensure the system doesn't hit resource limits that could cause slowdowns or crashes.


Measure I/O latency and Used File descriptors count to identify possible bottlenecks and to avoid connection failures. Analyze Queued messages and Message flow rate to achieve system efficiency, ensuring a balance between message production and consumption.


Amazon Region-wise Simple Email Service Resources Monitoring
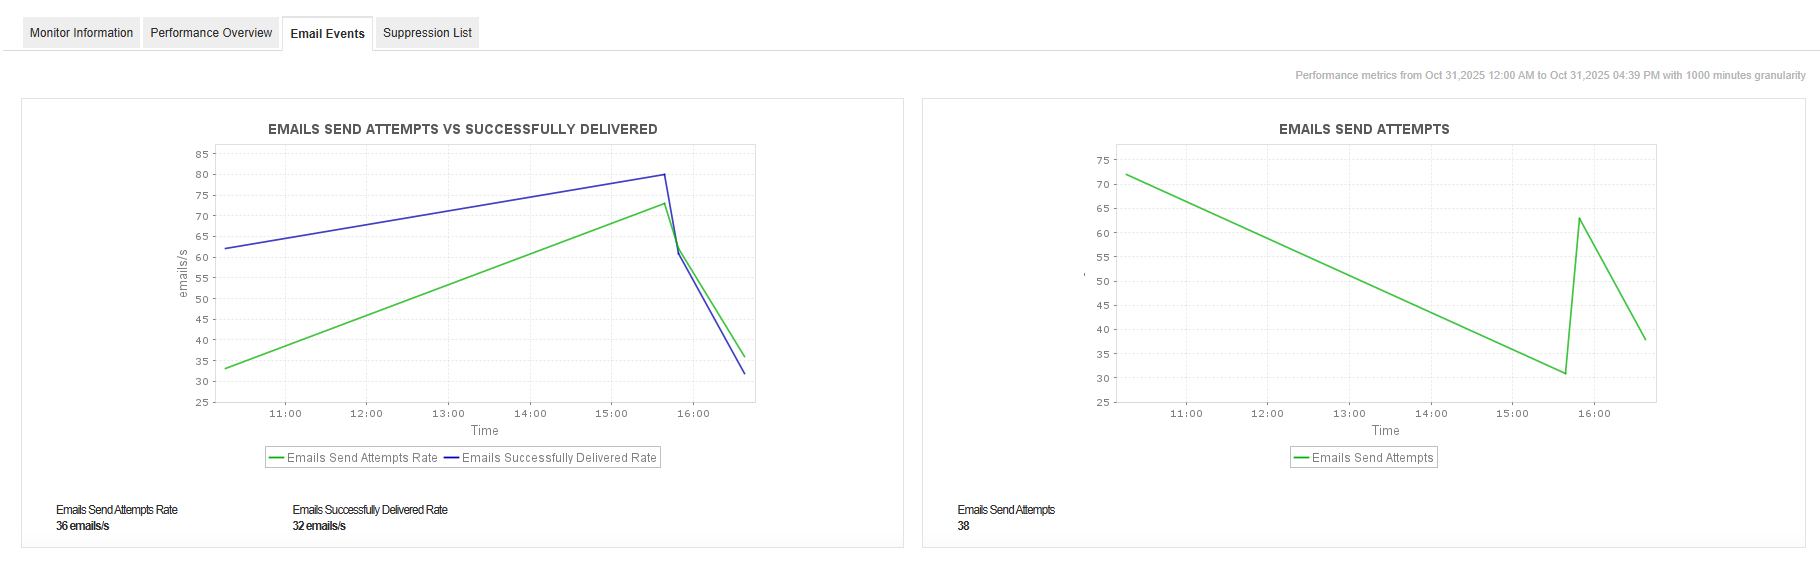
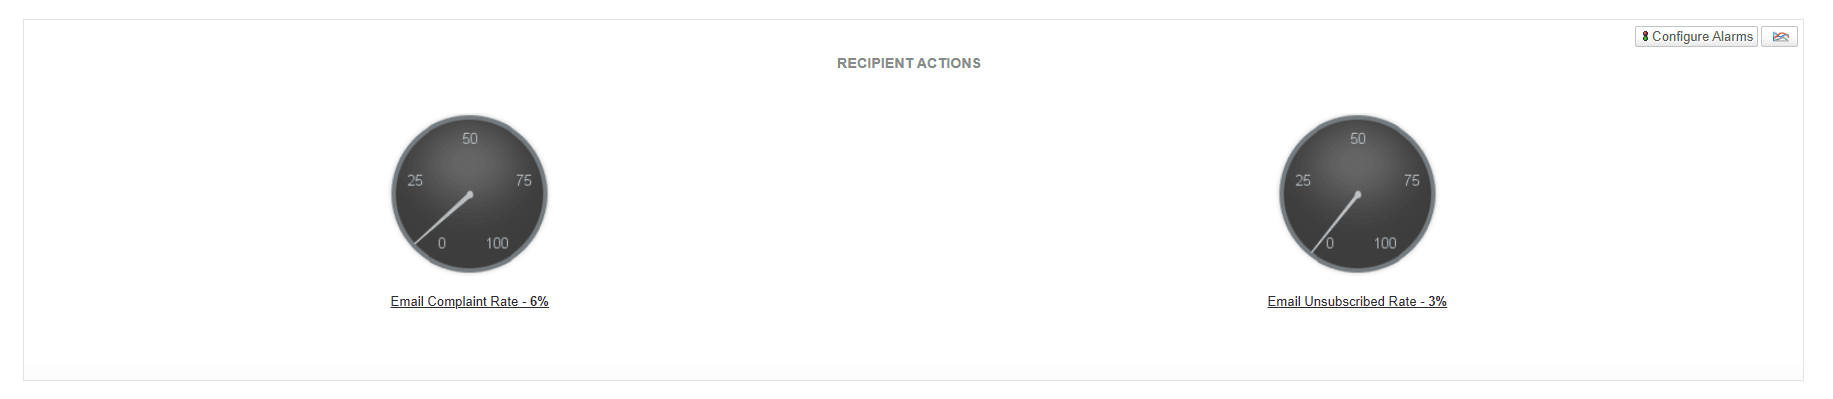
The AWS Simple Email Service (SES) monitor in Applications Manager helps you track the performance and reliability of your email-sending operations. It provides visibility into key metrics across successful email path (success, open, click), unsuccessful email path (rejection, bounce, delay, rendering failure), and recipient actions (complaint, unsubscribe) helping you assess overall email delivery efficiency.
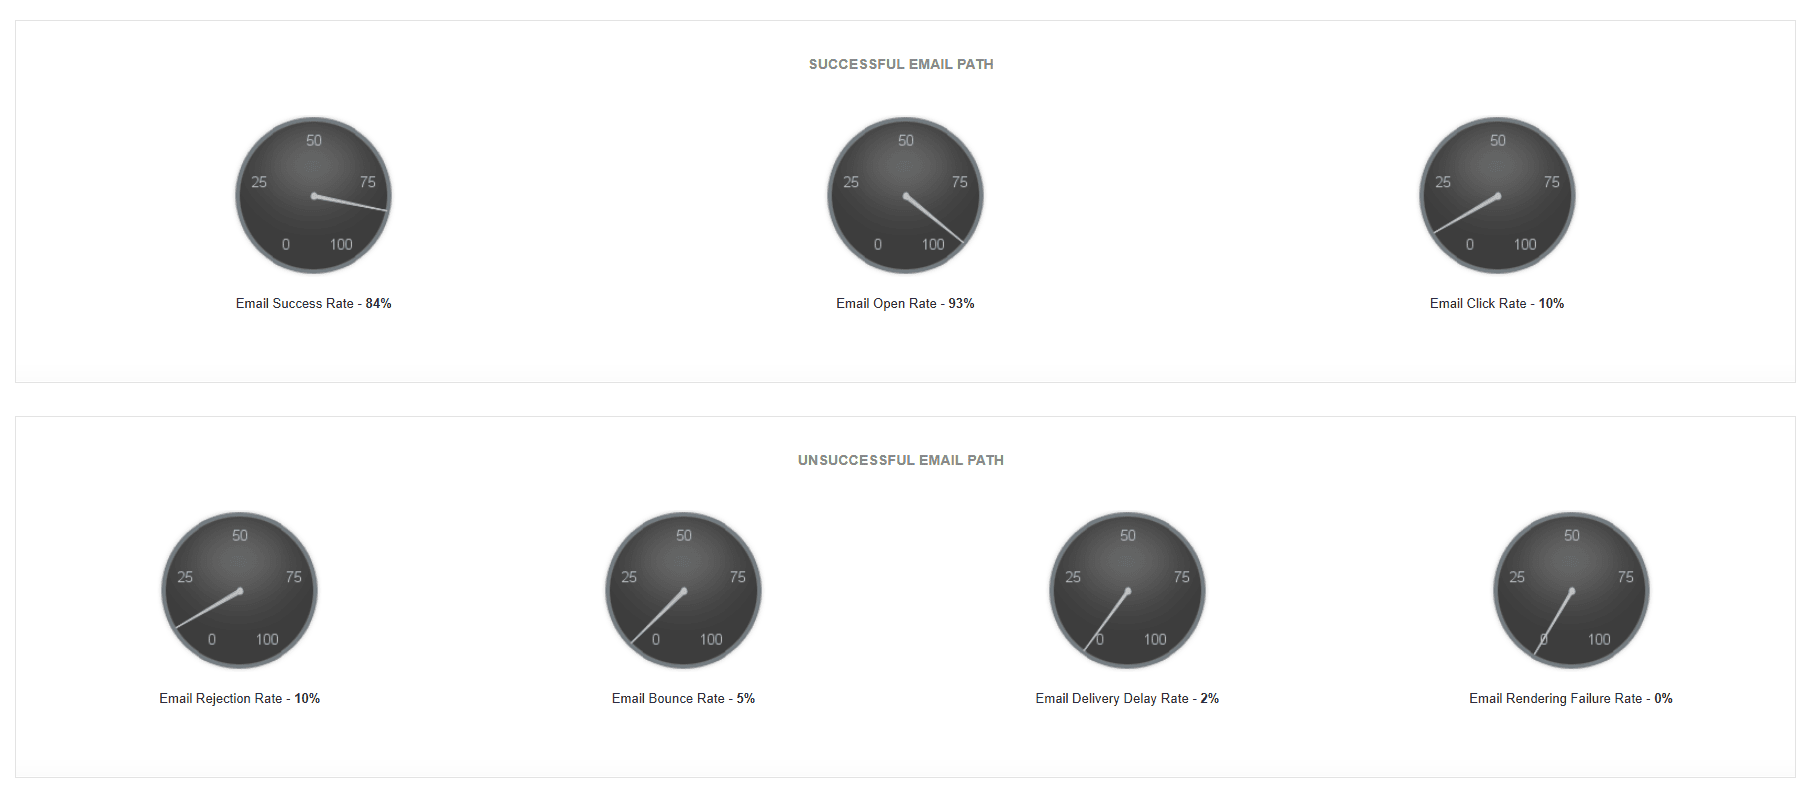
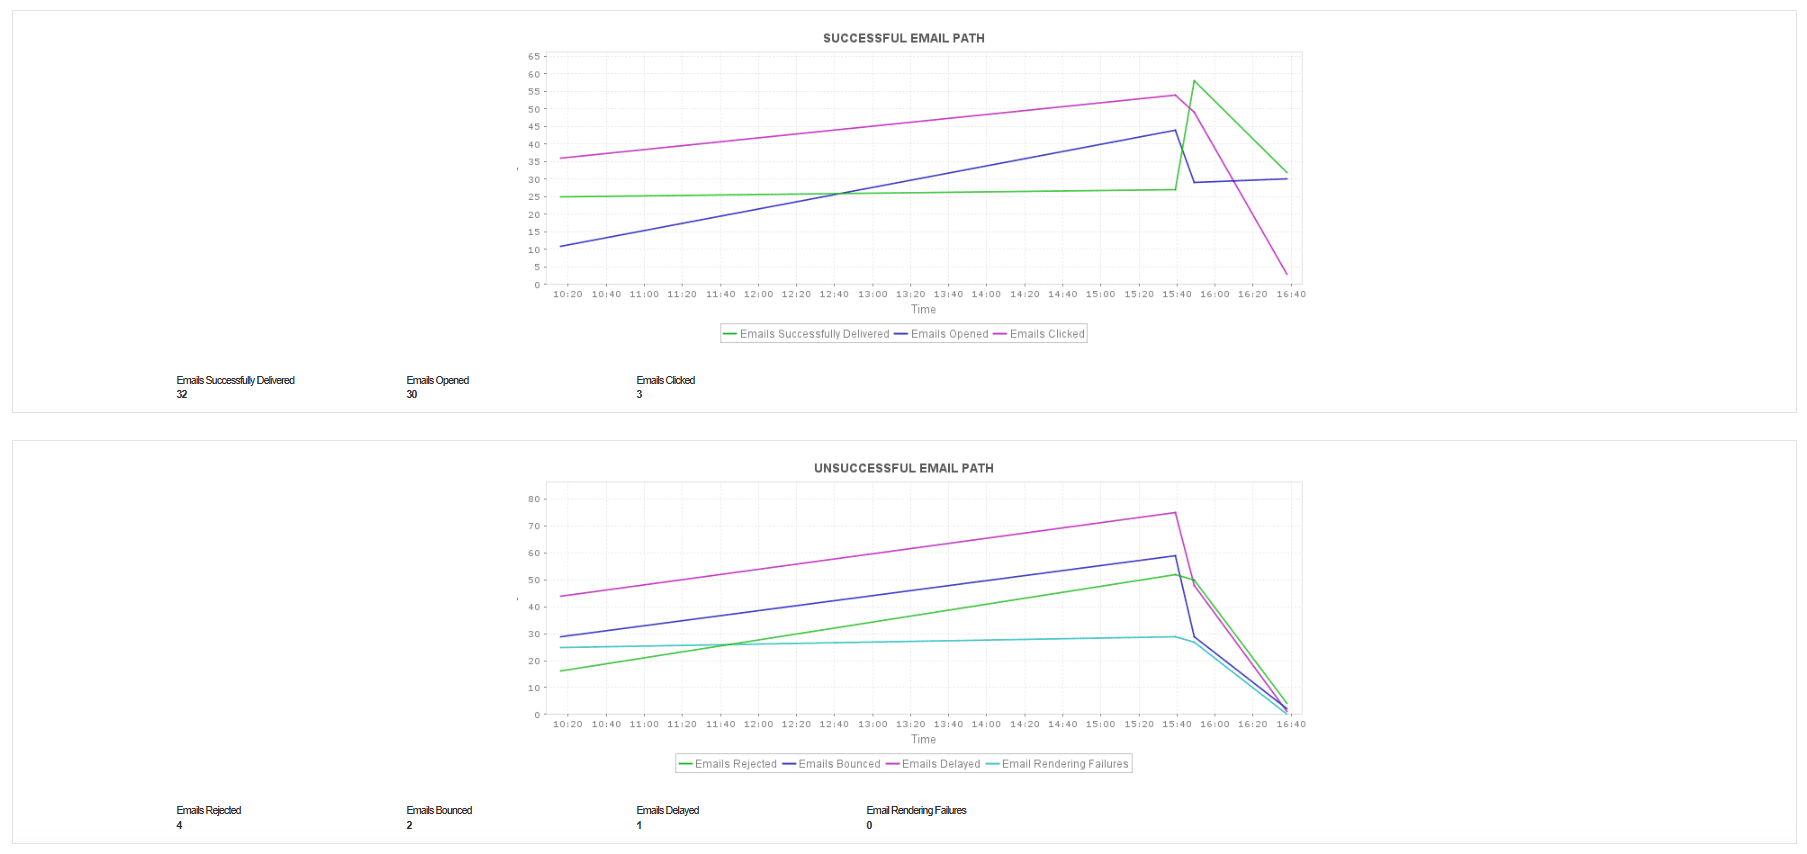
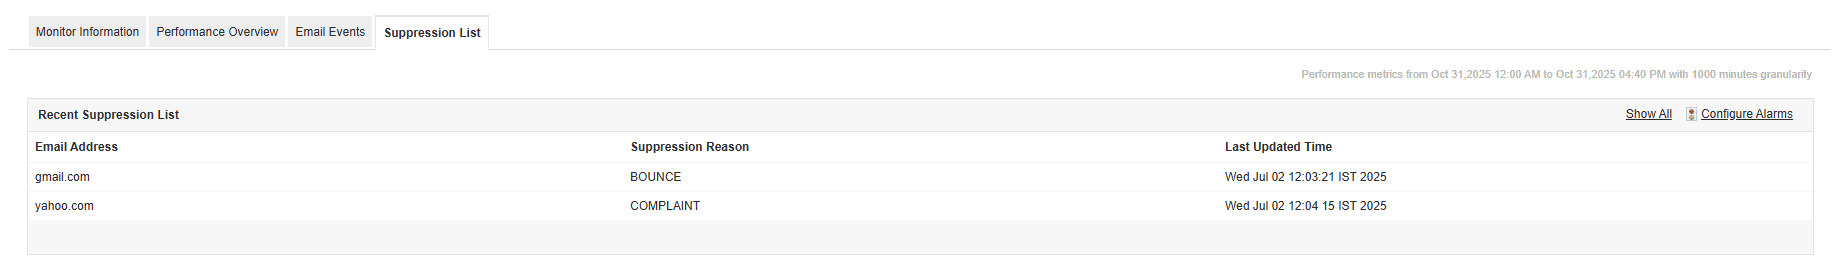
You can monitor issues like rejections, delivery delays, and rendering failures to quickly identify and resolve potential problems affecting email deliverability. The Suppression List helps you track the emails or domains from which messages have previously bounced or were marked as complaints, enabling you to maintain a healthy sender reputation.
By analyzing these metrics and trends, Applications Manager helps you troubleshoot email delivery issues, optimize your SES configuration, and ensure consistent, reliable communication with your users.
Amazon Step Function Monitoring
AWS Step Function is a fully managed service that enables you to design and run serverless workflows by orchestrating multiple AWS services. It simplifies process automation by allowing you to visually build and monitor workflows, helping ensure reliable execution of business-critical tasks.
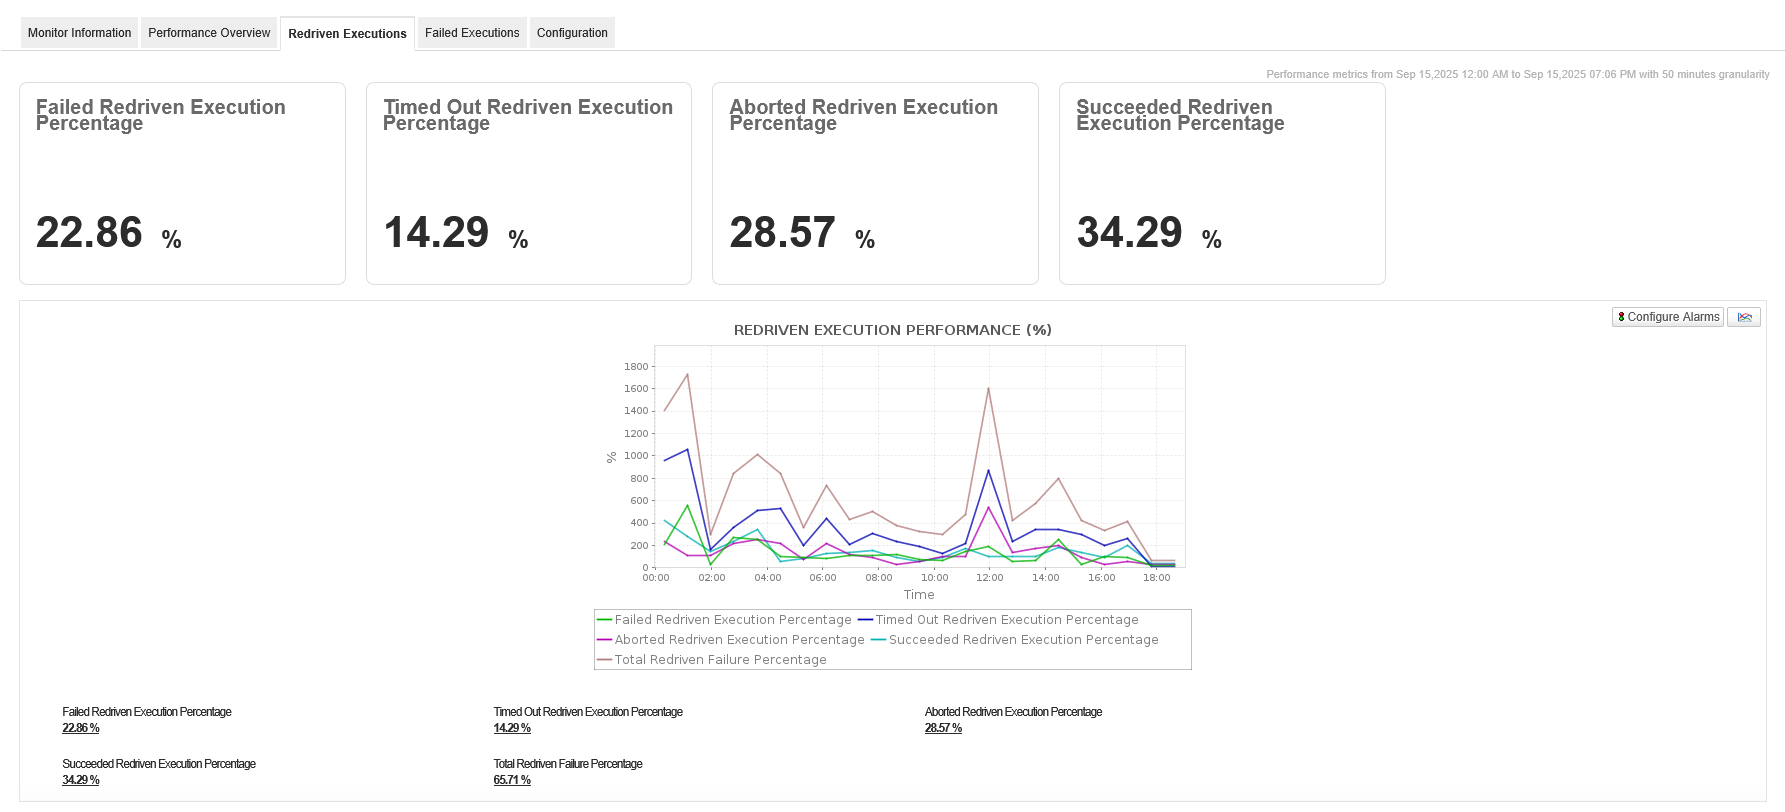
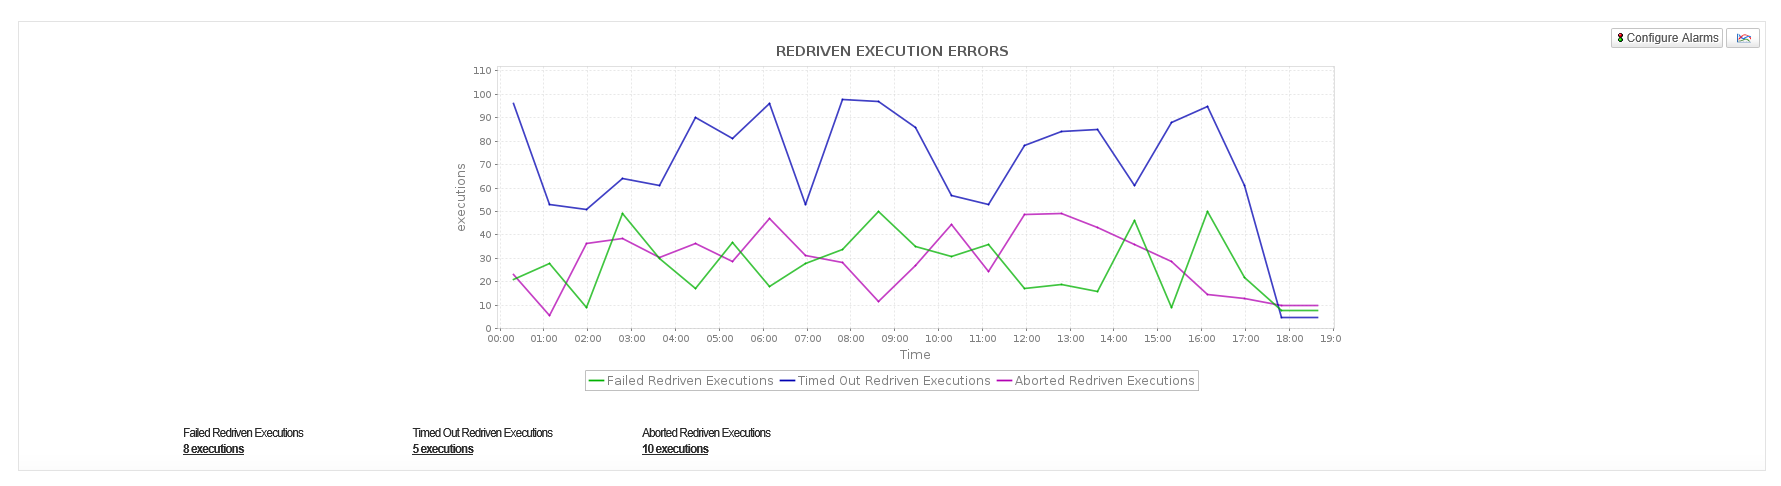
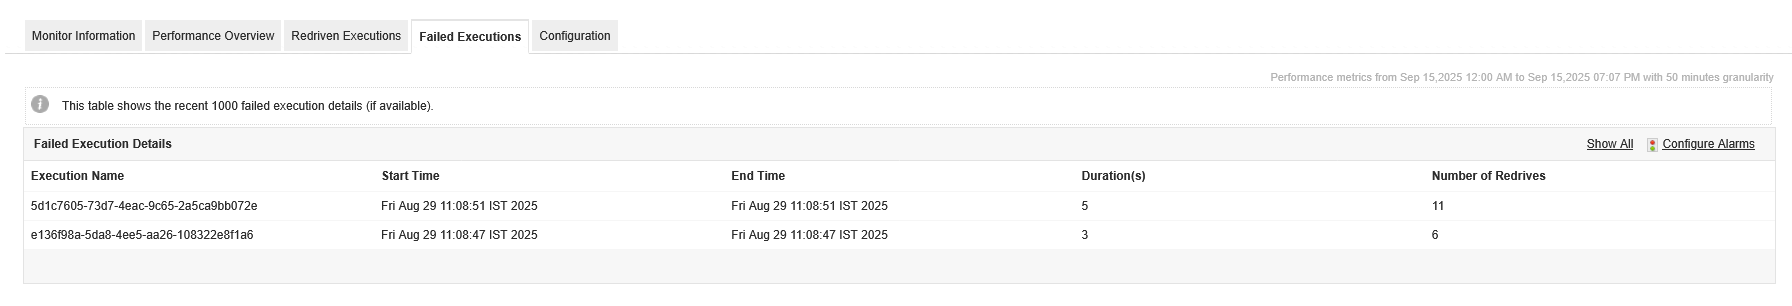
Applications Manager provides in-depth monitoring of your Step Functions by tracking execution performance, workflow health, and operational bottlenecks. For standard state machines, you can monitor redriven execution performance, errors, and their rates, as well as view detailed failed execution lists. For express state machines, in addition to general execution monitoring, Applications Manager also provides insights into billed memory and billed duration, giving you added visibility to optimize cost and resource utilization.
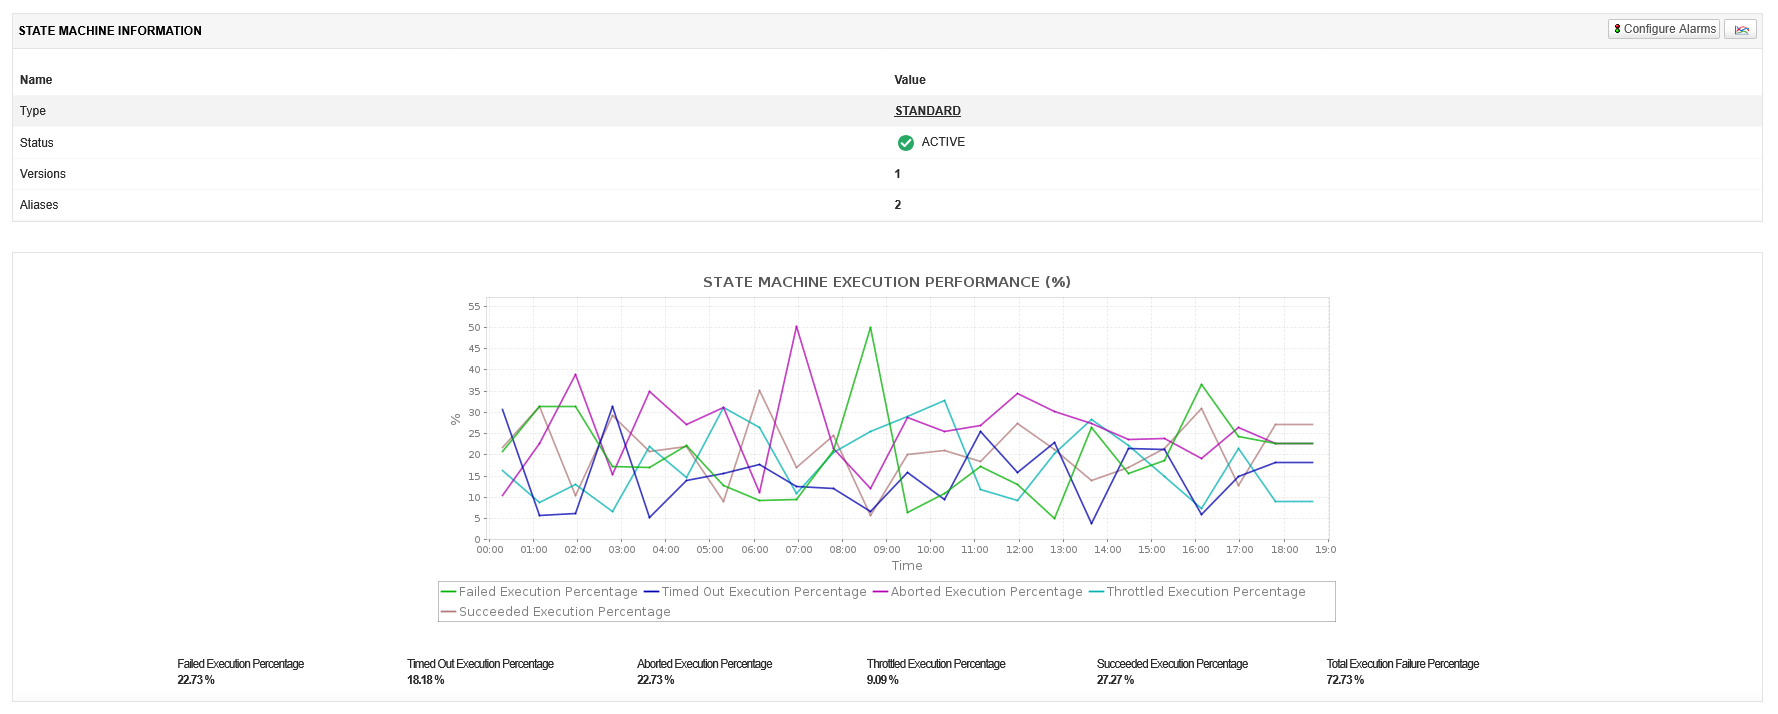
By analyzing execution outcomes such as failed, timed-out, throttled, and aborted executions, along with success rates, execution counts, and state machine health indicators, you can ensure consistent workflow availability. Detailed state machine information such as type, status, versions, and aliases further supports workflow management and auditing.
Amazon SQS Queues Monitoring
Amazon Simple Queue Service (Amazon SQS) offers a secure, durable, and available hosted queue that lets its users integrate and decouple distributed software systems and components. Applications Manager's Amazon SQS Queues monitoring tool offers Amazon SQS monitoring capabilities which enables you to keep a keen eye on the important KPIs. Learn more about SQS Queues monitoring.


Get started now!
Applications Manager is an all-in-one Amazon monitoring tool that effectively monitors a wide range of Amazon services like
To explore more of Applications Manager, download our 30-day free trial now!
