Why thread dump analysis matters: Java thread dump analysis with Applications Manager

When a Java application slows down, hangs, or crashes, one of the first steps in diagnosing the issue is to collect a thread dump. A thread dump is essentially a snapshot of all active threads in a Java Virtual Machine (JVM) at a given time. It shows what each thread is doing, its state—whether it is active, waiting, or blocked—and the stack trace leading up to that point.
Java thread dumps are crucial for performance diagnosis. They help identify deadlocks, isolate infinite loops, spot threads competing for shared resources, and track down the source of high CPU consumption. However, interpreting these dumps manually is time-consuming, error-prone, and often overwhelming—especially in large environments.
The trouble with manual analysis
Manually combing through hundreds of lines in a thread dump takes time. Unless you know exactly what to look for, it is easy to miss subtle patterns that indicate critical issues. As Java applications grow in complexity, relying on manual methods becomes less viable. Patterns like recurring deadlocks, runaway threads, or excessive blocking are not always obvious, especially when you are dealing with production-level traffic.
This is where automation comes in,not to replace expertise but to streamline the process, reduce the time spent on manual tracking, and surface actionable insights faster.
How Applications Manager helps
ManageEngine Applications Manager acts as a full-fledged thread dump analyzer. It doesn’t just collect thread dumps—it processes and parses them to extract meaningful data. Whether triggered manually or scheduled during key intervals, Applications Manager pulls dumps from your JVMs and automatically breaks them down.

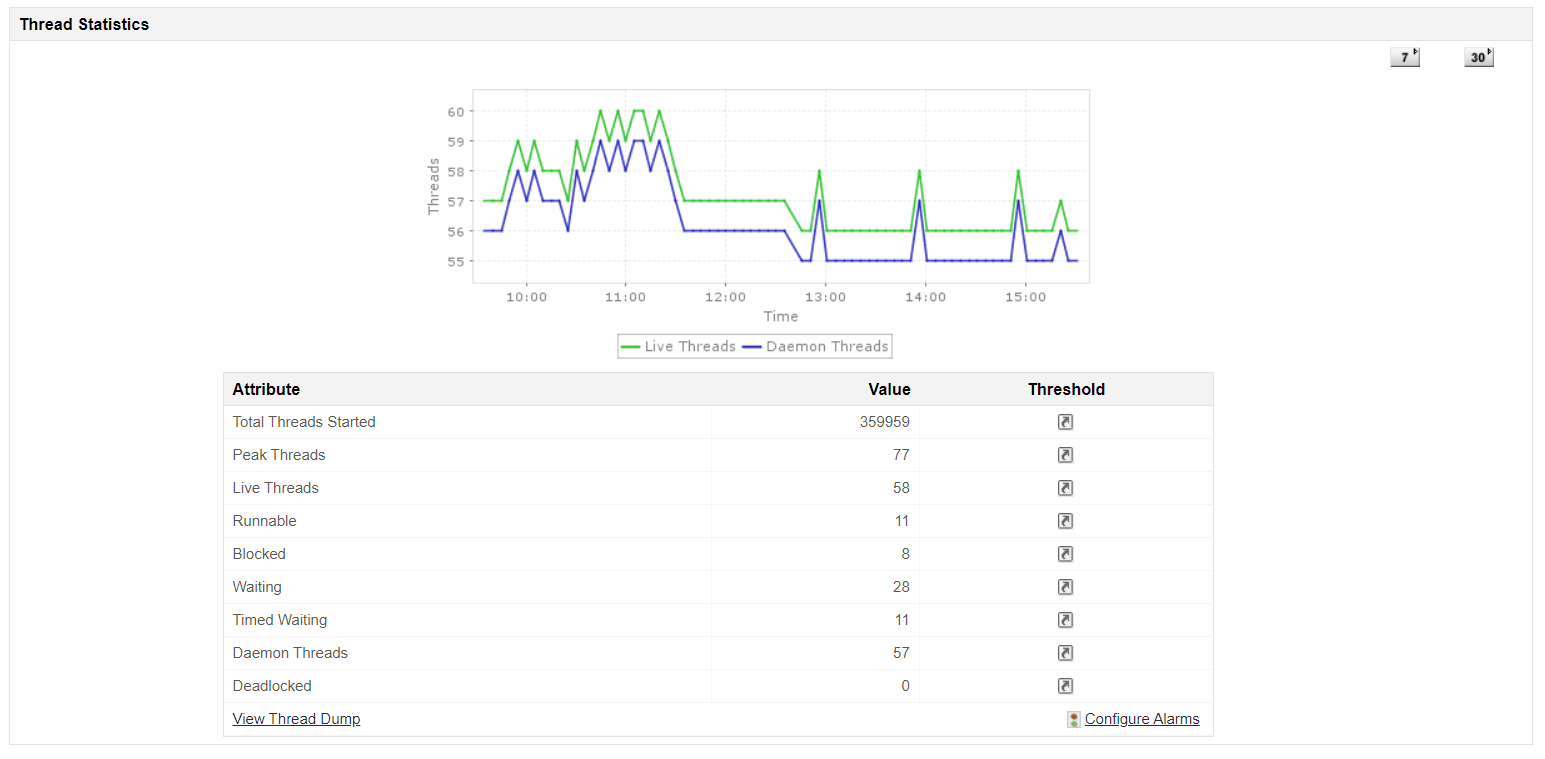
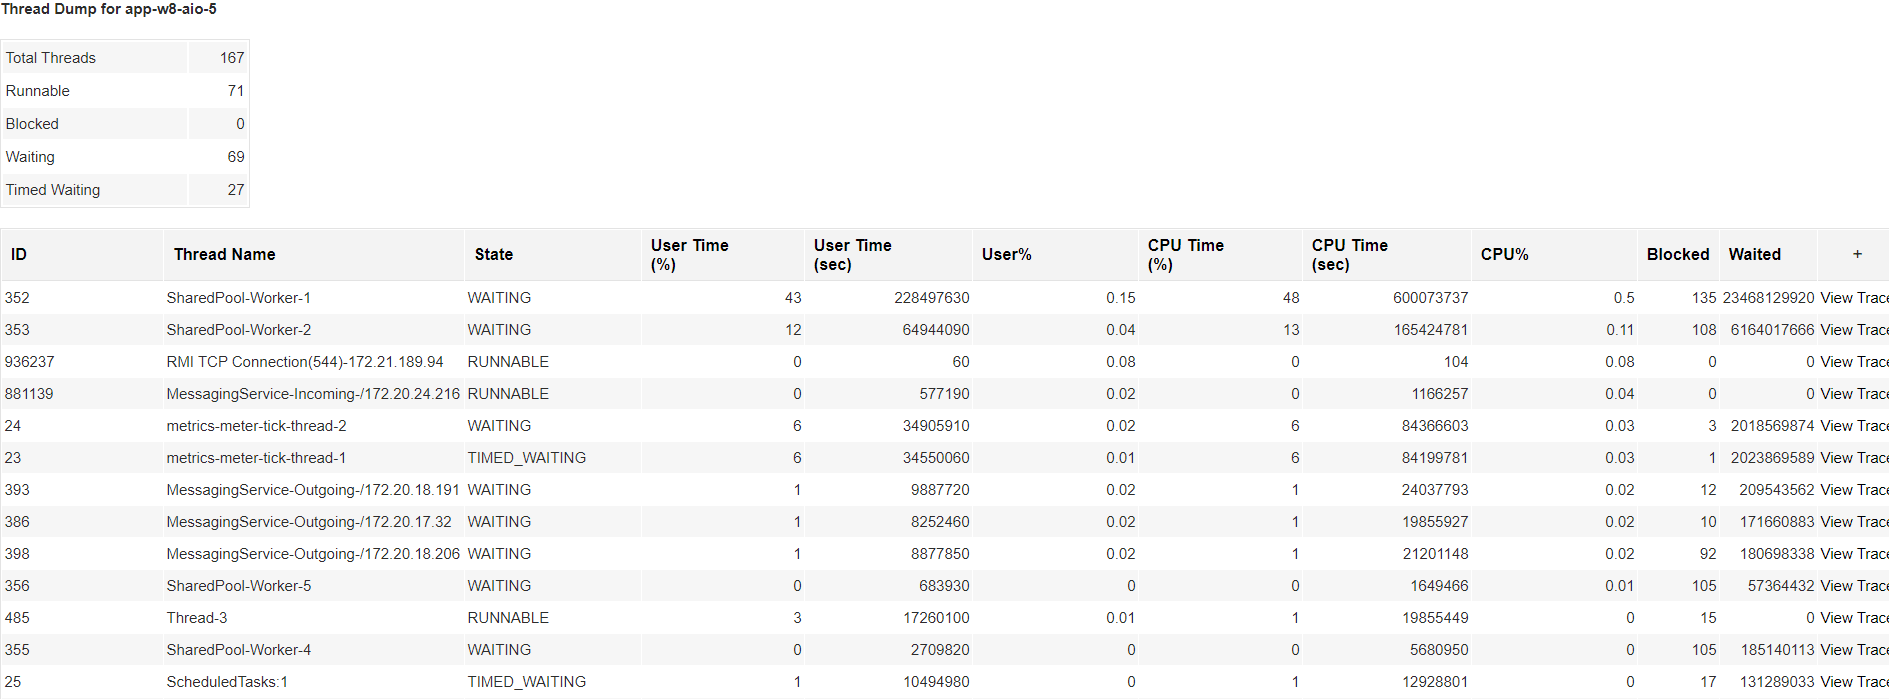
Once collected, thread dumps are categorized by thread state and visualized for quick understanding. You will see which threads are running, blocked, or waiting, and how many fall into each category. It also flags key problems like deadlocks automatically, highlighting the threads and resources involved.
Faster diagnosis with built-in intelligence
The tool doesn’t stop at categorization. It highlights threads consuming high CPU, visualizes thread activity over time, and maps out individual stack traces for closer inspection. Each stack trace is presented clearly, making it easier to trace execution paths and understand which parts of your code might be causing trouble.

Applications Manager can store historical thread dumps, too, so you can compare dumps across time to identify trends or recurring issues. Whether it is a one-off spike in resource usage or a slow memory leak tied to specific thread activity, this historical context gives you a more complete picture.
Reducing time to resolve issues
With real-time parsing and intelligent grouping, Applications Manager turns raw thread data into meaningful, actionable insights. It cuts down the mean time to resolution (MTTR) by removing guesswork from performance troubleshooting. Instead of digging through logs or relying on hunches, your team can go straight to the source of the issue—backed by visual evidence.
You can also correlate thread dump insights with performance metrics like CPU usage, memory consumption, and response times. This broader view makes it easier to understand how a spike in blocked threads ties back to degraded performance elsewhere in your application stack.
A smarter way to handle JVM issues
Applications Manager gives you the tools to resolve common JVM issues faster and with more confidence. It can flag and explain deadlocks, identify high CPU threads and why they are misbehaving, and help you understand what is happening when a request hangs for too long. It is not just about what happened—it is about why it happened, and what you can do to fix it.
Whether you are managing a single JVM or an entire cluster of Java applications, thread dump analysis should not be a manual bottleneck. With Applications Manager, it is not. You get the visibility and depth needed to troubleshoot JVM problems efficiently, without losing time or clarity.
Beyond thread dump analysis, Applications Manager provides deep APM capabilities for code-level insights into your Java applications. It traces web transactions, database calls, and external dependencies within Java applications. It can identify slow or erroneous transactions and allow drilling down to the exact line of code causing delays by triggering detailed transaction traces. This granular visibility complements thread dump analysis by correlating thread-level issues with application-level performance, helping optimize response times and resource utilization.
Ready to see how it works? Try Applications Manager with a free 30-day trial or connect with our team for a personalized demo.