Google Kubernetes Engine (GKE) Monitoring
Google Kubernetes Engine (also known as GKE) is a cluster manager and orchestration system for running Docker containers in the cloud. It is a production-ready environment with guaranteed uptime, load balancing and included container networking features. Google Kubernetes Engine monitoring is the process of aggregating metrics and events from your Kubernetes environment on GKE performance and tracking them, to understand your application's behavior in production.
Applications Manager's GKE monitoring provides a rich set of observable signals that ensures deep visibility into the applications hosted, and cautionary signals to notify abnormal performance and reduce MTTR. You can also reduce manual intervention as our intelligent fault management system traces and identifies the root cause of errors and helps with corrective actions. Besides GKE monitoring metrics to keep track of real time data and analyze historical performance, Applications Manager also notifies users of resource usage spikes, with forecast reports that employ machine learning techniques, to predict usage.
Monitor KPIs that define the performance of your Kubernetes Engine.
Keep resource usage in check.
To ensure sustained health and availability of Kubernetes containers, it is imperative to make sure that the resources are not overused. GKE monitoring tools like Applications Manager provide extensive Kubernetes' resource consumption stats like cluster, node and pods used by the applications.

Monitor Node status.
The number of nodes created by default in a Kubernetes cluster is three. Monitoring the nodes not only help you ensure availability of the nodes but also verify the status of the clusters they reside in. With the information provided by our GKE monitor on the nodes in a Kubernetes cluster, identify nodes that are CPU and memory intensive and optimize them so as to avoid any performance degradation. Additionally, our GKE monitoring dashboard also provides network stats to help you streamline the traffic.

Ensure optimal performance of pods.
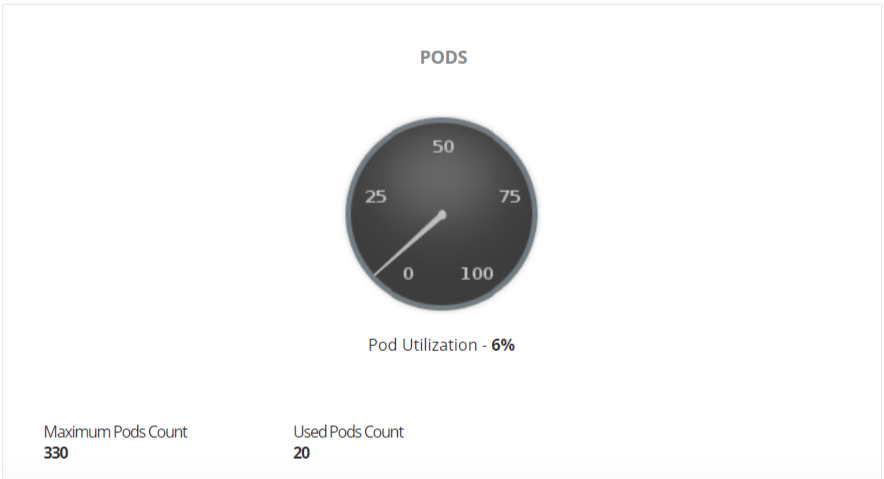
Pods are the smallest units in Kubernetes deployments. They contain single or multiple containers which share the resources. Monitor GKE and the status of your deployments in detail with intricate information about pods such as the CPU and memory used by each pod, traffic stats, disk volume consumption stats, ephemeral storage usage, and resource limit stats. Applications Manager's Google Kubernetes Engine (GKE) monitoring also displays the top pods based on CPU and memory usage for quick and easy comprehension of the performance.

Get started with Applications Manager's GKE monitoring!
Alongside our GKE Application monitoring feature, you can also use Applications Manager's GCP Monitoring tool to monitor GCP Compute Engine, Cloud Filestore and Cloud Storage services as well as Docker containers and Kubernetes clusters.
To explore Applications Manager on your own, download our 30-day free trial or schedule a personalized demo for a guided tour.

