ADDM Map
- Viewing the ADDM Map
- Map components
- Viewing resource details
- Summary
- Connected Apps
- Viewing resource dependencies
- Example use-case
ADDM Map provides a centralized view of relationships discovered across Applications Manager. It brings together relationships from modules such as ADDM, APM Insight, cloud monitoring, and dependent devices, helping you understand how monitored resources are connected from a single map.
For more information about discovering resources and configuring dependency mapping, see Application Discovery and Dependency Mapping (ADDM).
Viewing the ADDM Map
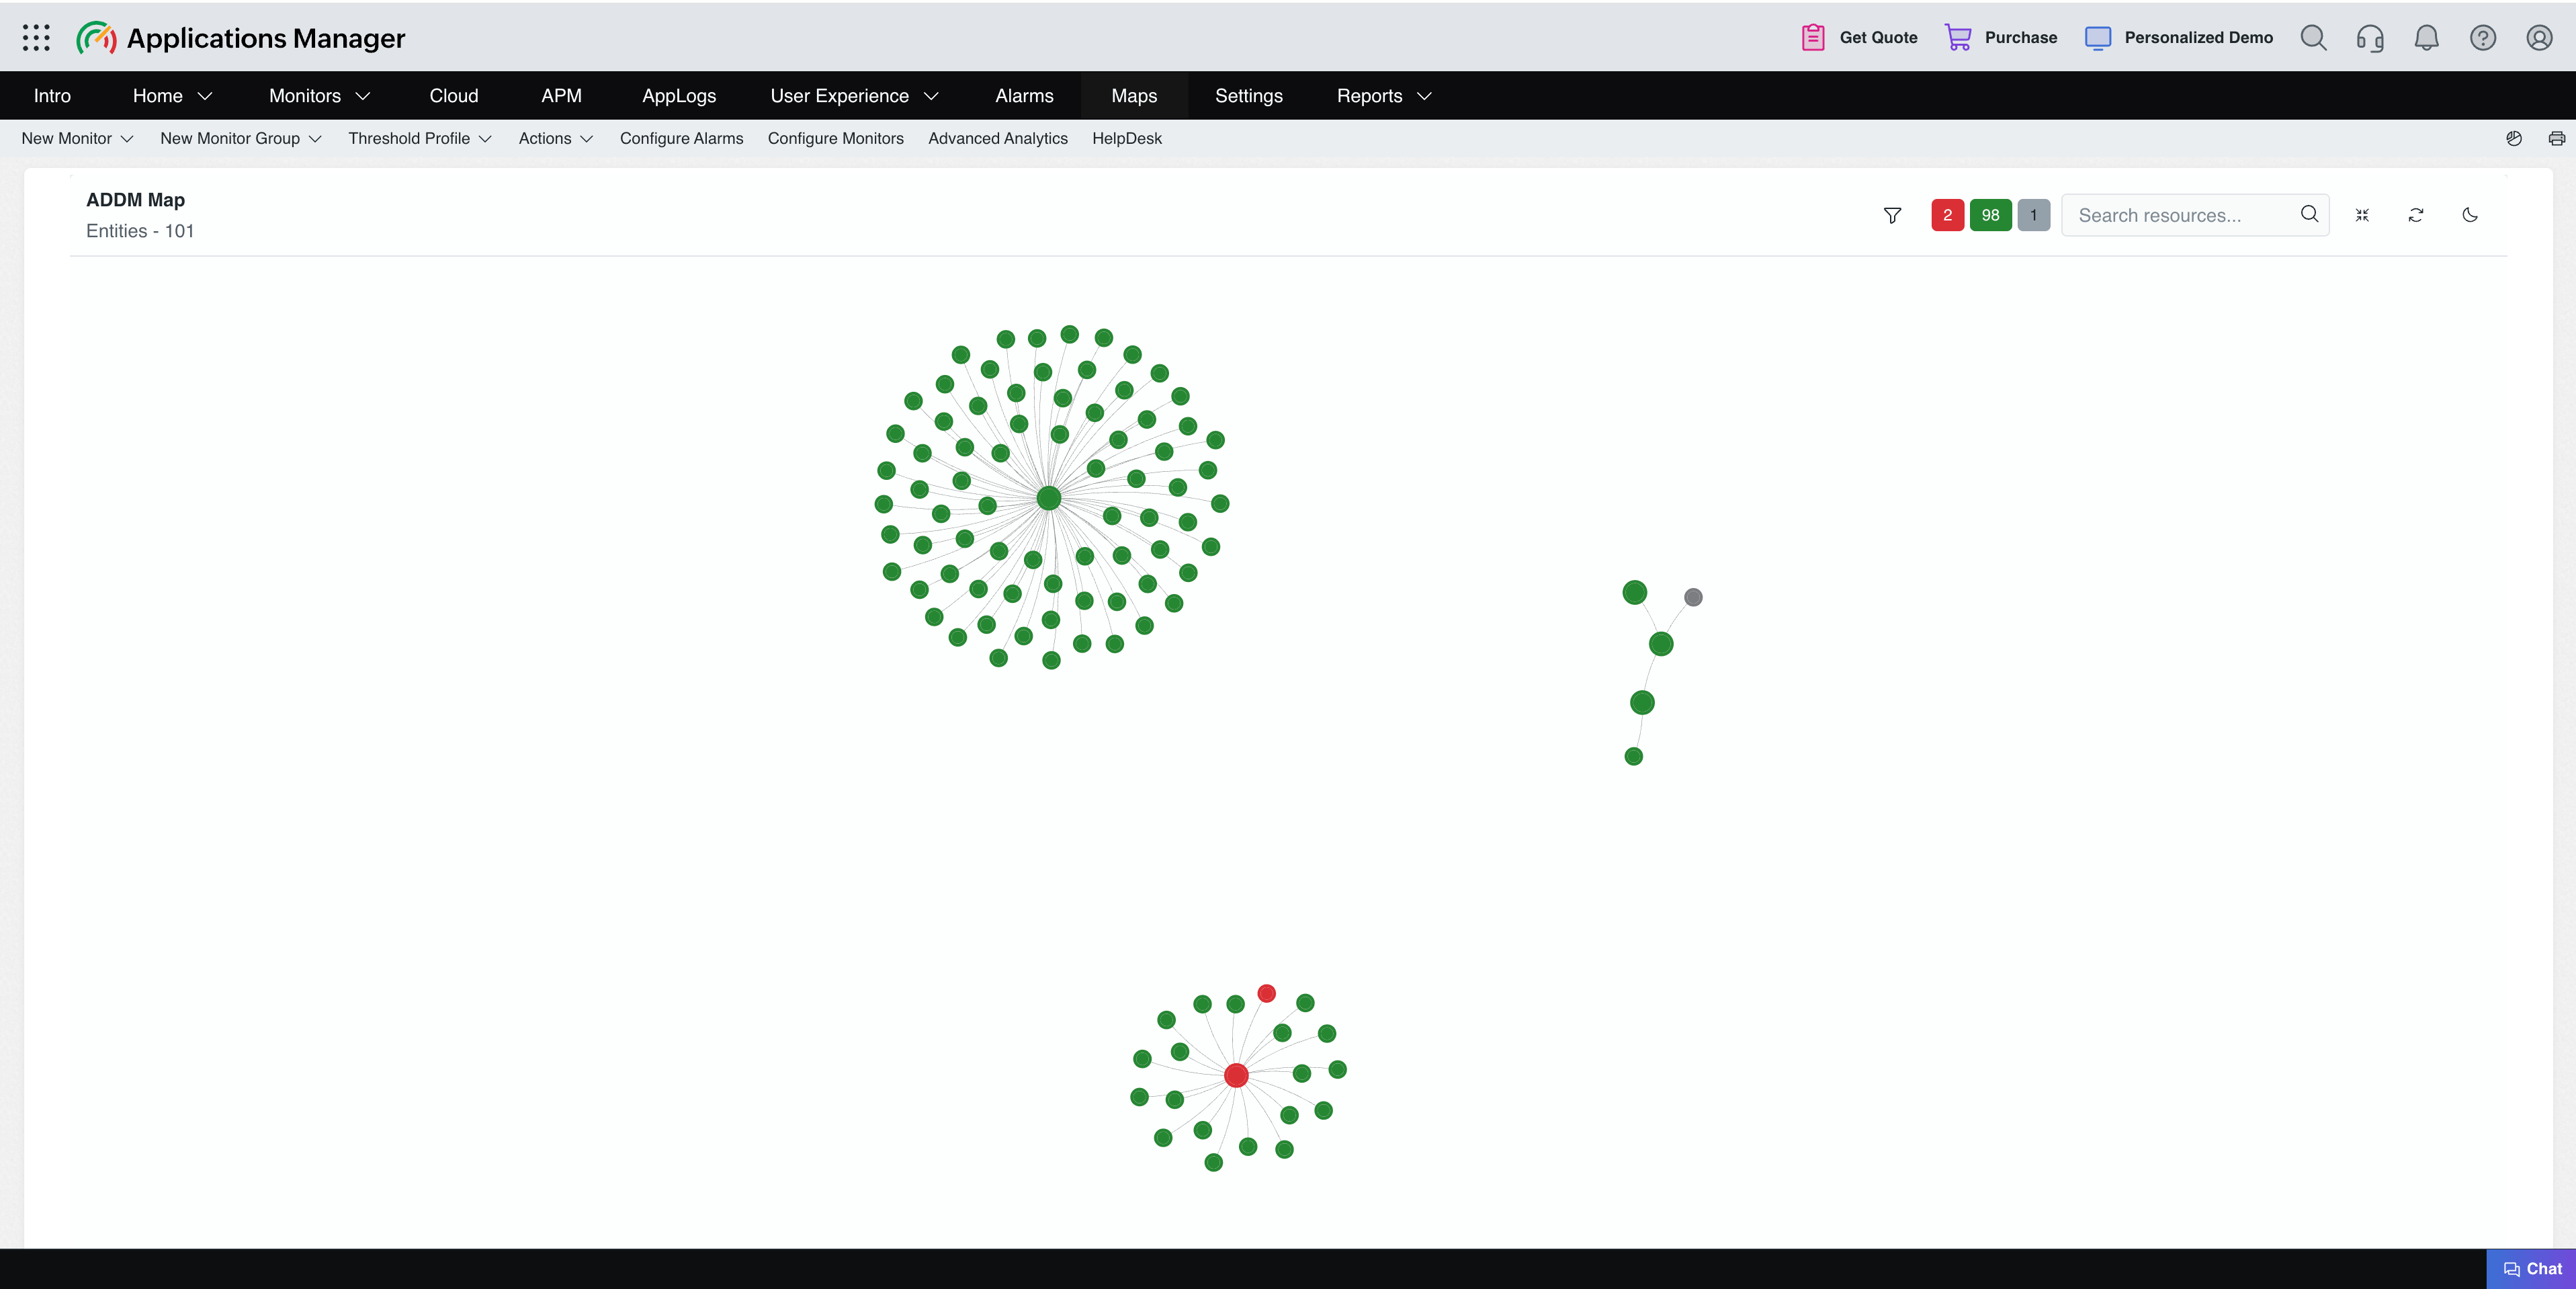
To view the ADDM Map, go to Maps. The ADDM Map opens with the discovered entities and their relationships displayed on the map canvas.
Map components
The ADDM Map includes the following components and controls:
- Map canvas: Displays discovered entities as nodes and their relationships as connecting lines.
- Resource status: The status indicator on each node helps you identify the current state of the resource.
- Filters: Use filters to narrow the resources displayed on the map by severity or monitor group.
- Severity-based filters: Filter resources by severity to focus on entities requiring attention.
- Monitor group-based filters: Filter resources by monitor group to focus on related monitored components.
- Resource search: Search for a resource using its hostname or IP address. When you search by IP address, the matching resource is highlighted on the map.
- Fit to view: Adjusts the map so the available entities fit within the map canvas.
- Rescan relationships: Select the sync icon to refresh the relationships and reload the map manually.
- Theme: Switch between the available light and dark map themes.
Viewing resource details
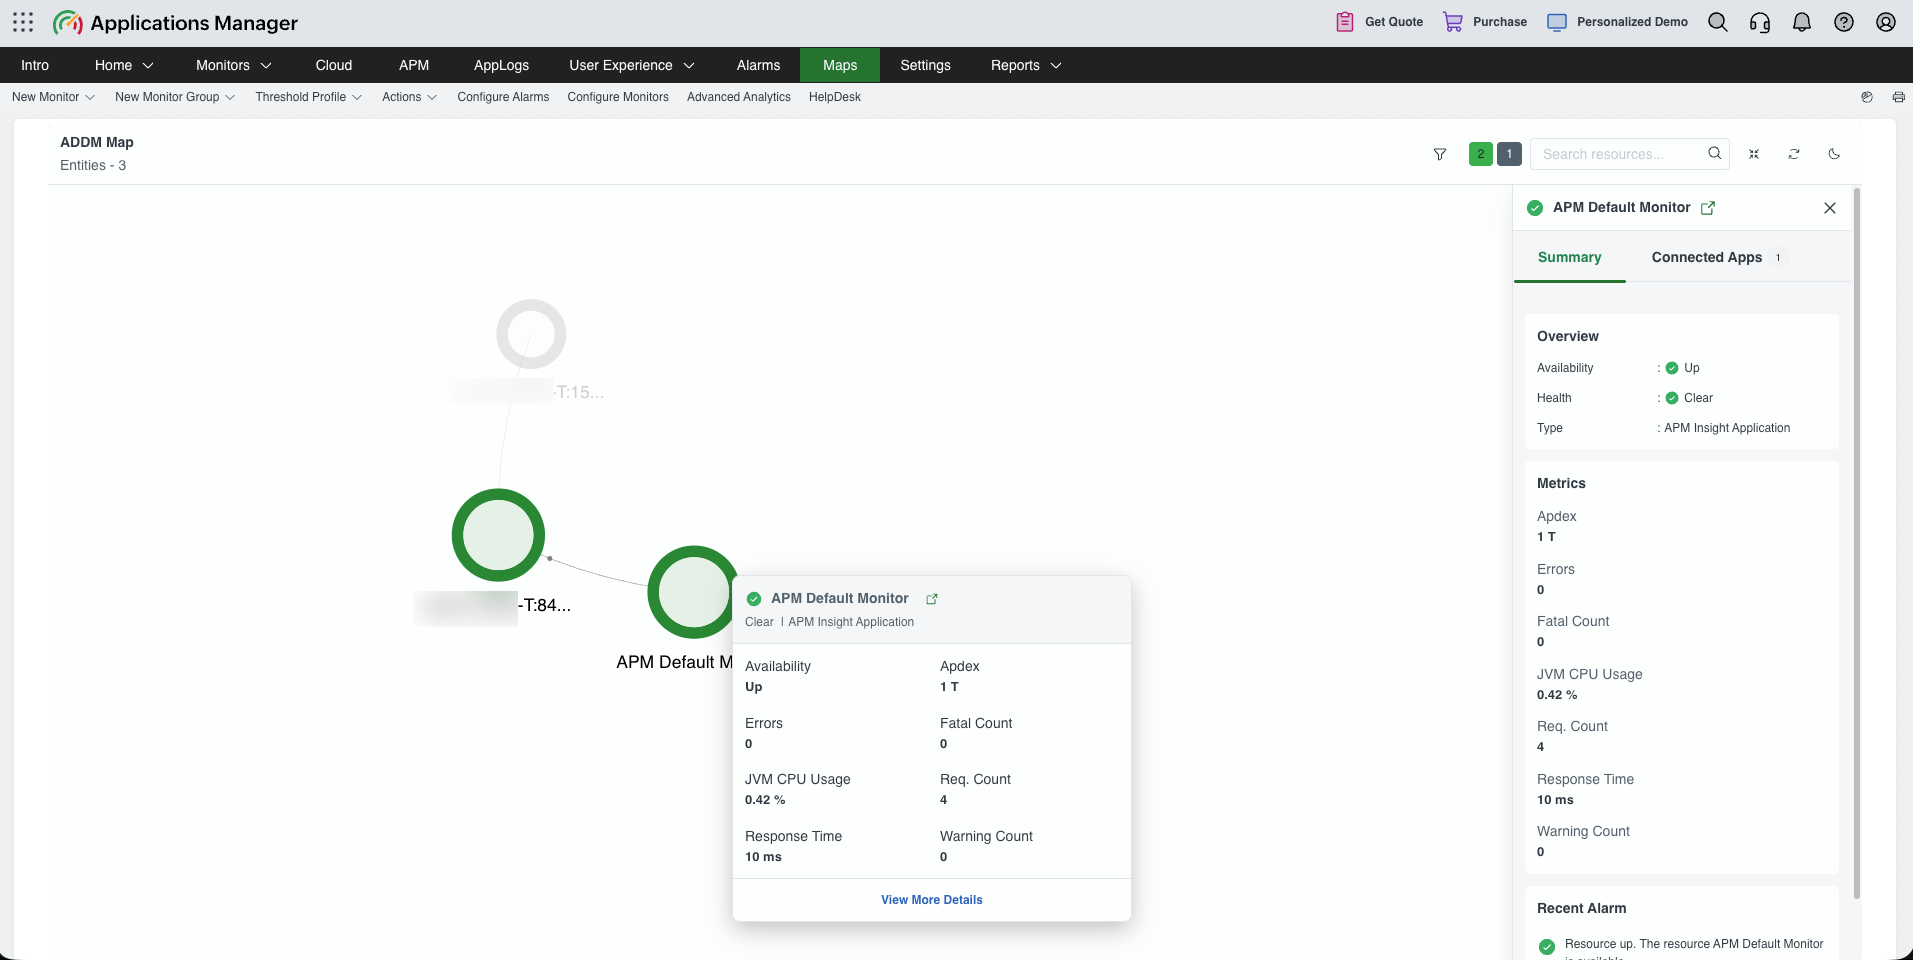
Hover over a resource to view a summary of its status, type, and available metrics. Select View More Details in the summary to open the resource details. The hover popup also includes Jump to Monitor Details, which opens the corresponding monitor details page.
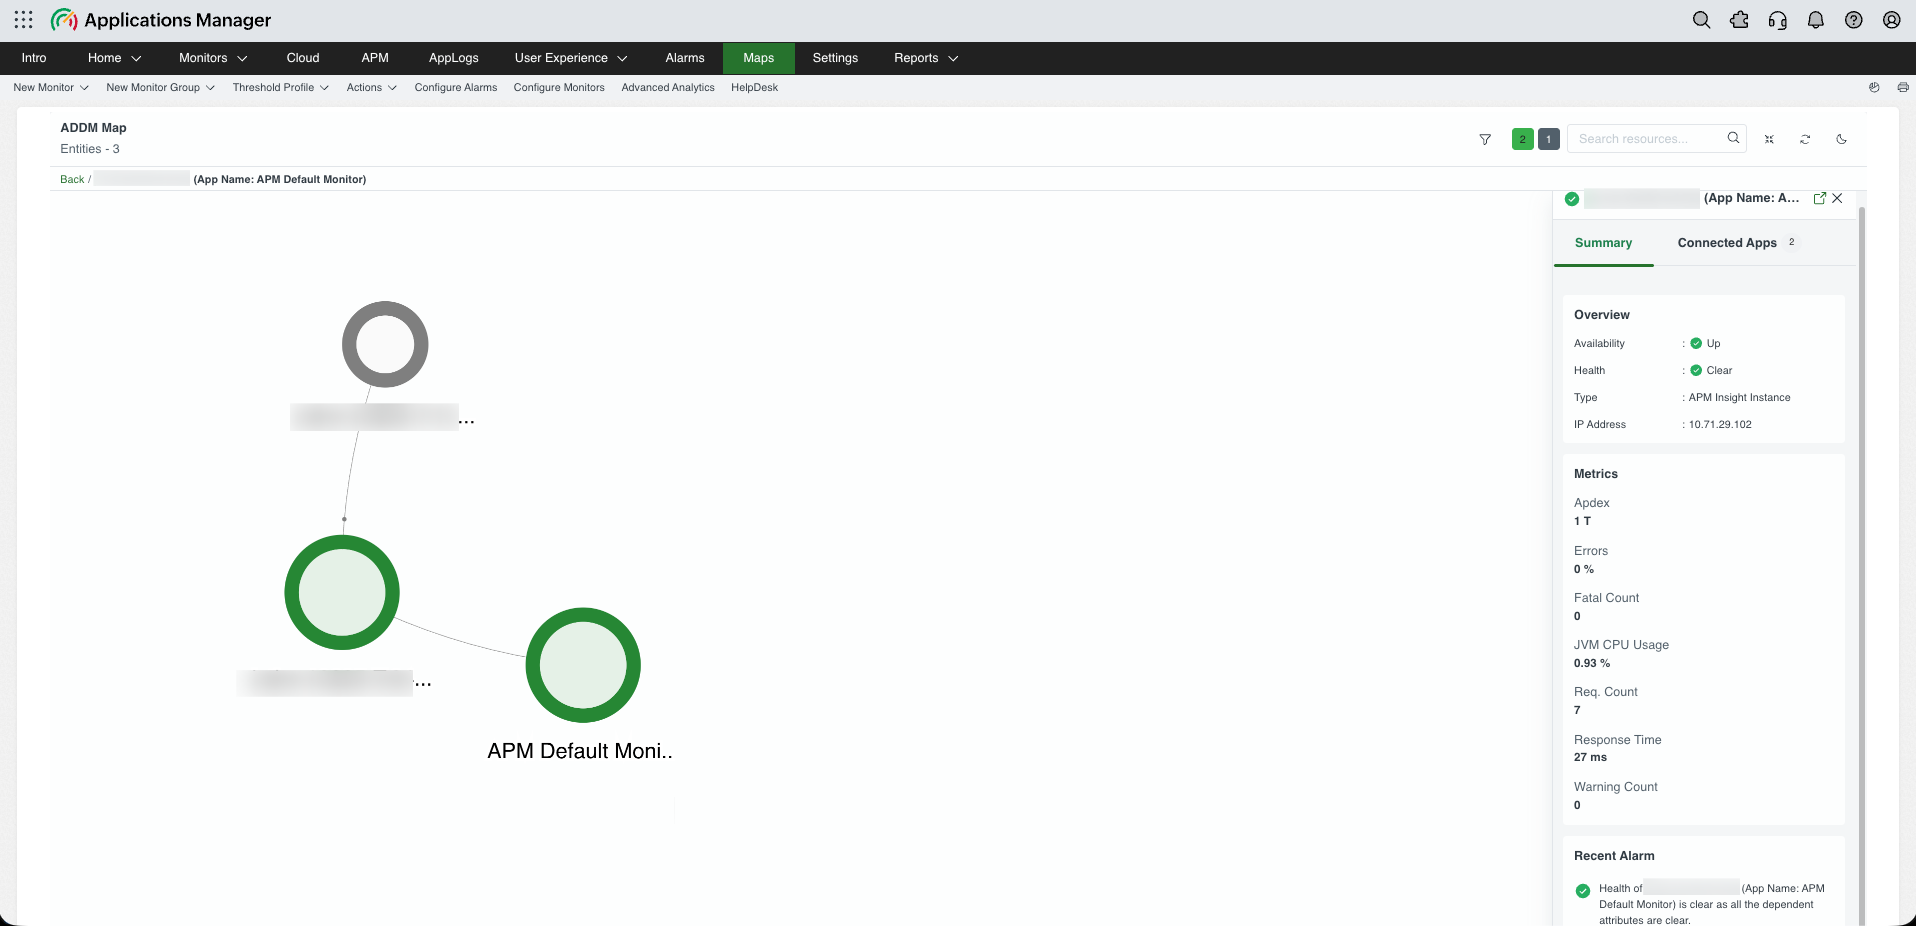
When you select a resource, Applications Manager opens a details panel on the right. The panel includes the Summary and Connected Apps tabs and also provides Jump to Monitor Details for opening the corresponding monitor details page.
Summary
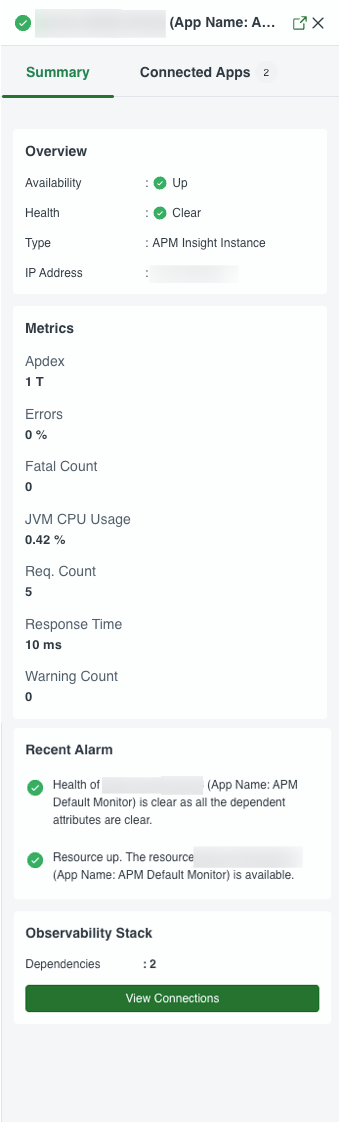
The Summary tab provides the following information for the selected resource:
- Overview: Displays the availability, health, resource type, and IP address.
- Metrics: Displays the metrics available for the selected resource, such as Appdex, errors, fatal count, JVM CPU usage, request count, response time, and warning count.
- Recent Alarm: Lists recent alarms associated with the resource.
- Observability Stack: Displays the number of dependencies and provides the View Connections option.
Connected Apps
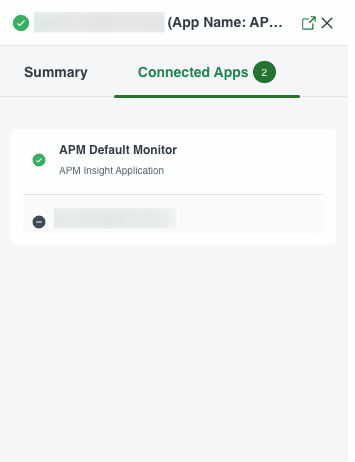
The Connected Apps tab lists the applications connected to the selected resource. Each entry includes the application name and type, helping you understand the applications associated with that resource.
Viewing resource dependencies
To view a resource's dependencies, select the resource and open the Summary tab. In the Observability Stack section, select View Connections. Applications Manager opens a dedicated node view that displays the selected resource and its connected dependencies, helping you trace relationships in detail.
Example use-case
An online store reports slow checkout transactions. The checkout service is connected to inventory and order databases, a payment API, and a cloud message queue.
- Review the map canvas and resource status to understand which checkout components are affected.
- Use severity-based filters to focus on critical resources, then use monitor group-based filters to isolate the checkout components.
- Search by hostname or IP address to locate the affected resource, and use the fit-to-view option to see its surrounding relationships clearly.
- Review the resource summary, including availability, health, type, IP address, Appdex, errors, fatal count, JVM CPU usage, request count, response time, warning count, and recent alarms. Use the monitor details link for deeper metric analysis.
- Check the Connected Apps tab to identify applications associated with the affected resource.
- Review the Observability Stack and its dependency count, then open the dedicated connections view to determine whether the delay originates in the application, database, payment API, or message queue.
- Rescan the relationships after a dependency change to confirm the current checkout path. The light or dark theme can be used according to the operator's viewing preference.

