Distributed Tracing
Overview
With Distributed Tracing, you can track transaction traces made from one application to another. This enables you to monitor calls made between applications and narrow down the problem.
Contents:
- What is a trace?
- What is distributed tracing?
- Prerequisites to enable Distributed Tracing
- How Distributed Tracing works?
- Viewing the data
- Metrics and Inference
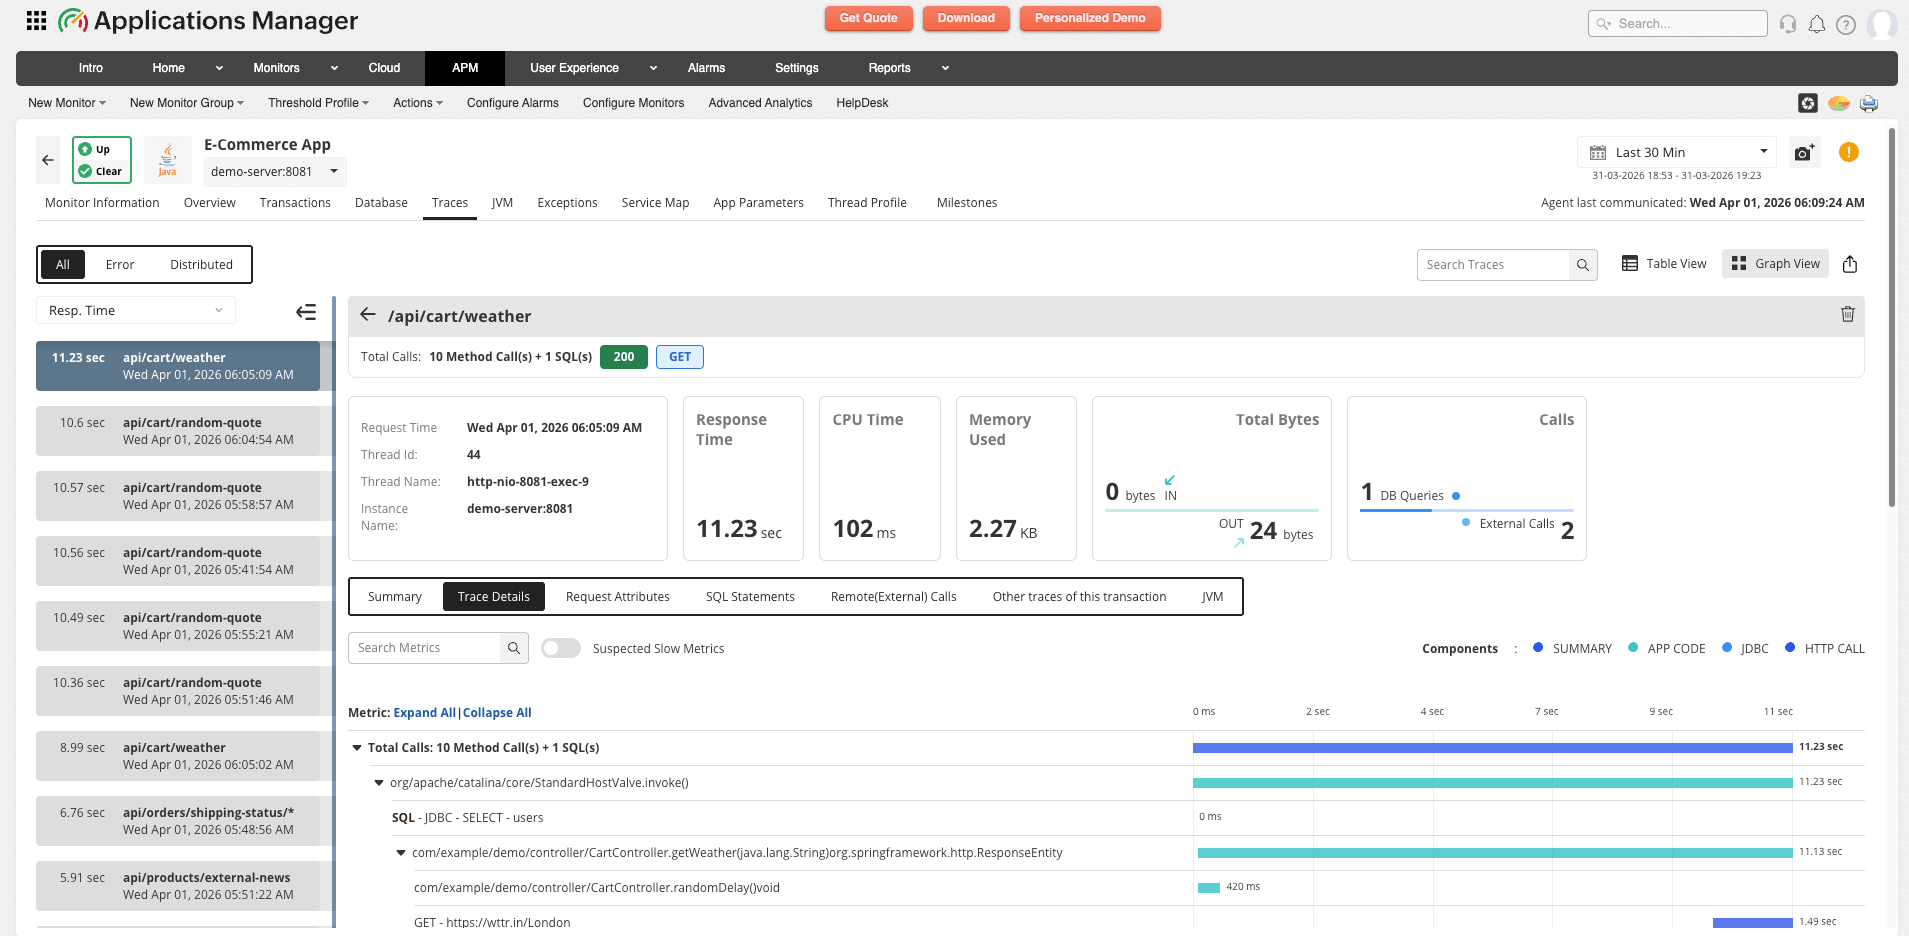
What is a trace?
A trace is the execution flow of a transaction, including its method calls, database queries, and exceptions. When a transaction exceeds the specified threshold value, it's captured as a trace.
What is distributed tracing?
Modern applications have evolved from their monolithic ancestry to microservices or distributed systems. Analyzing issues in such environments involves correlating data from multiple services spread across the system, creating an inevitable need for a more sophisticated tracing mechanism to diagnose and troubleshoot issues. Distributed tracing fulfills this need by being able to trace the entire path of a web transaction across application or service boundaries.
Prerequisites to enable Distributed Tracing
- Ensure that you have installed APM Insight agents across all your applications that need to be monitored.
- Make sure your agents are updated to the following versions:
- Java agent version 4.9.0
- .NET agent version 4.8.0
- Node.js agent version 1.7.2
- PHP agent version 3.2
- Python agent version 1.5
Note:
- Distributed Tracing can be viewed only for applications under the same account. If your applications are spread over various accounts, you cannot have a consolidated view of all your traces across all your accounts.
- To enable Distributed Tracing in PHP agent, make sure to add the key zpa.capture_distributed_trace=1 in php.ini file of PHP framework.
How Distributed Tracing works?
- When an application or service makes an API request to another application or service, Applications Manager's APM Insight adds an HTTP header containing the metadata required to track the service request.
- If Applications Manager's APM Insight is enabled in the other corresponding service, it will process the HTTP header and return the tracking information to its caller via the response headers.
- If the other service in turn calls another service, the header propagation continues, thus tracing all paths taken by the original application or service across the distributed system.
Note:
- Traces are captured only when the request exceeds the defined threshold level in any of the services.
- If your application uses any proxy service, ensure that the corresponding keys X-Site24x7-Id and X-Site24x7-DT-Data are added to request and response headers in order for the agent to track the transaction.
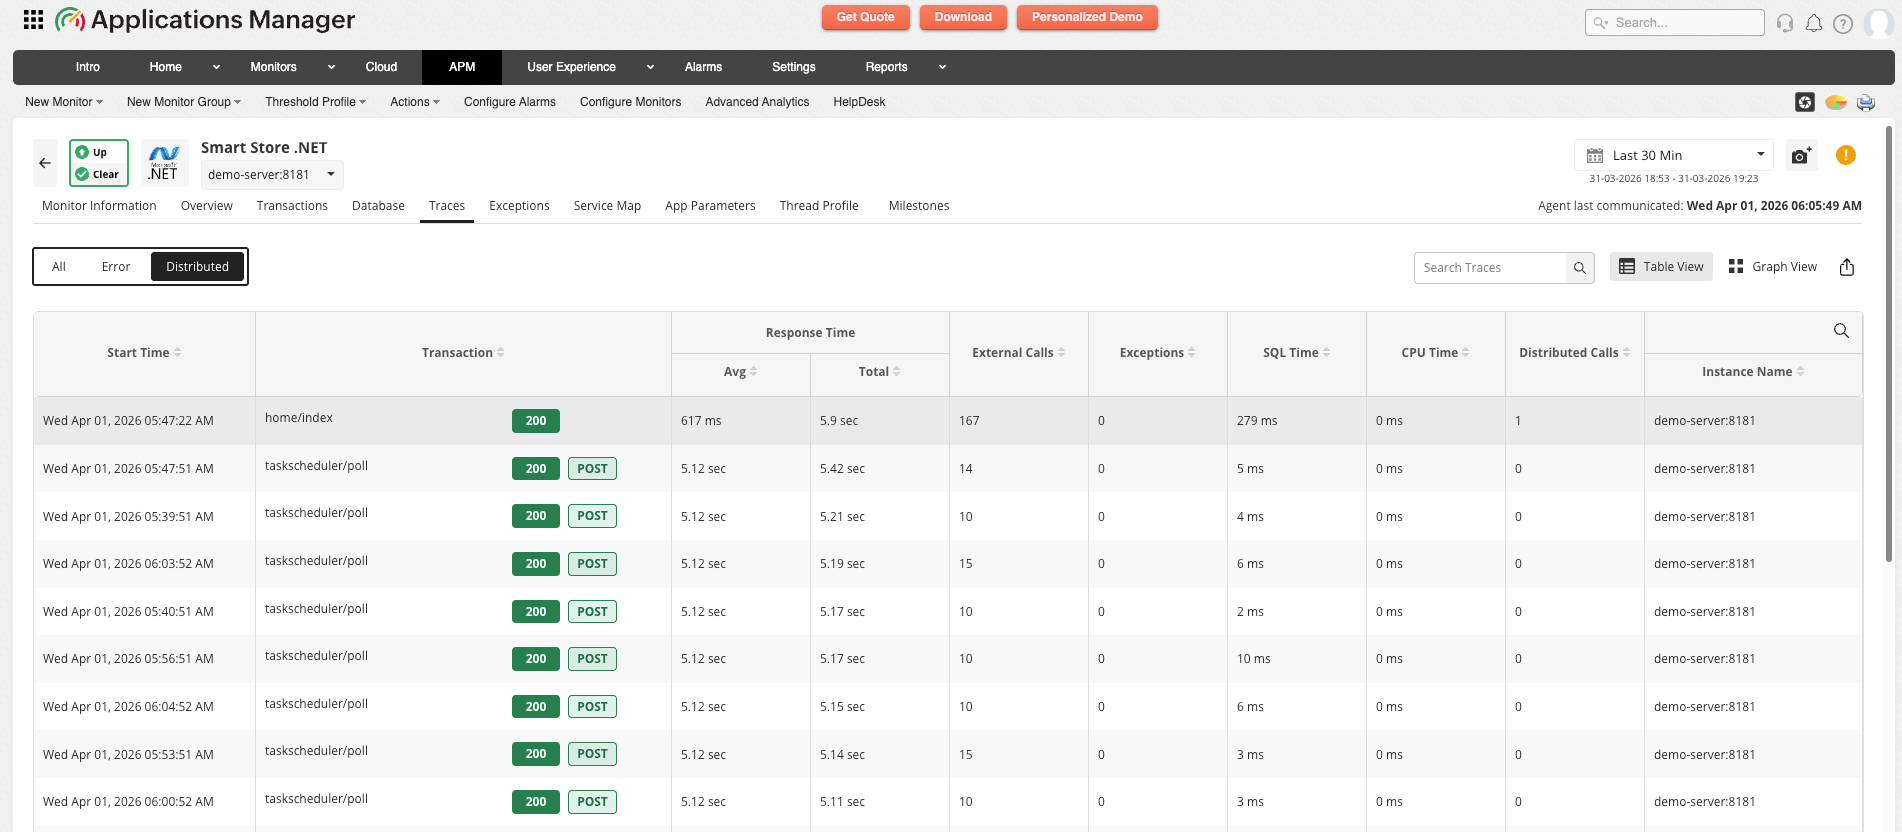
Viewing the data
To view distributed traces, follow the steps below:
- Log in to your Applications Manager account → APM → Your applications.
- Click on the respective application and navigate to the Traces tab.
- Upon clicking on the Distributed tab, you can see the list of traces that flow to other applications and the corresponding transactions.
- Click on the required trace shown in the table to view the whole picture of it.
Metrics and inference
The Traces tab provides various metrics to help you analyze the results of the trace. Under normal circumstances, these transaction traces are viewed separately without context. With Distributed Tracing, you can understand precisely the method calls requested by a transaction from a particular application, and how it has exceeded the threshold level. This simplifies your debugging process.
For more information on the metrics captured in the Traces tab, refer here.