Agent Performance Report for APM Insight .NET Agent
- Test Environment
- Impact on Application Response Time
- Impact on CPU usage
- Impact on Memory consumption
- Impact on Network usage
- Supported Environments
Test Environment
- OS: Windows 2012 R2
- CPU: Single core, Shared
- Memory: 1.75 GB
- IIS version: 8.5
- Version: .NET 4.0
- Duration of test: 2 hrs
- Avg no of requests per min: 500
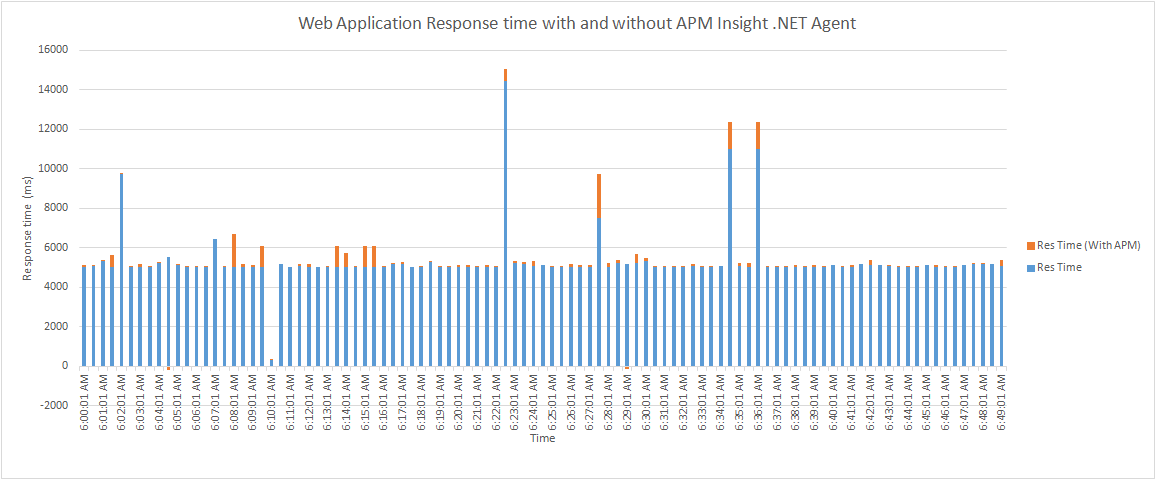
Impact on application's Response Time
The APM Insight .NET Agent only instruments framework methods by default, and hence the overhead on response time is minimal. On an average, the response time variation due to the agent is around 30 ms. The response time variation during peak response times was around 500 ms. The same is summarized below:
| RESPONSE TIME SUMMARY | Without Agent | With Agent |
|---|---|---|
| Average Response time (ms) | 4820.85 | 4853.21 |
| Peak Response time (ms) | 14465 | 15079 |
The timeline chart below explains the historic trend:
Impact on CPU usage
With the default production settings, the APM Insight .NET Agent does not consume more than 5~10 % CPU on average (using default production settings). The CPU usage depends mainly on the number of methods instrumented (using custom instrumentation) and the log level (default is CRITICAL). The maximum consumption will be during the application startup or domain creation, since it involves initializing profiler and loading .NET Agent's libraries. Once initialized, the average overhead due to .NET Agent, remains at around 5% in addition to the normal CPU usage of the web application.
| CPU Usage | Without Agent | With Agent |
|---|---|---|
| Average usage (%) | 32.78 | 39.58 |
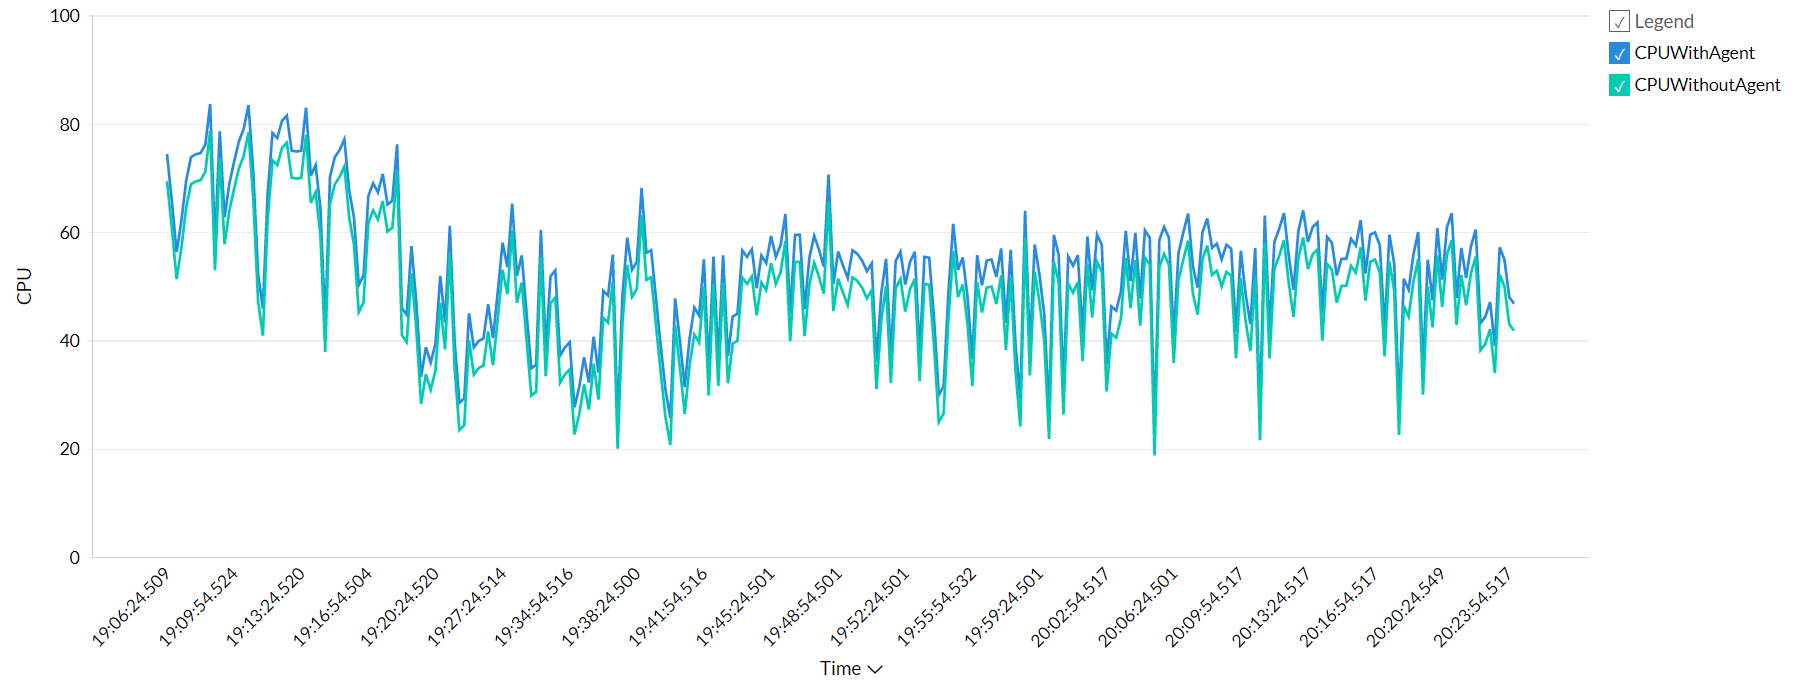
Note: The agent load on CPU consumption was tested on OS version - Windows Server 2016 and is effective from APM Insight .NET agent version 5.3
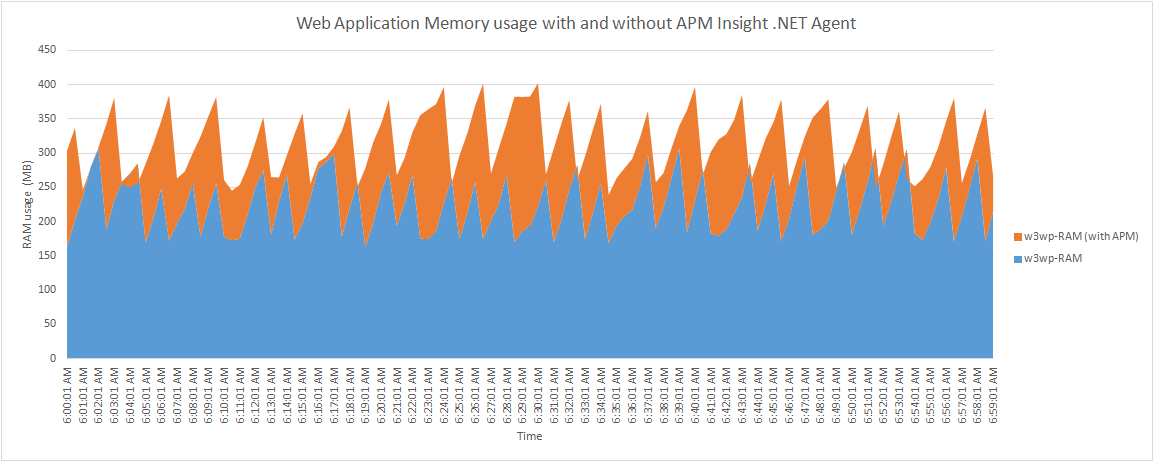
Impact on Physical Memory (RAM) usage
The APM Insight .NET Agent by default collects performance data and pushes it to its own service, every minute, and hence, the footprint on the user memory is minimal, and only transient. The important thing to note here is that the memory consumption is directly proportional to the number of data collected in a minute, and so, decreasing the sampling factor or transaction trace threshold comes at a cost of increased RAM usage. However, with the default production settings, (sampling factor=5, trace threshold=2 sec, sql trace threshold=3 sec) the memory will not exceed 90 MB, even during peak load. The below table summarizes the details.
| MEMORY USAGE | Without Agent | With Agent |
|---|---|---|
| Average Working Set (MB) | 228.11 | 292.56 |
| Peak Working Set (MB) | 314.81 | 390.62 |
Impact on Network usage
APM Insight .NET Agent collects and sends data to the Applications Manager servers once every minute. The data collected is sent in 2 requests, as
- arh/data - for apdex and response time metrics. The maximum size of this request is around 40 KB.
- arh/trace - for stack trace and exception metrics. The maximum size of this request is around 4 MB.
It is to noteworthy to mention that the amount of data sent depends on the number of unique web transactions and errors that occur within 1 minute, up to a maximum of 250 transactions. With an average load of 500 requests per minute, with an APDEX of 0.975 and an average error rate of 2%, the average network usage is around 800 kb per minute.
Supported Environments
All APM Insight .NET agents support the following environments:
- Windows Server 2003 and above
- IIS 7.0 and above
- .NET 4.0 and above
