Java Agent Configuration Options
The APM Insight Java agent provides configuration options to control transaction tracking, trace collection, data capture, and other monitoring settings. You can modify these settings either through the Web Client or directly in the apminsight.conf file. This page describes the available settings, their configuration keys, and their default values.
Configuring settings through the Web Client
You can modify the Java agent configuration settings from the APM Insight agent configuration profile in the Web Client. Use the edit option to view and update the available settings.
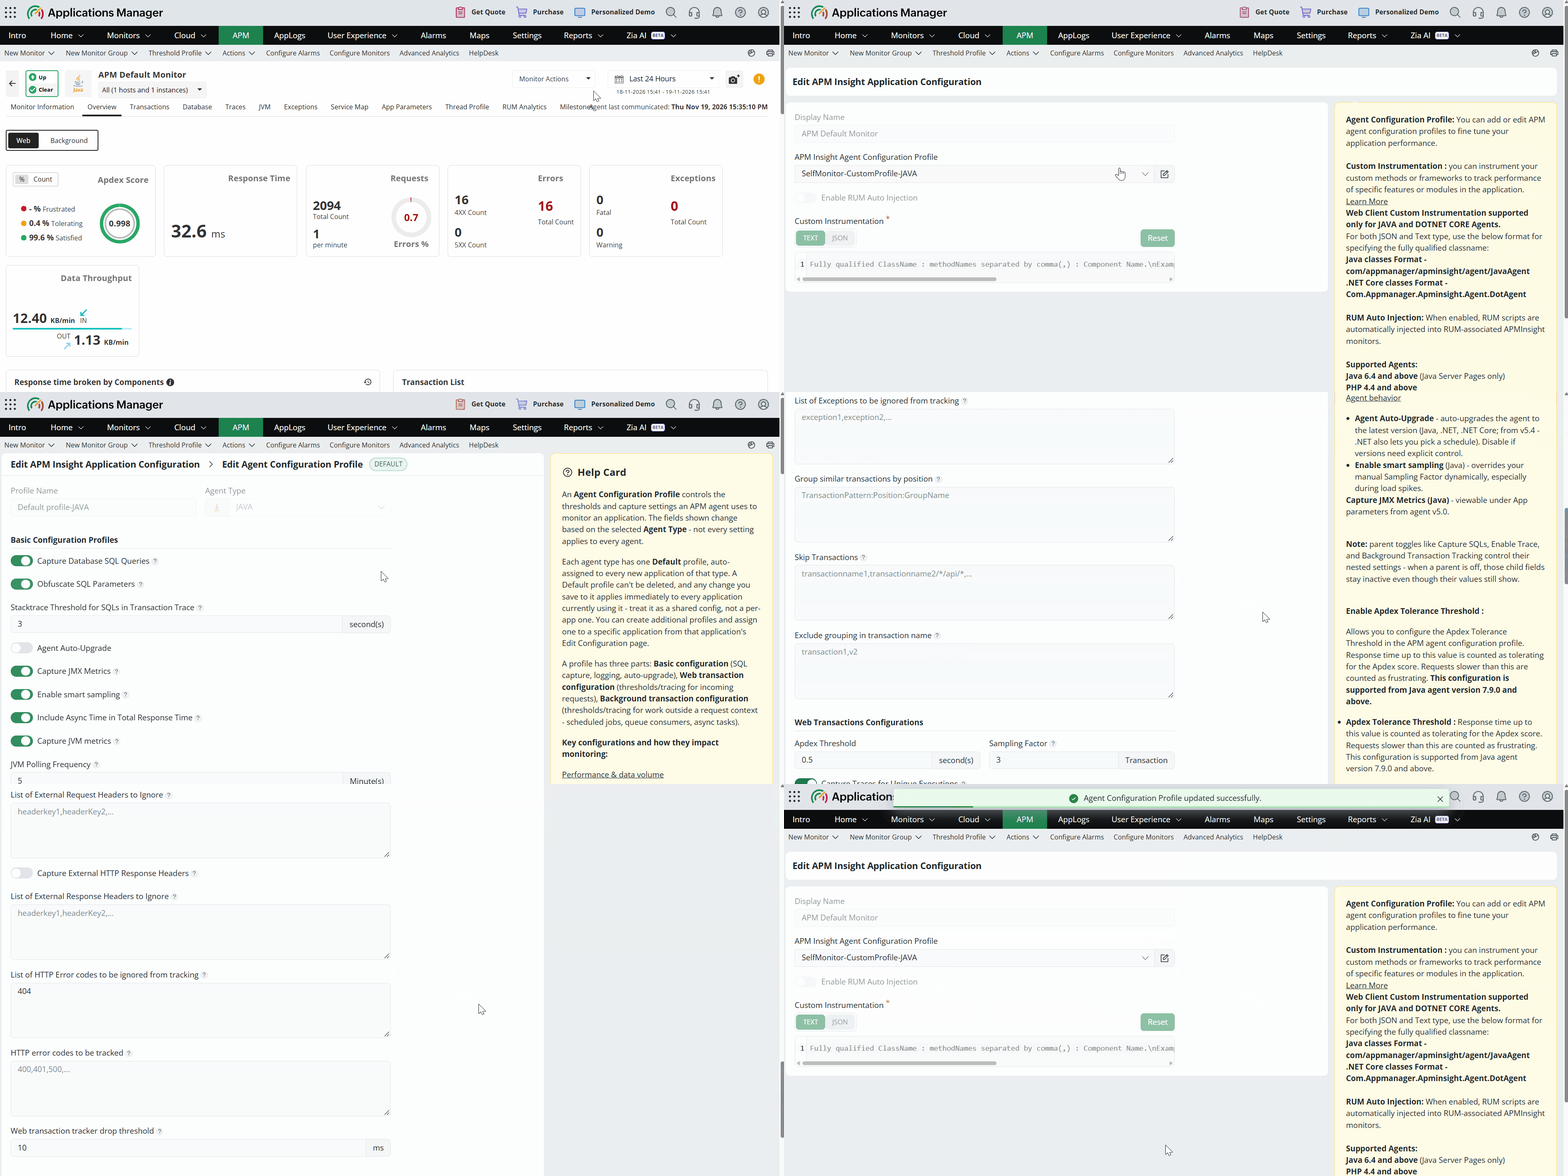
The configuration settings are grouped into the following sections:
- Basic configuration settings
- Web transaction settings
- Background transaction settings
- Settings available only in apminsight.conf
Note: A red asterisk (*) indicates that the corresponding default value applies to Applications Manager versions later than 16470.
Basic configuration settings
| Name | Key | Description | Default value |
|---|---|---|---|
| Capture database SQL Queries | sql.capture.enabled |
| True |
| Obfuscate SQL Parameters | transaction.trace.sql.parametrize |
| True |
| Stack trace threshold for SQL queries in transaction traces | transaction.trace.sql.stacktrace.threshold |
| 3 seconds |
| Display instance port number | show.instance.port.number |
| True |
| Logging level | apminsight.log.level |
| INFO |
| List of URL extensions to be skipped from tracking | transaction.skip.listening |
| *.css, *.js, *.gif, *.jpg, *.jpeg, *.bmp, *.png, *.ico |
| List of exceptions to be skipped from tracking | exceptions.ignore |
| None |
| Skip Transactions | transaction.skip.patterns |
| None |
| Show Method Description in Traces |
| True | |
| Enable Loop detection | transaction.trace.track.loop | When enabled, the agent captures loops running in the application. | false |
| Enable Smart Sampling | smart.sampler.enabled | When enabled, the agent automatically adjusts the sampling factor based on the Java process's CPU and memory consumption. | true |
| Include Async in Total Response Time | rt.include.async.time | When enabled, the response times of asynchronous calls are included in the transaction's total response time. | true |
| Capture JVM Metrics | capture.jvm.metrics | When enabled, the agent collects Java Virtual Machine (JVM) performance metrics. | true |
| Exclude Grouping in Transaction Names | transaction.keyword.skip.grouping |
| None |
| JVM polling frequency | jvm.polling.interval | Frequency (in minutes) at which JVM metrics are collected by the agent. | 5 minutes |
Web transaction settings
| Name | Key | Description | Default value |
|---|---|---|---|
| Transaction performance and sampling | |||
| Apdex Threshold | apdex.threshold |
| 0.5 seconds |
| Sampling factor | transaction.tracking.request.interval |
| 1 request or 10 requests* |
| Transaction tracing | |||
| Enable transaction tracing | transaction.trace.enabled |
| True |
| Transaction tracing threshold | transaction.trace.threshold |
| 2 seconds or 5 seconds* |
| Capture trace if external calls exceeds | webtransaction.trace.external.components.count.threshold |
| 50 calls |
| Capture traces for unique executions | transaction.trace.unique.execution |
| FALSE |
| Capture CPU time per transaction | webtransaction.record.cputime.enabled |
| True |
| Capture memory allocation per transaction | webtransaction.record.memory.allocation.enabled |
| 2 (seconds) |
| HTTP request data | |||
| Capture HTTP parameters | webtransaction.trace.input.params.record |
| False |
| List of HTTP parameters to ignore | webtransaction.trace.input.params.ignore |
| password, pswd, pass, authKey, parentId, parentID, resourceId, resourceID, id, ID |
| List of HTTP error codes to be ignored from tracking | http.errors.ignore |
| None |
| List of HTTP error codes to be tracked | http.errors.track |
| None |
| Capture HTTP bytes | capture.http.network.bytes |
| True |
| Transaction grouping and filtering | |||
| Web Transaction Tracker Drop Threshold | webtransaction.tracker.drop.threshold |
| 10 milliseconds |
| Group similar transactions by position | transaction.grouping.by.position |
| None |
| HTTP headers and external call data | |||
| Capture HTTP request headers | webtransaction.trace.request.headers.record |
| False |
| Capture HTTP response headers | webtransaction.trace.response.headers.record |
| FALSE |
| List of HTTP Response Headers to be ignored | webtransaction.trace.response.headers.ignore |
| password, pswd, pass, authKey, parentId, parentID, resourceId, resourceID, id, ID |
| Capture external call request headers | webtransaction.trace.ext.request.headers.record |
| FALSE |
| List of External Request Headers to be ignored | webtransaction.trace.ext.request.headers.ignore |
| password, pswd, pass, authKey, parentId, parentID, resourceId, resourceID, id, ID |
| Capture external call response headers | webtransaction.trace.ext.response.headers.record |
| FALSE |
| List of External Response Headers to be ignored | webtransaction.trace.ext.response.headers.ignore |
| password, pswd, pass, authKey, parentId, parentID, resourceId, resourceID, id, ID |
Background transaction settings
| Name | Key | Description | Default value |
|---|---|---|---|
| Track background transactions | bgtransaction.tracking.enabled |
| True |
| Capture background transaction traces | bgtransaction.trace.enabled |
| True |
| Transaction trace threshold | bgtransaction.trace.threshold |
| 5 seconds |
| Capture trace if external calls exceeds | bgtransaction.trace.external.components.count.threshold |
| 50 calls |
| Capture CPU time per transaction | bgtransaction.record.cputime.enabled |
| False |
| Capture memory allocation per transaction | bgtransaction.record.memory.allocation.enabled |
| True |
| Sampling factor | bgtransaction.tracking.request.interval |
| 1 request |
Settings available only in apminsight.conf
The following settings are available only in the apminsight.conf file and cannot be modified through the Web Client.
| Name | Key | Description | Default value |
|---|---|---|---|
| Application Name | application.name |
| True |
| Capture traces | license.key |
| none |
| Configure Proxy | behind.proxy |
| False |
| Host details | apm.host |
For a failover setup, specify both the primary and secondary host details in the apm.host field. For example: apm.host=https://primary-server:8443,https://secondary-server:8443. | None |
| Agent Server Port | agent.server.port |
| 80 |
| APM Directory path | apminsight.log.dir |
|