APM Insight Agent Configuration Profile
You can fine-tune your application monitoring by modifying the APM Insight agent configuration profile. The APM Insight agent configuration profile controls the thresholds and capture settings that an APM Insight agent uses to monitor an application. It enables you to set threshold values for key parameters for web and background transactions.
- Adding an agent configuration profile
- Editing an agent configuration profile
- Configuration profiles - Parameters and default values
- Key configurations and how they impact monitoring
Adding an agent configuration profile
To create an APM Insight agent configuration profile, follow the steps given below:
- Log in to your Applications Manager account.
Navigate to Settings → Discovery & Data Collection → APM Insight Agent Configuration Profile. The APM Insight Agent Configuration Profiles page lists the available profiles.
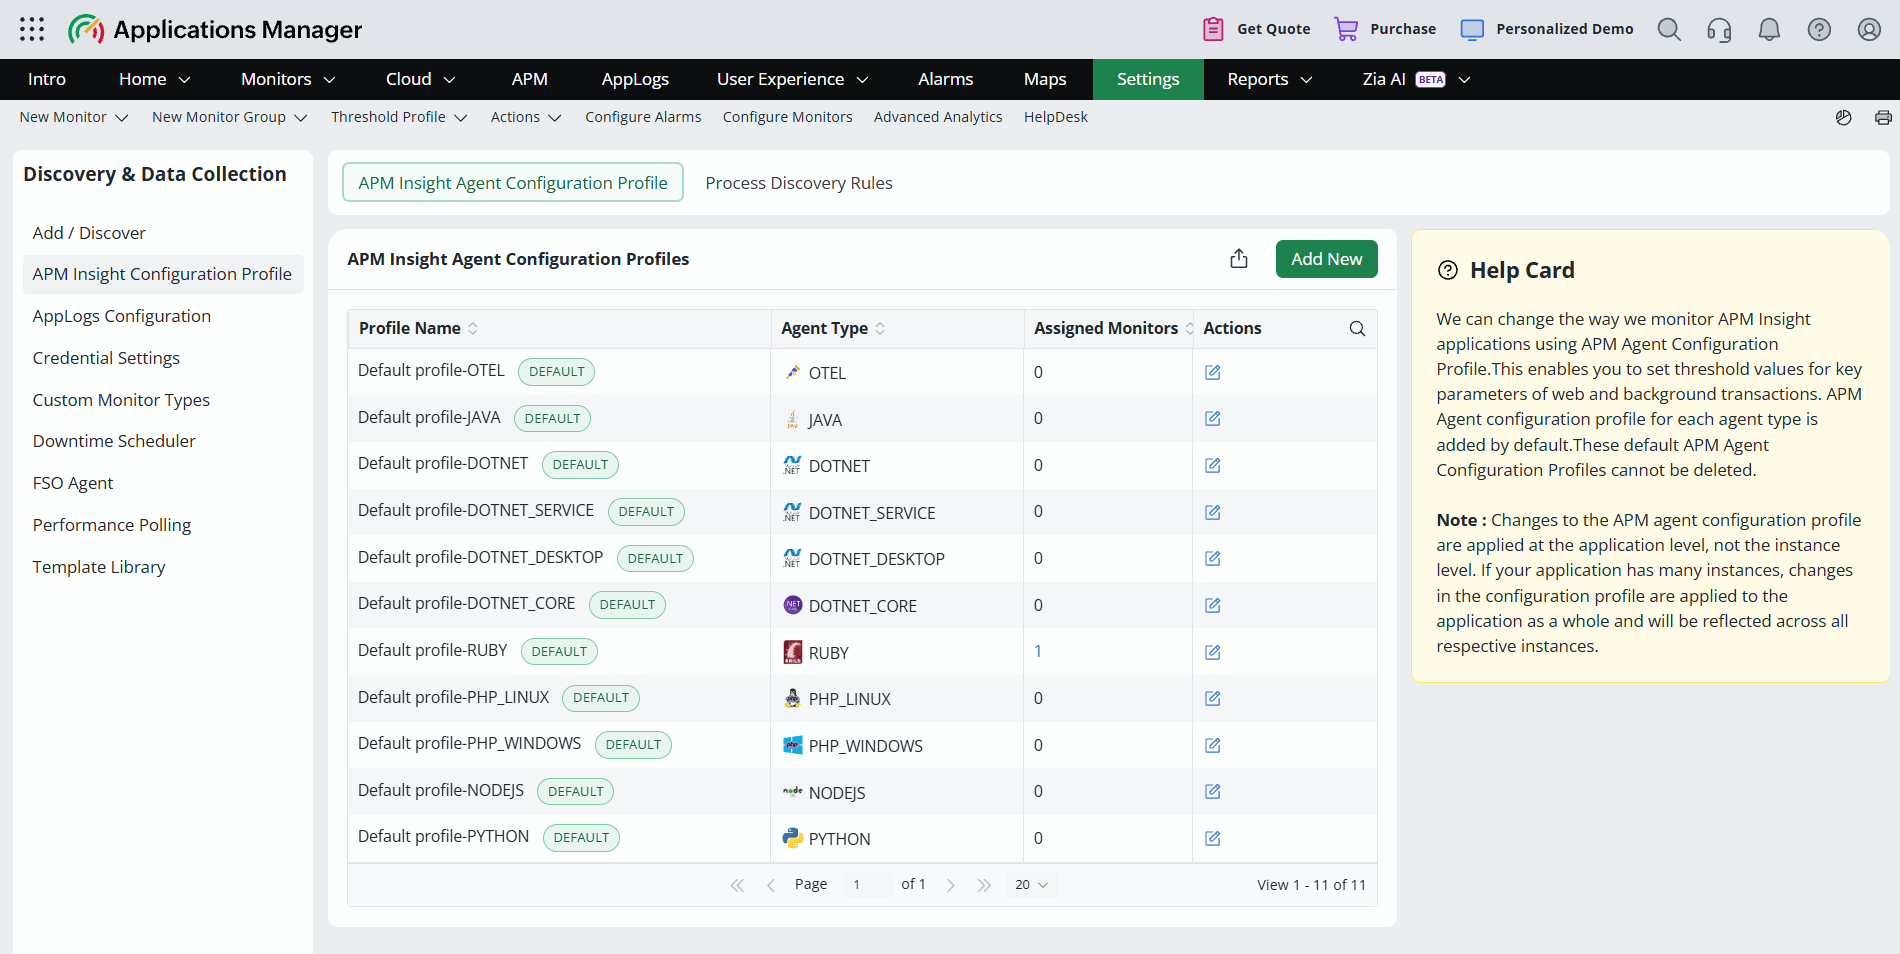
- Click Add New.
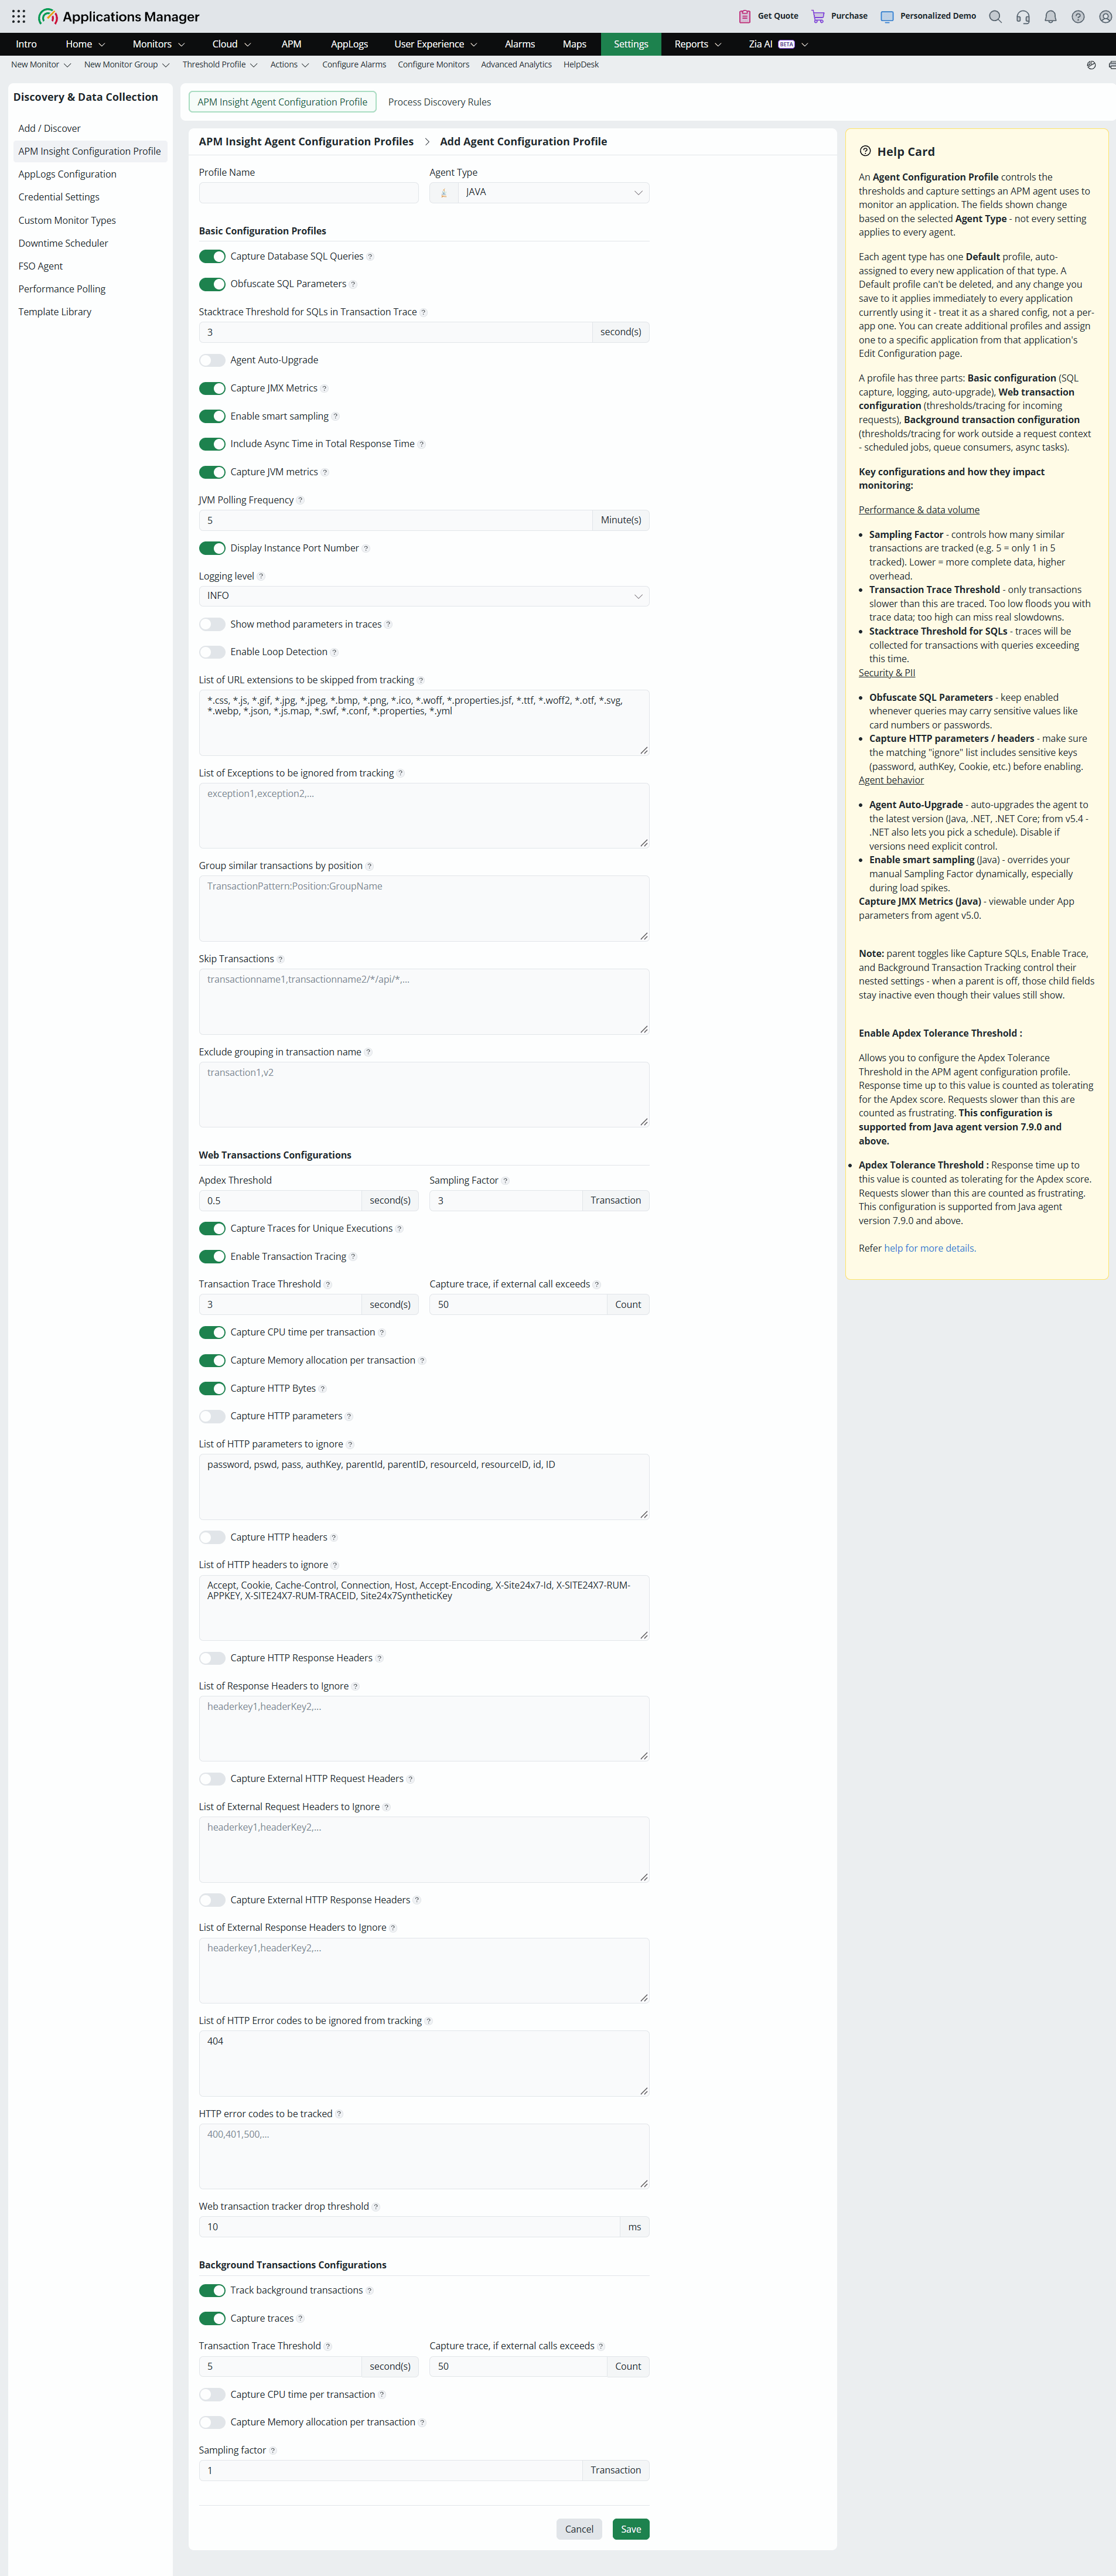
- Enter your Profile Name and choose your Agent Type. The parameters displayed change based on the agent type you select.
Configure the parameters under Basic Configuration Profiles, Web Transaction Configurations, and Background Transaction Configurations.
- Click Save.
The APM Insight Agent Configuration Profiles page displays the following details for each profile:
| Column | Description |
|---|---|
| Profile Name | The name of the profile. Default profiles are marked with a DEFAULT tag. |
| Agent Type | The agent type for which the profile is applicable, such as JAVA, DOTNET, DOTNET_SERVICE, DOTNET_DESKTOP, DOTNET_CORE, RUBY, PHP_LINUX, PHP_WINDOWS, NODEJS, PYTHON, and OTEL. |
| Assigned Monitors | The number of monitors to which the profile is assigned. |
| Actions | Edit a profile using the edit icon. Delete a profile using the delete icon, which is available only for profiles that you create. |
Note:
- Each agent type has one default profile (with default parameter values), which is automatically assigned to every new application of that agent type. Default profiles cannot be deleted.
- Any change you save to a default profile is applied immediately to every application that uses it. Treat the default profile as a shared configuration and not as a per-application one.
- You can create additional profiles with custom parameter values and assign one to a specific application from that application's Edit APM Insight Application Configuration page.
Editing the agent configuration profile
- Navigate to APM Insight → Your application → Edit APM Insight Application Configuration icon.
- In the APM Insight Agent Configuration Profile drop-down, choose the profile for the respective agent type.
- Click Add New to create a new profile.
- Click the edit icon next to the drop-down to modify the selected profile.
- Click Save.
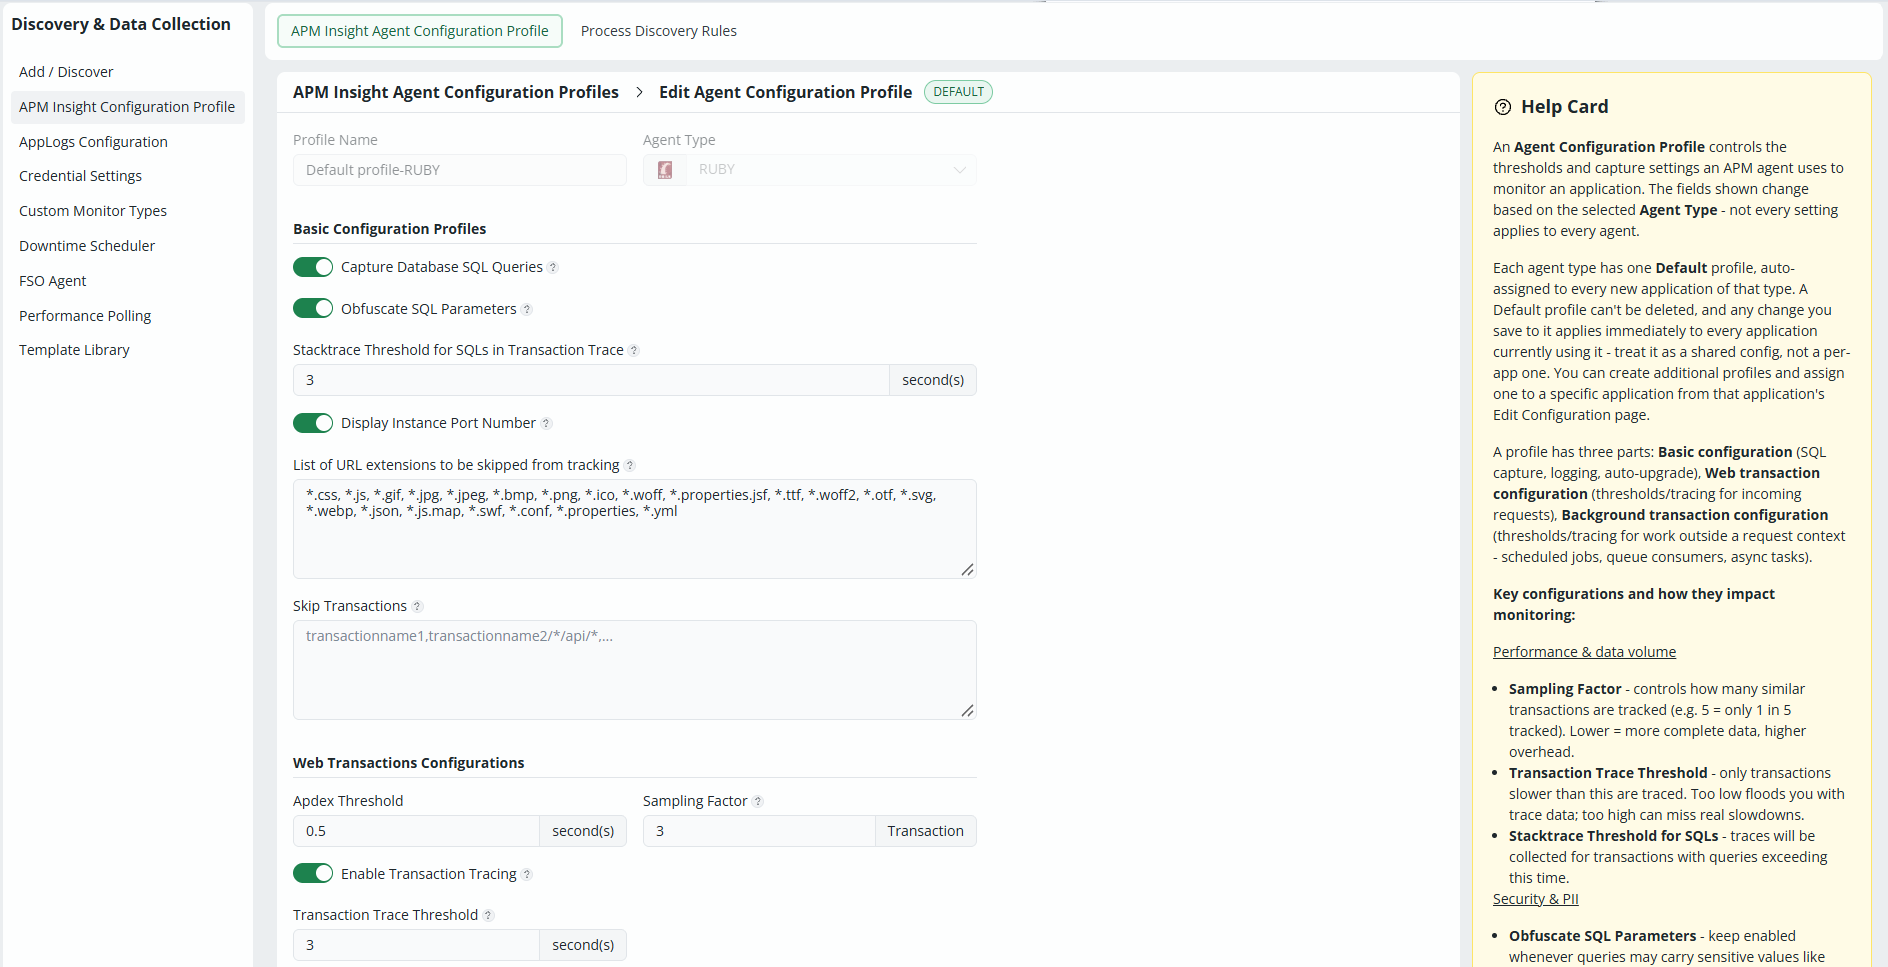
The Edit APM Insight Application Configuration page also lets you configure Autoscale mode, RUM Auto Injection, and Custom Instrumentation for the application.
Configuration profiles - Parameters and default values
The APM agent configuration profile is categorized into three parts: basic configuration profiles (SQL capture, logging, and agent auto-upgrade), web transaction configurations (thresholds and tracing for incoming requests), and background transaction configurations (thresholds and tracing for work outside a request context, such as scheduled jobs, queue consumers, and async tasks). Not every setting applies to every agent type. Click on the following links to view the Agent configuration pages:
- JAVA Agent Configuration
- DOTNET Agent Configuration
- DOTNET Core Agent Configuration
- PHP Agent Configuration
- Node.js Agent Configuration
- Ruby Agent Configuration
- Python Agent Configuration
Key configurations and how they impact monitoring
Performance and data volume
- Sampling Factor: Controls how many similar transactions are tracked. For example, a value of 5 tracks only 1 in 5 transactions. A lower value gives more complete data but a higher overhead.
- Transaction Trace Threshold: Only transactions slower than this value are traced. A very low value floods you with trace data, while a very high value can miss real slowdowns.
- Stacktrace Threshold for SQLs: Traces are collected for transactions with queries that exceed this time.
Security and PII
- Obfuscate SQL Parameters: Keep this option enabled whenever queries may carry sensitive values such as card numbers or passwords.
- Capture HTTP parameters/headers: Before enabling, make sure that the matching ignore list includes sensitive keys such as password, authKey, and Cookie.
Agent behavior
- Agent Auto-Upgrade: Automatically upgrades the agent to the latest version for the Java, .NET, and .NET Core agents. Disable this option if you need explicit control over agent versions.
Loved by customers all over the world

"Standout Tool With Extensive Monitoring Capabilities"
It allows us to track crucial metrics such as response times, resource utilization, error rates, and transaction performance. The real-time monitoring alerts promptly notify us of any issues or anomalies, enabling us to take immediate action.
Reviewer Role: Research and Development

"I like Applications Manager because it helps us to detect issues present in our servers and SQL databases."
Carlos Rivero
Tech Support Manager, Lexmark