APM Insight Java Agent - Context-based monitoring for Java applications
Let's say your application server has three Java applications running on it.
By default, transactions of all applications coming from the same app server are shown collectively under the Web Transactions tab in APM Insight.
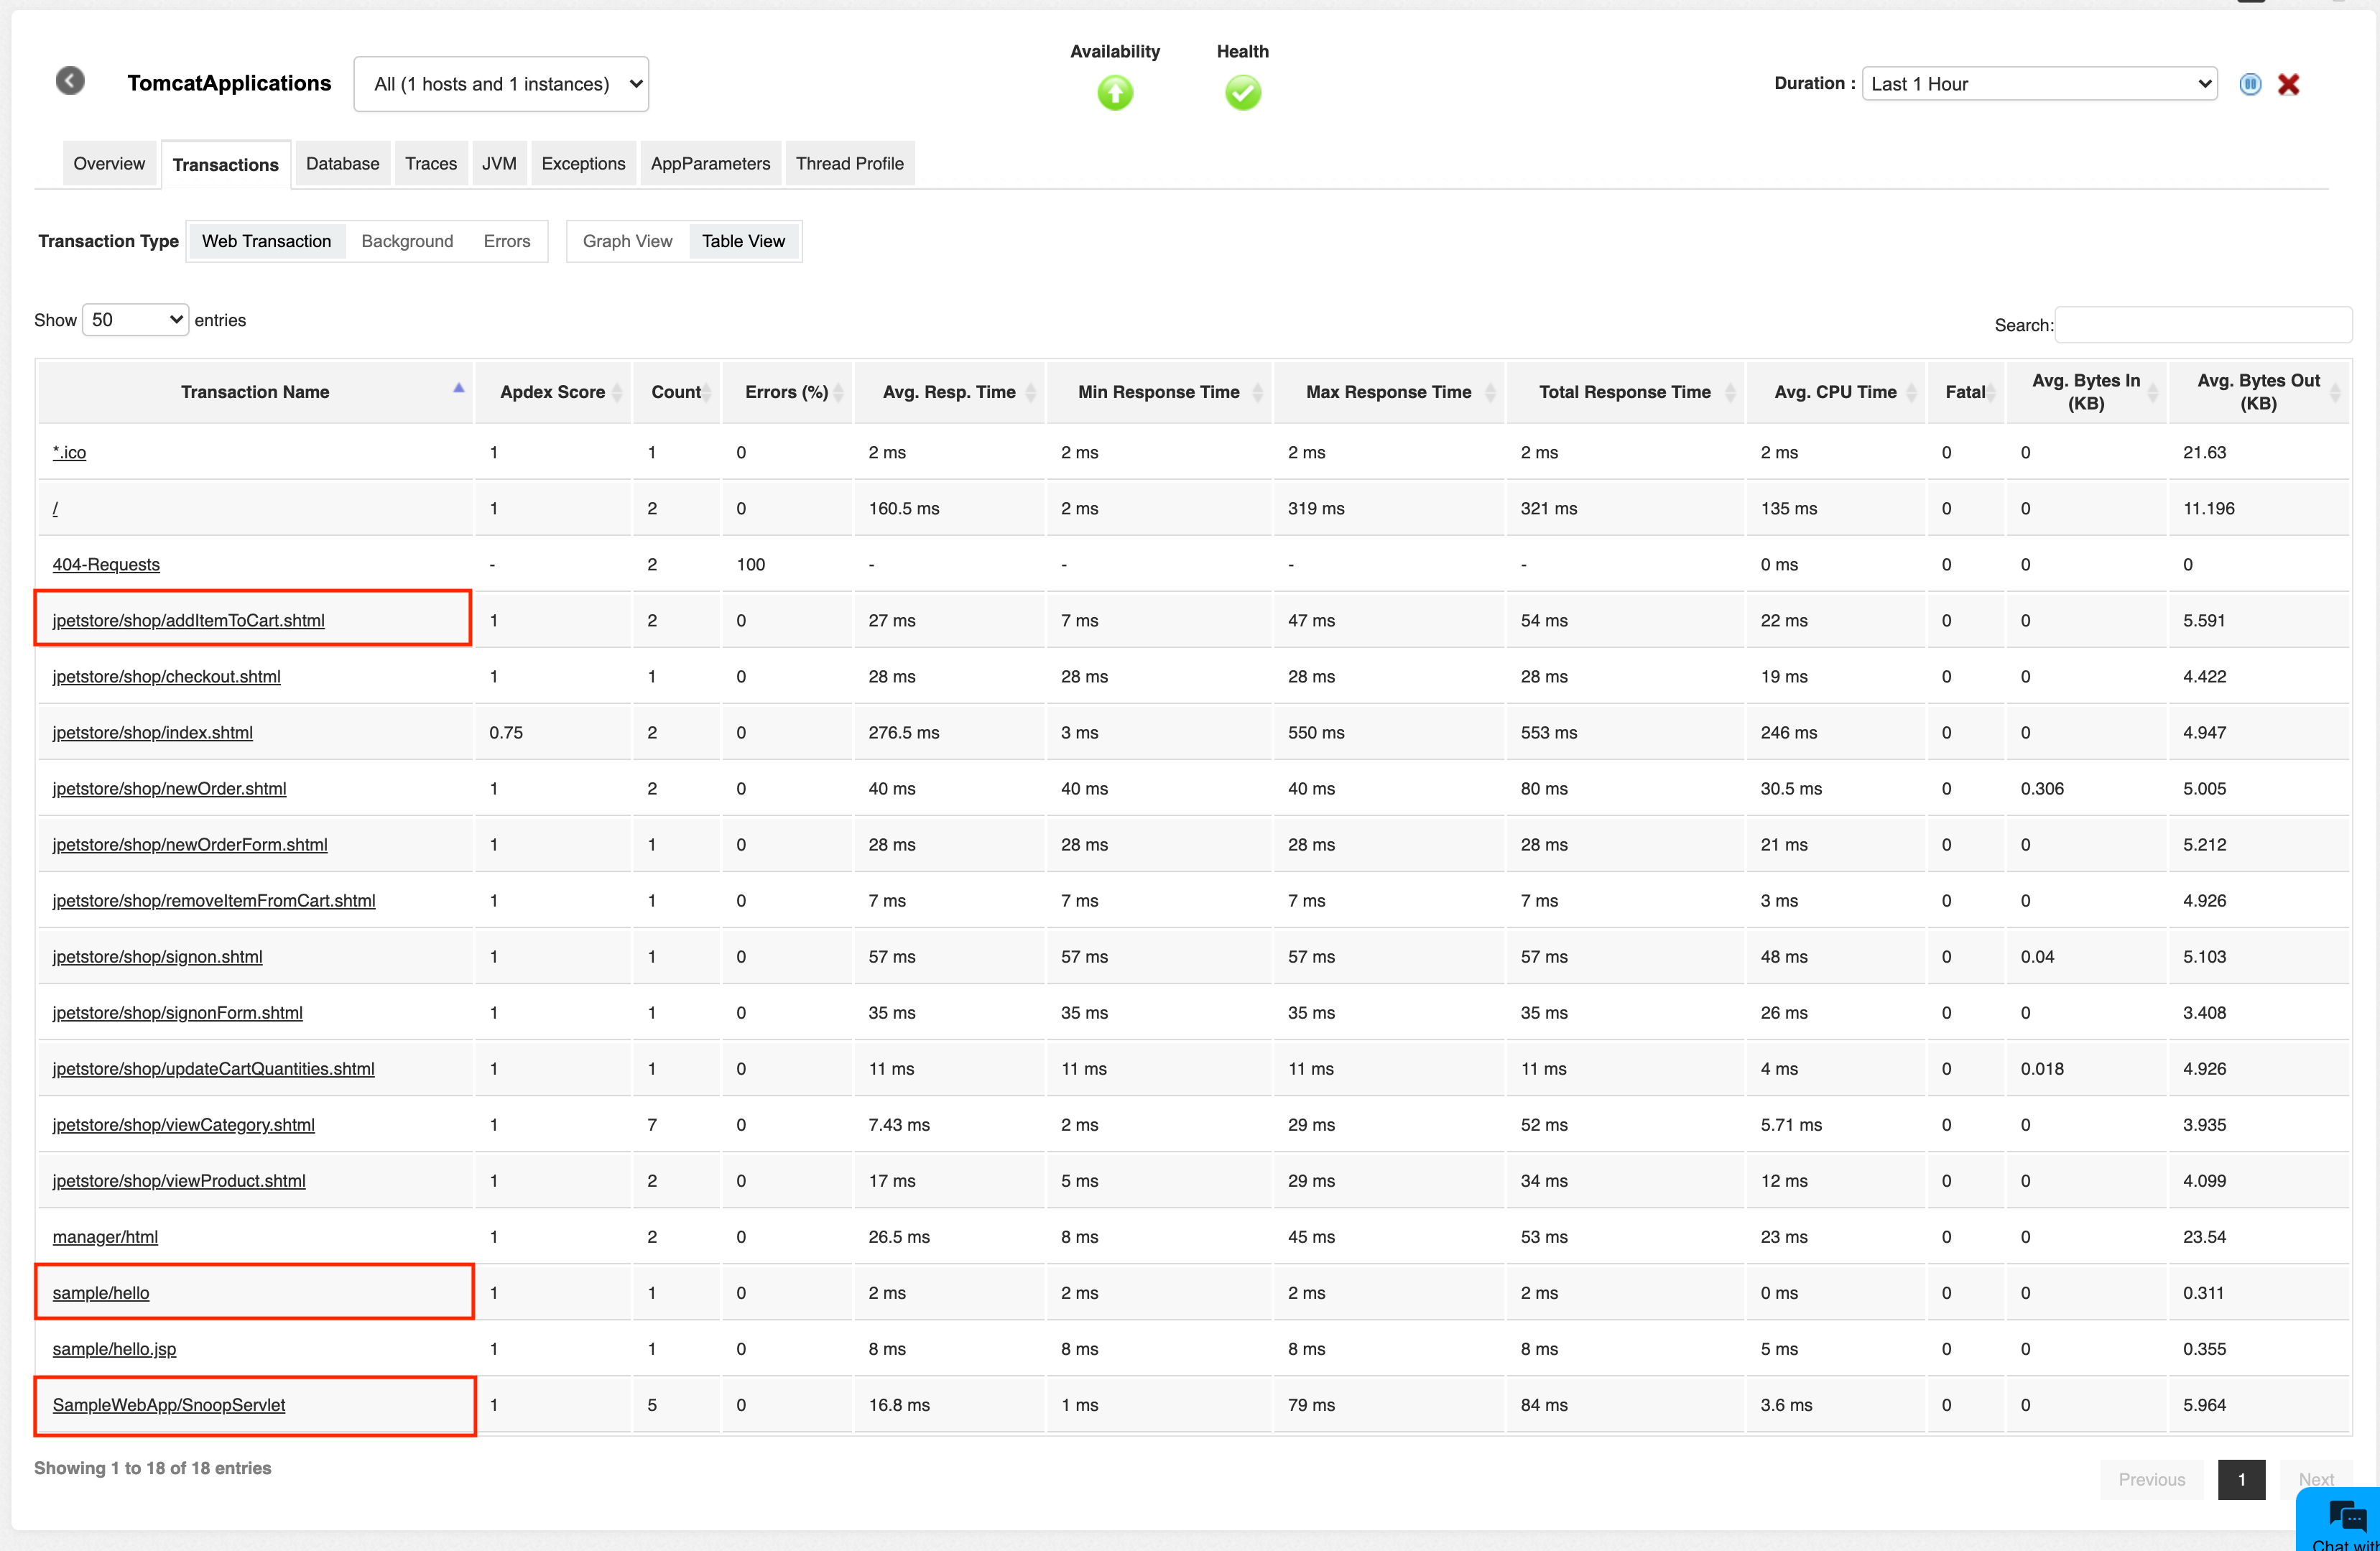
In the image cited below, "TomcatApplications" is the application monitor name, and jpetstore, sample and SampleWebApp are three contexts running on the same application server.
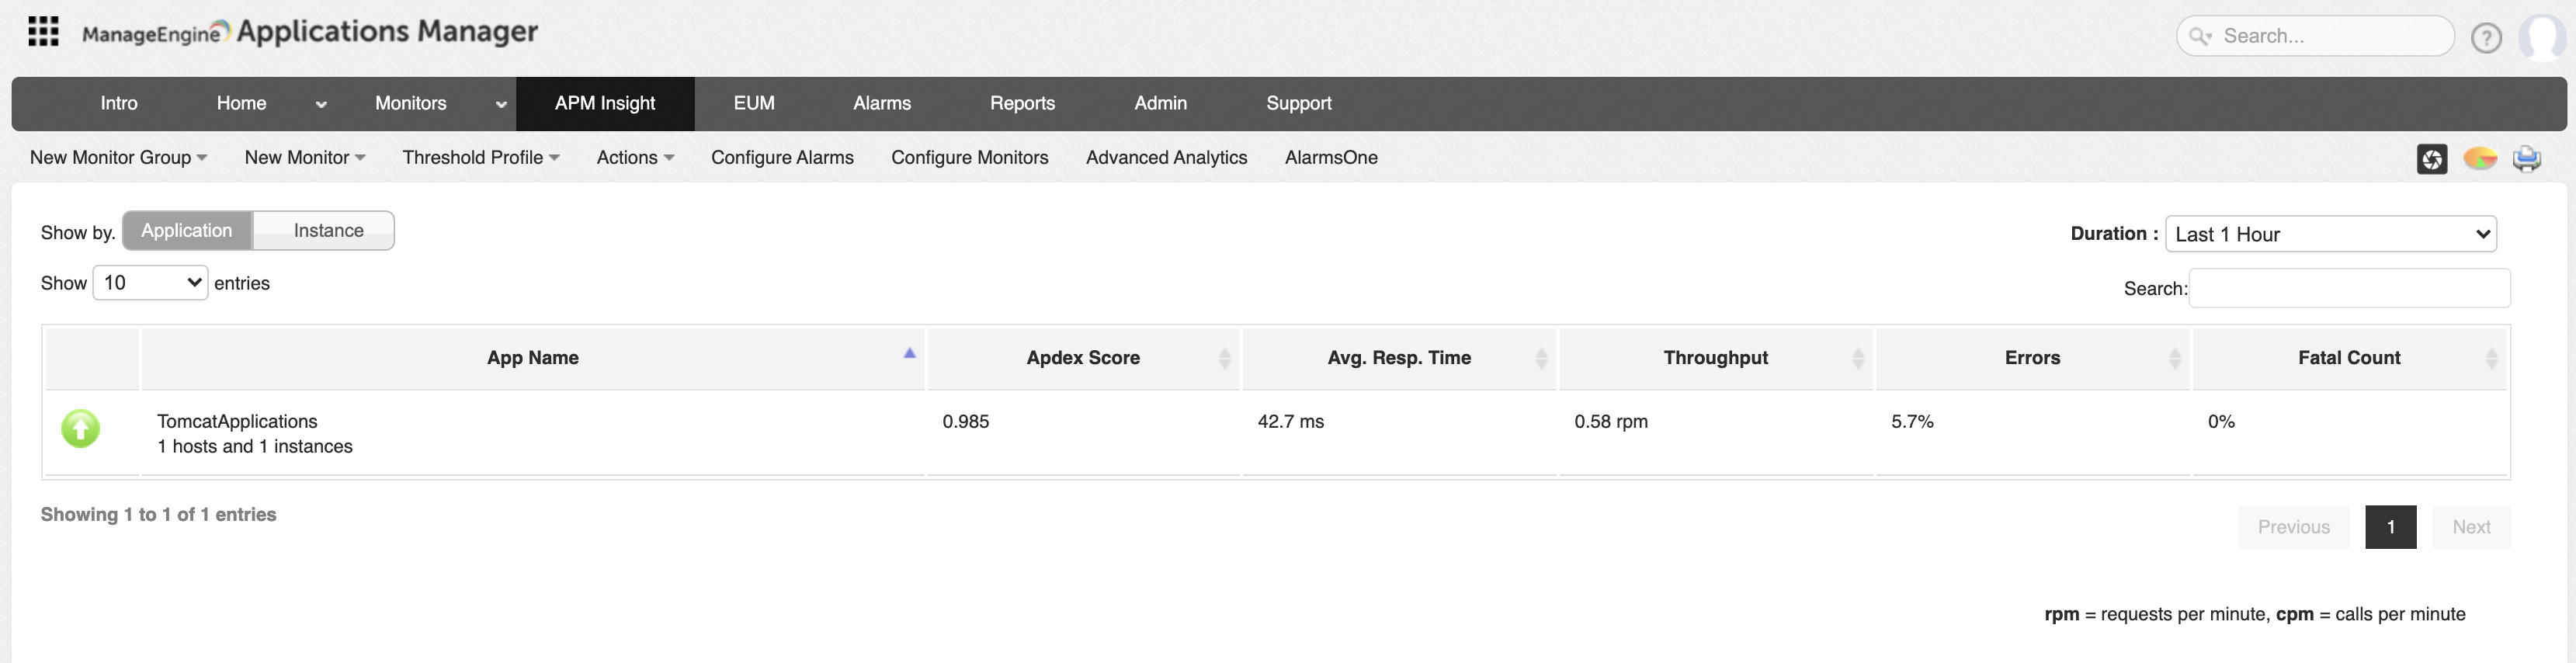
The transactions of these three applications are listed out in the Web Transaction tab.
Now, with context-based monitoring, you can monitor the performance of all individual applications running in the same app server separately, which helps you analyze your application performance at a more granular level.
This means that by enabling context-based monitoring, transactions of jpetstore, SampleWebApp and sample can be viewed separately.
Browse through the following topics to learn more on configuring context-based monitoring:
Enabling context-based monitoring
- Log in to Applications Manager.
- Download and install the APM Insight Java agent.
- Add the following key in the apminsight.conf file:
context.monitoring.enabled=true - Restart the server.
- Perform some transactions in respective contexts for the agent to identify them as individual monitors.
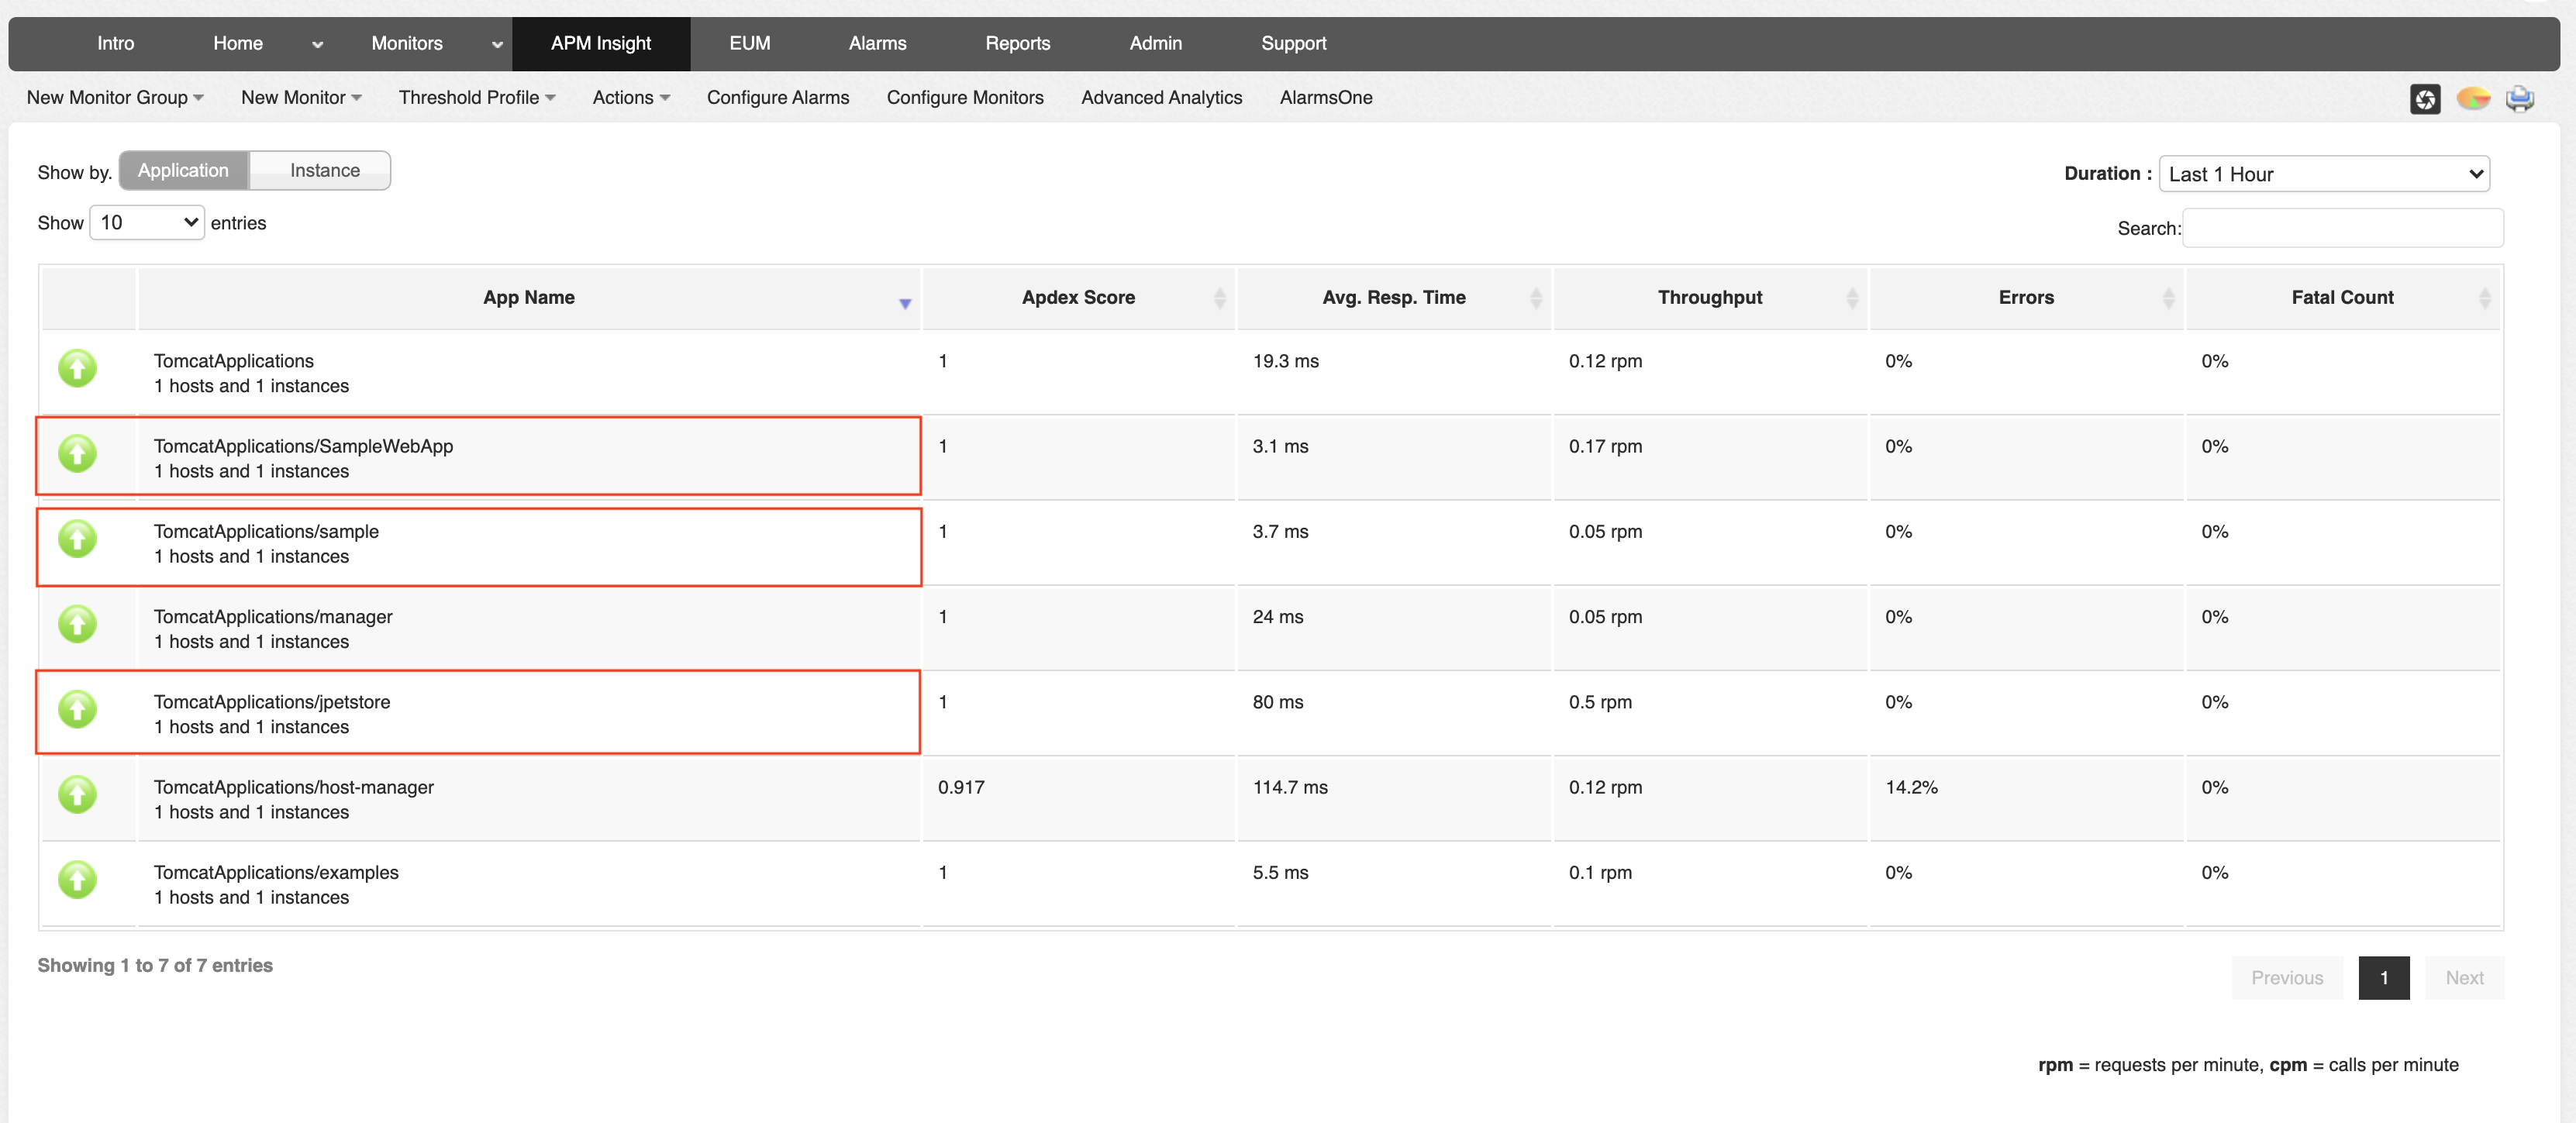
Each context name is prefixed with the application name provided in the configuration file. For example, if the application name provided in the configuration file is TomcatApplications, and individual context names are SampleWebApp, sample, and jpetstore, then the individual contexts will be shown in the APM Insight client as shown below:
- TomcatApplications/SampleWebApp
- TomcatApplications/sample
- TomcatApplications/jpetstore
Note: If context-based monitoring is enabled, each individual context is considered a separate APM Insight monitor and consumes a separate monitor license.
Renaming or grouping contexts
To rename your contexts:
- Navigate to the APM Insight agent directory.
- Create a file named "context_naming_patterns_conf".
- Provide a key-value pair, with the syntax key=value, wherein:
- Key denotes the exact context name or regex matching the context names.
- Value denotes the name used to rename the context.
Example:
- When you want to change your context name from sampleapp to jpetstore, provide the key-value pair as sampleapp=jpetstore
- When you have contexts like /api/1, /api/2 and you want to monitor them as a single application, they can be grouped as /api/\d+=/api
Important:
- Background transactions are not shown for individual contexts. Since it is not possible to identify which context triggered a background transaction, background transactions are captured at the JVM level, and the data is shown at the application level.
- Thread profiling is completed for the entire JVM and is not specific to context. Irrespective of which context the profiling is initiated from, it is performed on whole JVM and pushed to the main APM application (the one with name provided in the configuration file).
Note: This feature is available only from APM Insight Java agent version 4.4 onwards.
Disabling context-based monitoring
To disable context based monitoring:
- Add the following parameter in your apminsight.conf file:
context.monitoring.enabled=false - In your agent directory, check for the directory apminsight_monitors and delete it, if it exists.
- Restart your app server.
