Monitoring the metrics of application components
In general, your application communicates with a number of different components, including databases, cache memory, third-party services, etc. Your application's performance is substantially influenced by how long it takes these components to respond to each request. This is why monitoring component metrics is crucial for assessing your application's overall performance.
View application-specific components
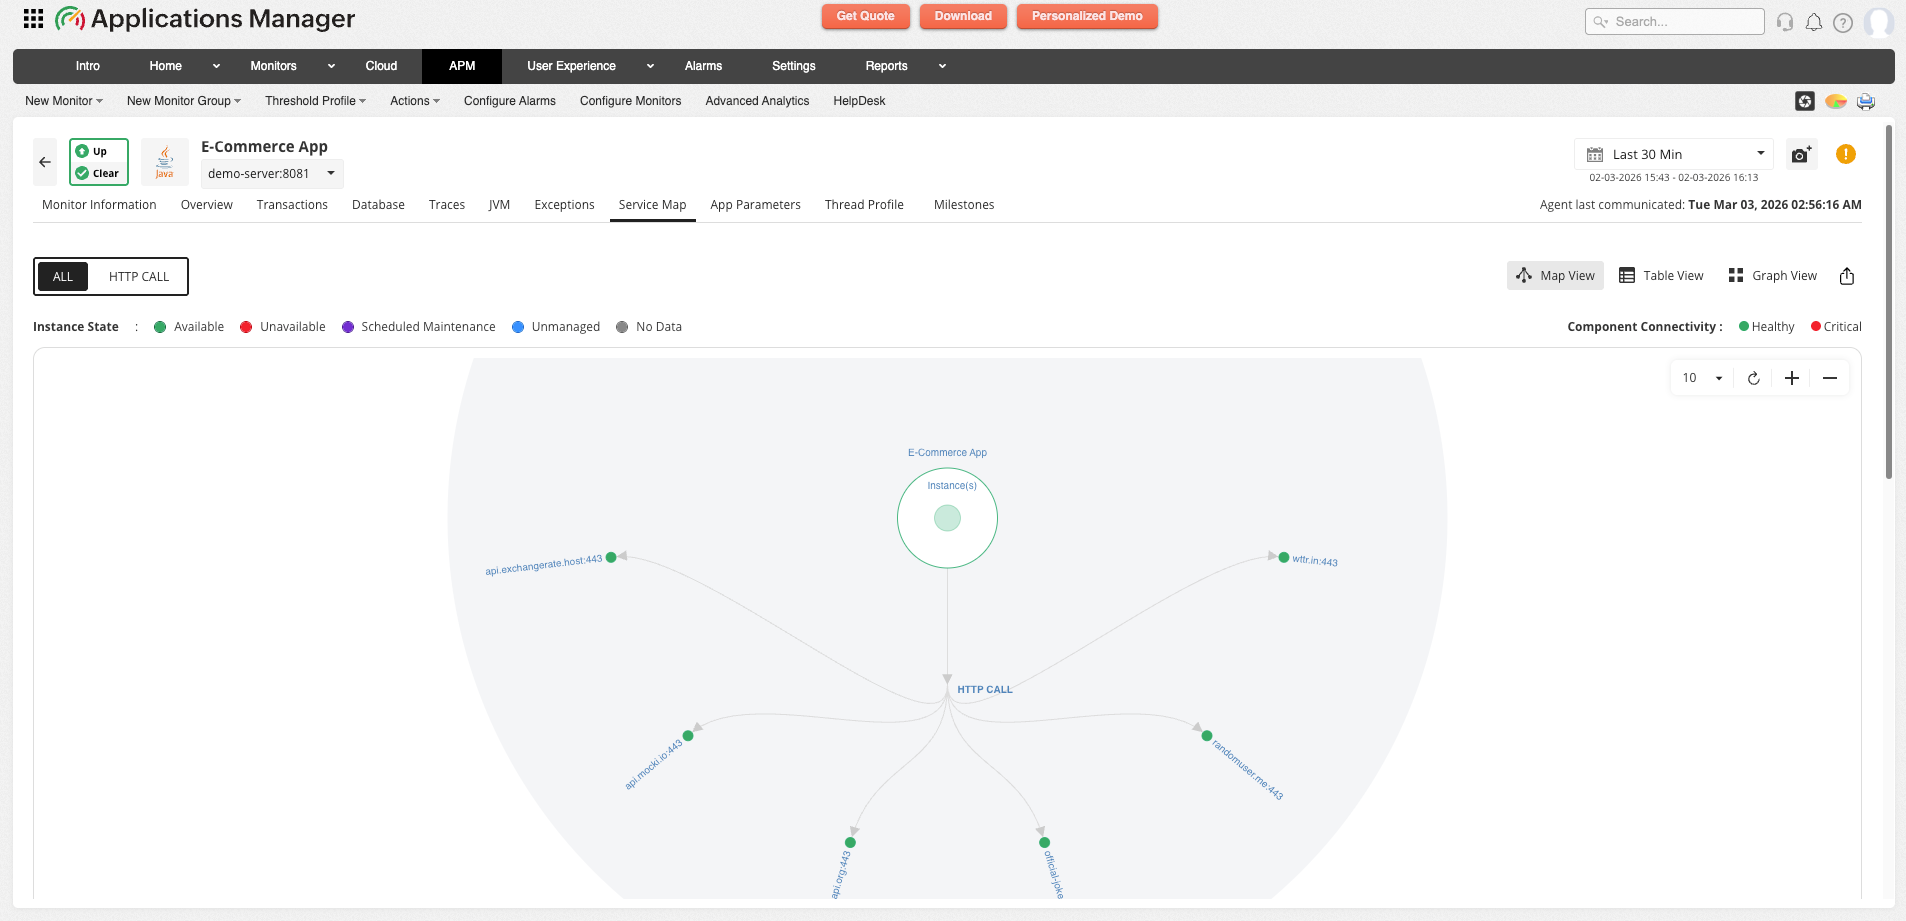
View the components your app connects to and communicates with using application dependency maps. With application dependency maps, you can track the total number of requests for each component as well as the number of failed requests. You can also get a bird's-eye view when any of your components encounters a failed request. This helps you take prompt action before your end users are affected.
View the response time of individual components
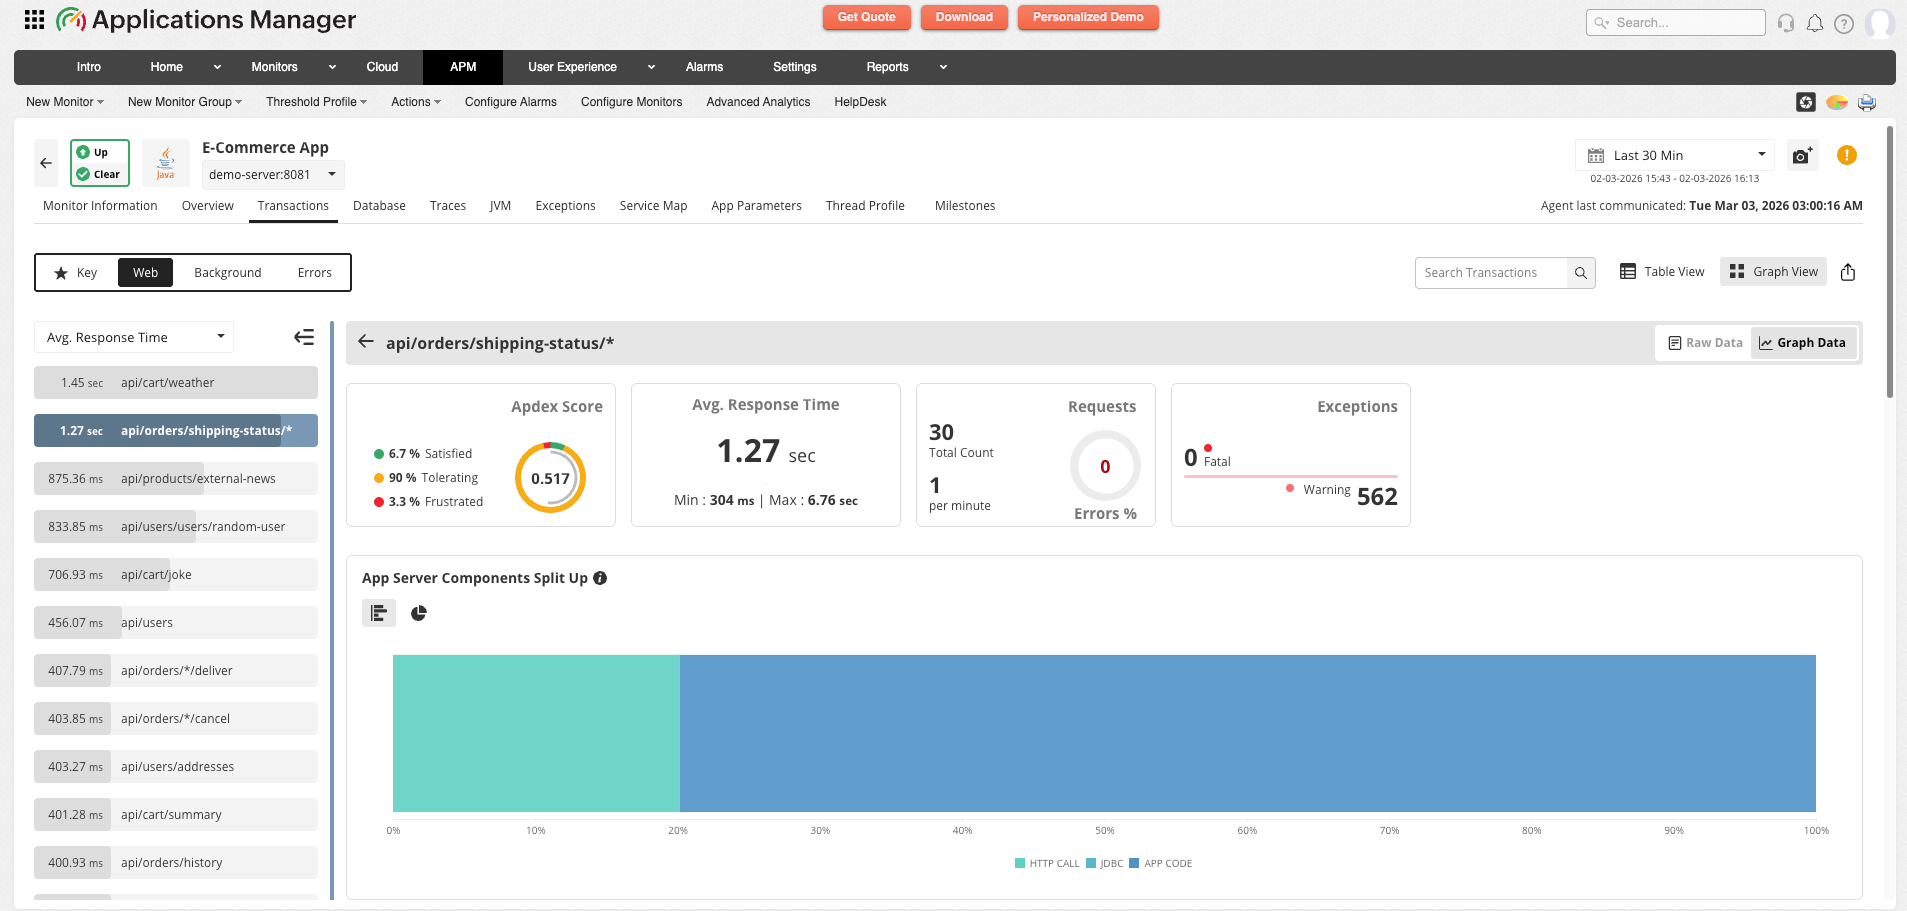
Analyze the response time taken by individual components and how it impacts your overall application response time. Choose a time period, and the response time graph for app server components will illustrate the time taken by a particular component in comparison to others. This helps you pinpoint slow performing components and optimize your code flow.
Analyze components involved in respective transactions
For every individual transaction, the involved components are mapped along with response time and count. The slowest component of that transaction is listed out in its respective trace. You can also filter out individual components involved in the respective transaction and analyze the time taken by it.
Note: For every transaction, the maximum number of component metrics has been restricted to 15 per polling interval. If there are more component metrics, they are categorised as Others.

