APM Insight Python agent Performance report
- Test environment
- Impact on application's response time
- Impact on CPU usage
- Impact on physical memory (RAM) usage
Test environment
OS: Ubuntu 20.04.1 LTS
CPU: 6-core
Memory: 15.3GB
Version: Python 3.8.10
Application framework: Django 4.0.4
Duration of test: Two hours
Impact on application's response time
Four sample Python application instances were run with and without the APM Insight Python agent at 300 and 600 transactions per minute, respectively. The data was collected over a period of two hours, and the results are summarized below.
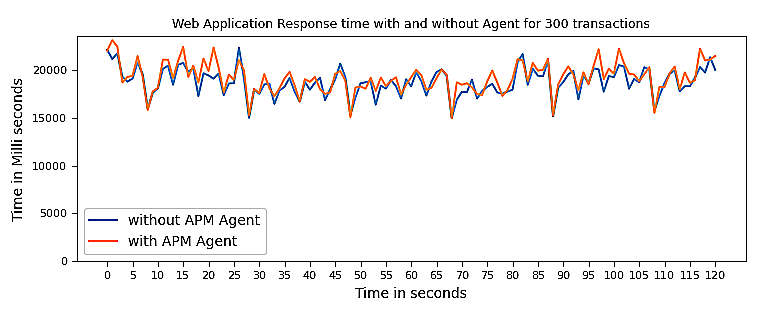
300 transactions per minute:
| Response time summary | Without agent | With agent |
|---|---|---|
| Average response time (ms) | 18852 | 19274 |
| Peak response time (ms) | 23406 | 24106 |
The average time difference observed while running applications with and without the APM Insight Python agent is approximately 2.22%.
The timeline chart below explains the historical trend:
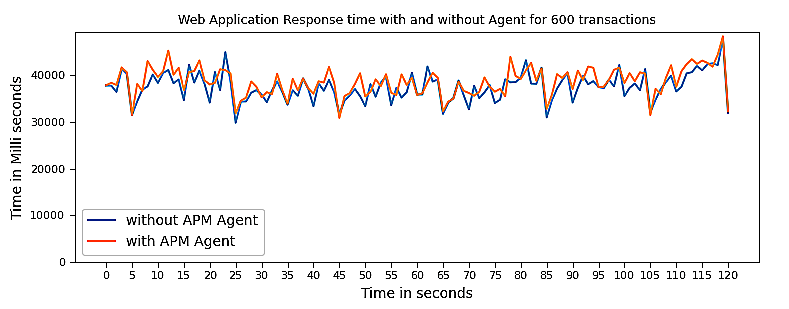
600 transactions per minute:
| Response time summary | Without agent | With agent |
|---|---|---|
| Average response time (ms) | 37620 | 38777 |
| Peak response time (ms) | 47792 | 48413 |
The average time difference observed while running applications with and without the APM Insight Python agent is approximately 3.05%
The timeline chart below explains the historical trend:
Impact on CPU usage
The CPU consumption by the APM Insight Python agent depends mainly on the number of methods instrumented and the log level (the default is DEBUG).
The data shown below is a compilation of data from applications that ran parallelly with and without the APM Insight Python agent.
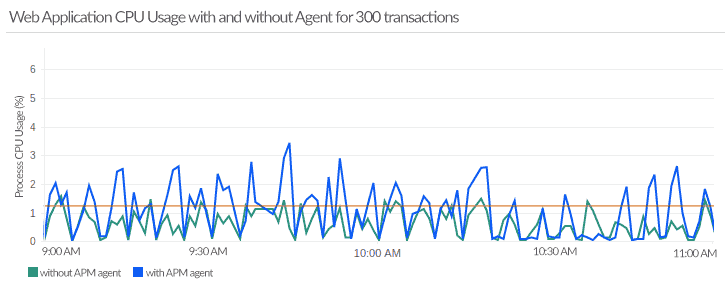
300 transactions per minute:
| CPU Usage | Without agent | With agent |
|---|---|---|
| Average usage (%) | 0.49 | 0.7 |
When the application was running at 300 transactions per minute, the agent consumed an average of 0.21% of total CPU usage.
The timeline chart below explains the historical trend:
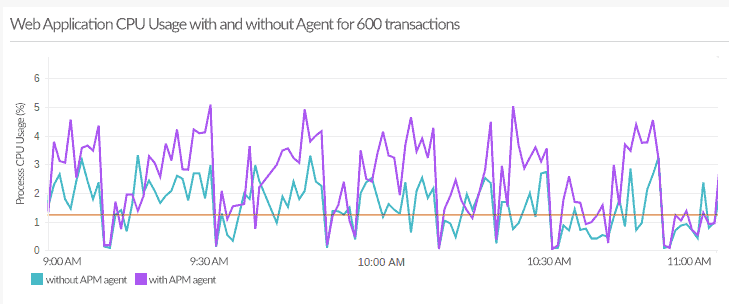
600 transactions per minute:
| CPU Usage | Without agent | With agent |
|---|---|---|
| Average usage (%) | 1.53 | 2.51 |
When the application was running at 600 transactions per minute, the agent consumed an average of 0.98% of total CPU usage.
The timeline chart below explains the historical trend:
Impact on physical memory (RAM) usage
By default, the APM Insight Python agent collects performance data and pushes it to its own service every minute, so the footprint on user memory is minimal and only transient. The important fact to note here is that memory consumption is directly proportional to the amount of data collected in a minute, so lowering the sampling factor or transaction trace threshold results in increased RAM usage.
The data shown below is a compilation of data from applications that ran parallelly with and without the agent.
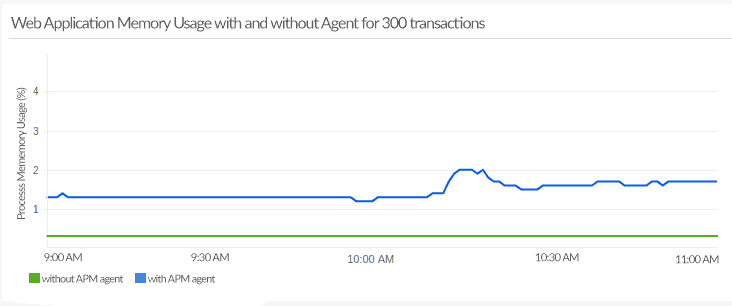
300 transactions per minute:
| Memory Usage | Without agent | With agent |
|---|---|---|
| Average usage (%) | 0.3 | 1.56 |
When the application was running at 300 transactions per minute, the agent consumed an average of 1.26% of total memory usage.
The timeline chart below explains the historical trend:
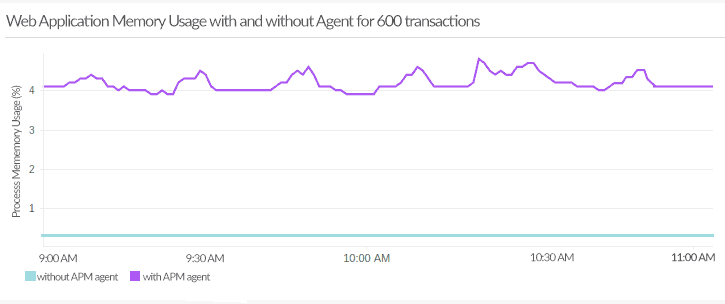
600 transactions per minute:
| Memory Usage | Without agent | With agent |
|---|---|---|
| Average usage (%) | 0.31 | 4.26 |
When the application was running at 600 transactions per minute, the agent consumed an average of 3.95% of total memory usage.
The timeline chart below explains the historical trend: