Thread Profiling
Overview
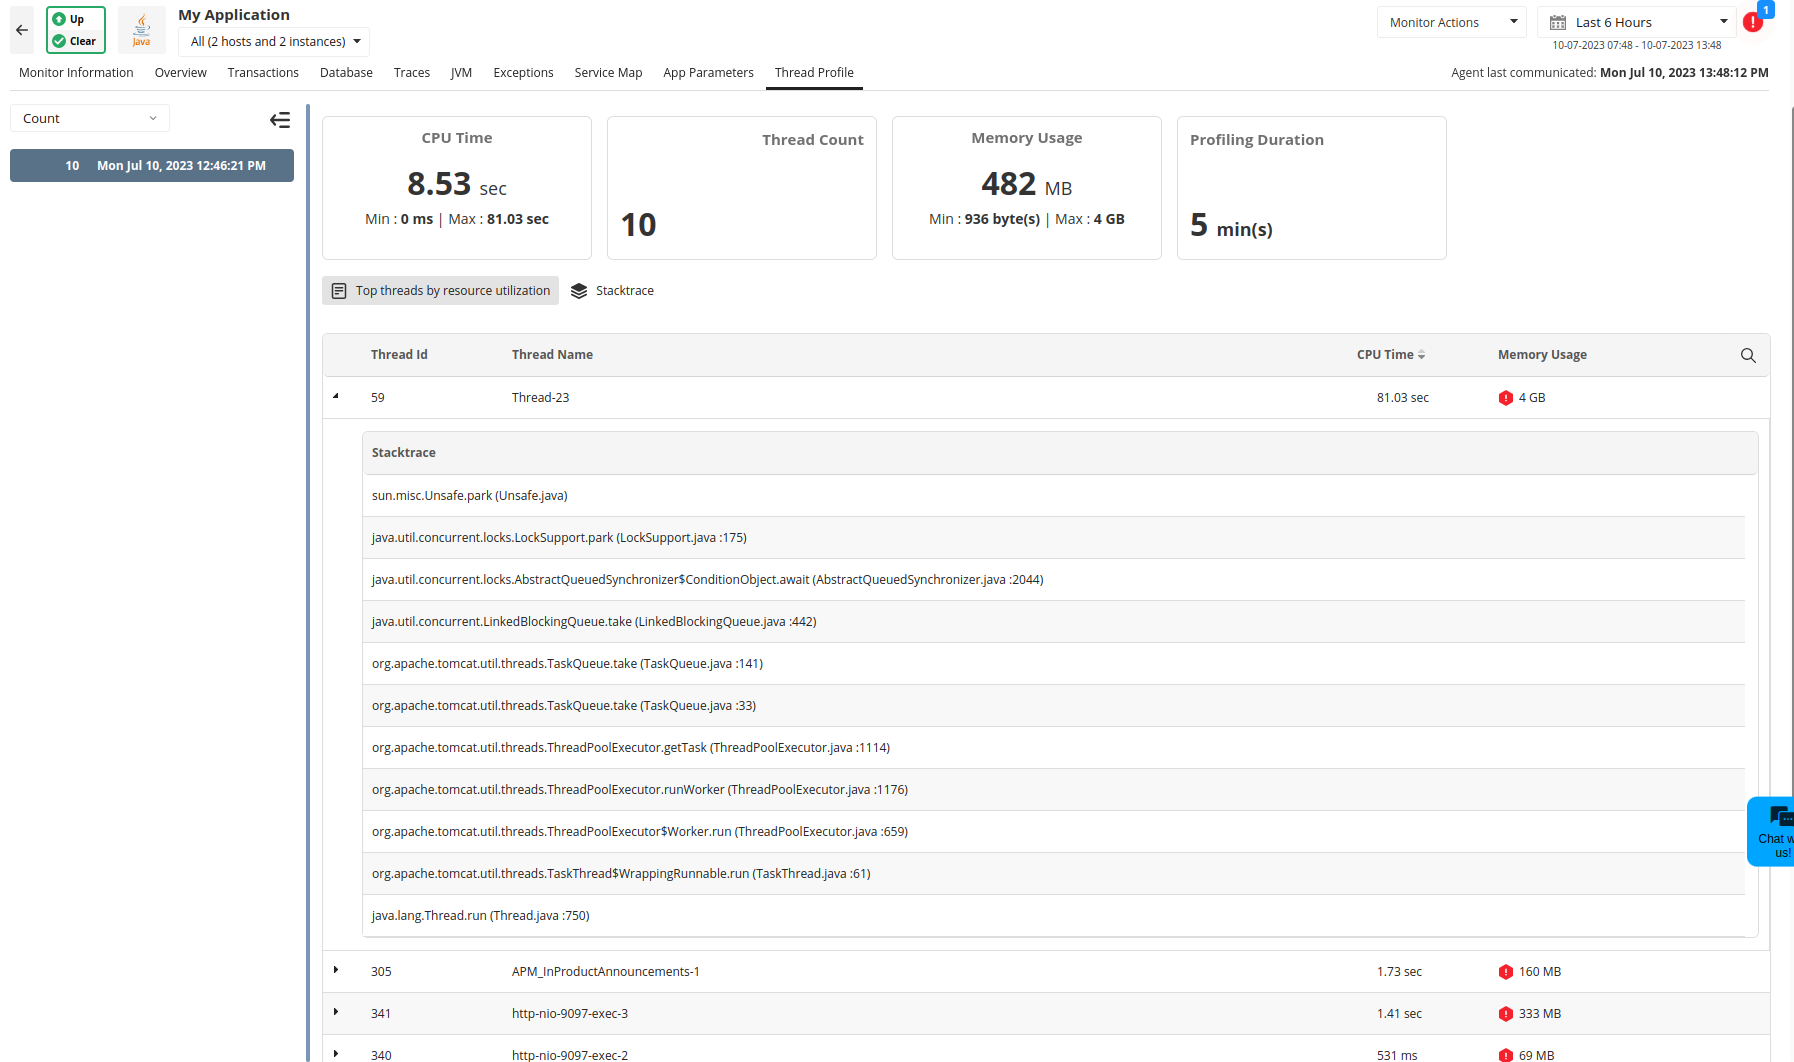
Thread profiling enables you to identify and isolate bottlenecks in your code stack. In Applications Manager's APM Insight, all thread profiles collected in the chosen time window are listed, along with the thread count, CPU time and memory details. Each thread profile consists of a list of threads that were running when the application was being profiled.
Upon clicking a specific thread profile, one can view:
- High CPU consuming threads, along with its thread ID, CPU time and memory allocated details
- Time consuming methods which could potentially affect application's performance
- Invocation count of every method
Once profiling is done, the generated dumps can be analysed in GUI. Check out the Thread Dump Analysis feature to explore more.
Contents:
Viewing thread profiles
To view Thread Profiles,
- Log into your Applications Manager account.
- Go to APM tab and click on your application.
- Click on Thread Profiling tab and then click on individual threads to inspect them further.
Note: Thread profiling is supported only for JAVA and .NET agents.
Types of thread profiling
Scheduled profiling
APM Insight schedules thread profiling after every eight hours for a period of 5 minutes. It helps in identifying and auto-instrumenting slow methods.
Note:
- In Java agent, scheduled thread profiling is enabled by default. However, you can manually disable thread profiling.
- By default, scheduled profiling is not supported for .NET agent.
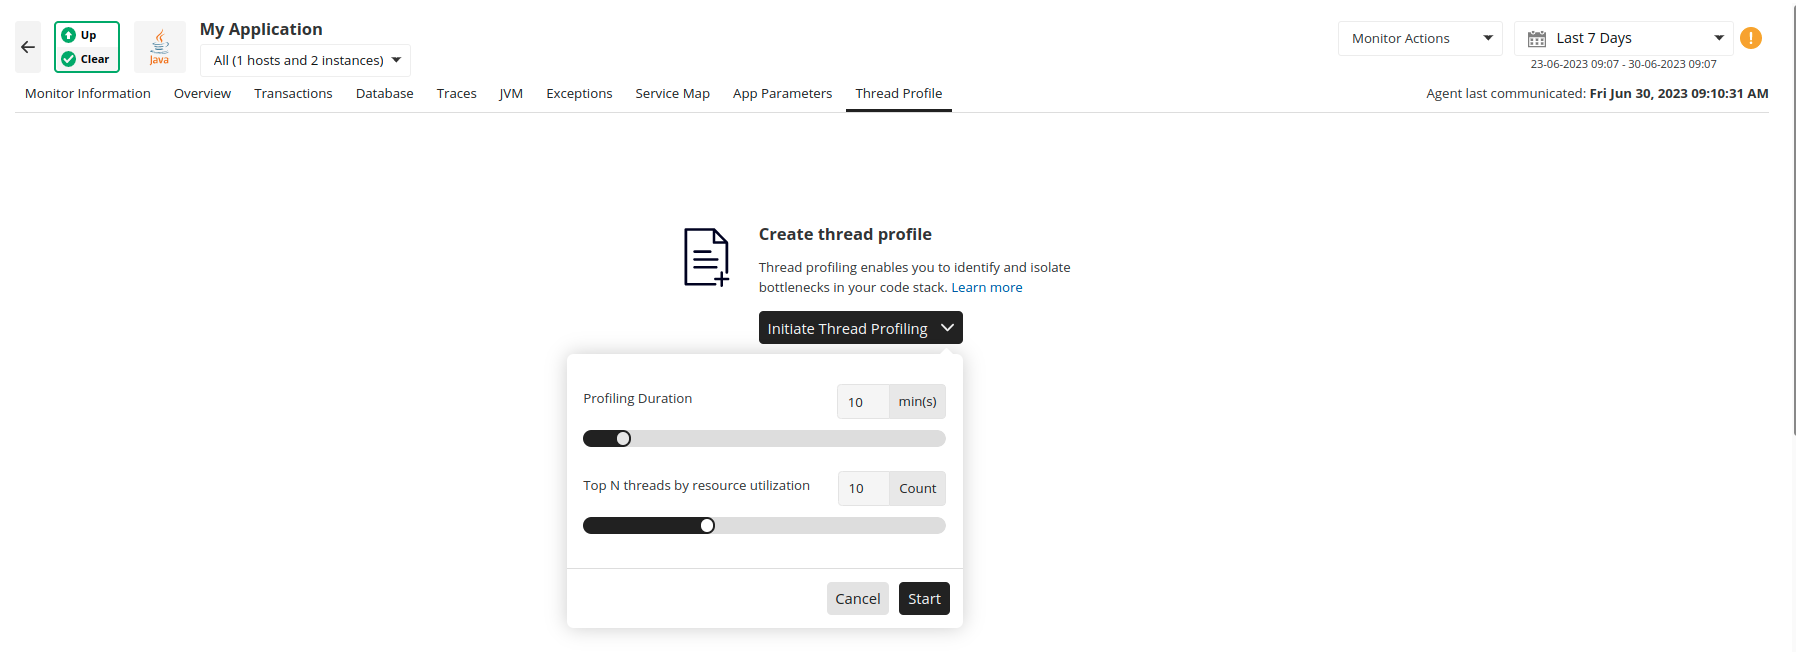
On-demand profiling
With On-Demand profiling, one can initiate thread profiling at the current time for a duration ranging from 5 to 30 minutes. The threads are sampled at regular time interval in the specified duration and the collective data is displayed at the end of time duration.
To initiate On-demand profiling,
- Log into your Applications Manager account.
- Go to APM tab and click on your application.
- Click on Thread Profiling tab, then click on On-demand thread profiling tab to initiate.
- Specify time duration and click on Initiate profiling.
Note: On-demand profiling can be initiated only once per hour (i.e) if you initiate On-Demand profiling for 5 minutes, next initiation can be done only after 55 minutes.
On-demand profiling can be initiated for both applications and instances.
- In application view, On-demand profiling will be initiated for the first available instance.
- In instance view, On-demand profiling will be initiated only when the instance is UP.
- When your instance is suspended, On-demand profiling will be disabled.
Top N resource-consuming threads
With this option, you can easily identify the threads that consume the most CPU or memory. You can choose any value (N) from five to 20.
Note: This option is only available for Java agents v6.0 and above.
When On-demand thread profiling is requested, the agent also monitors the CPU and memory usage of each thread. The agent picks the top N threads that consumed a large amount of resources from each category (CPU and memory) based on the N value you provided. Once the profiling is finished, the threads, along with their usage statistics and stack traces, will be displayed in the Applications Manager web client.
The below figure shows the threads sorted in descending order by the amount of resources consumed.