ManageEngine Applications Manager provides comprehensive performance metrics to monitor your VMware ESX/ESXi servers and their guest virtual machines, and helps you ensure they are performing well at all times.
Applications Manager connects with VMware ESX/ESXi servers through standard APIs and determines the health status as well as the performance of the host servers and their corresponding virtual machines. It provides a single console to monitor physical, virtual and cloud components of your IT infrastructure.
Supported Versions: ESX 3.5 and above; ESXi 3 and above.
Follow the steps given below to create a new VMware ESX/ESXi server monitor:
In order to add VMWare ESX/ESXi servers for monitoring, we recommend to use the root account. However, in case you are unable to use the root account, you can use a 'view-only' profile to add the servers. This profile has enough rights to be used for monitoring. The user you create must be:
Go to the Monitors Category View by clicking the Monitors tab. Click on VMware ESX/ESXi under the Virtualization Table. Displayed is the VMware ESX/ESXi bulk configuration view distributed into three tabs:
VMware ESX servers are monitored based on the parameters or the attributes listed below. These attributes provide information about the functioning of the monitors of VMware ESX server. You can also configure thresholds to the numerical attributes monitored by the server based on these details.
Click on the monitor listed in the Availability tab to view detailed performance metrics of the ESX/ESXi server. These metrics are categorized into 9 different tabs for easy understanding. Below is an explanation of the metrics shown in these tabs:
This tab provides a high-level overview of the ESX/ESXi server as well as its resource utilization.
| Parameter | Description |
|---|---|
| Monitor Information | |
| Name | The name of VMware ESX/ESXi server monitor |
| Type | Denotes the type of servers you are monitoring. |
| Health | Denotes the health (Clear, Warning, Critical) status of the ESX/ESXi server. |
| Last Polled at | Specifies the time at which the last poll was performed. |
| Next Poll at | Specifies the time at which the next poll is scheduled. |
| Availability | Shows the current status of the server - available or not available. |
| CPU & Memory Utilization | |
| CPU Utilization | The combined CPU utilization across the system(%) |
| CPU Idle Time | The average time that the CPU cores remain in an idle state (m/sec) |
| CPU Usage | The total CPU usage across the system(MHz) |
| Memory Utilization | Percentage of memory used across the system(%) |
| Disk & Network Usage | |
| Disk Usage | Disk usage of ESX/ESXi server in kbps(kilobytes per second) |
| Network Usage | Network usage of ESX/ESXi server in kbps(kilobytes per second) |
| Virtual Machines | |
| VM Name | Name of the virtual machine(VM) present in the host |
| Availability | Denotes the availability of the VM - available or not available |
| CPU Utilization | The CPU utilization of this VM in percentage |
| Memory Utilization | The memory utilization of this VM in percentage |
| Disk I/O Utilization | The disk input/output utilization of this VM in kilobytes per second |
| Network Utilization | The network usage of this VM in kilobytes per second |
| Health | The health status(Clear, Warning, Critical) of this VM |
This tab provides metrics about CPU Utilization details of the cores.
| Parameter | Description |
|---|---|
| CPU Utilization | The cpu utilization of the CPU core over a period of time(in percentage) |
| Health | The overall health of the CPU core |
| CPU Idle Time | The total time that each CPU core remains in an idle state (ms) |
This tab provides metrics about memory utilization of the ESX server.
| Parameter | Description |
|---|---|
| Consumed Memory | The value of total memory minus free memory, in mega bytes. |
| Active Memory | Amount of memory that is actively used |
| Overhead Memory | Sum of overhead memory across all VMs |
| Reserved Memory | Amount of memory currently utilized to satisfy minimum memory values set for all VMs. |
| Shared Memory | Amount of memory shared between virtual machines |
| Granted Memory | Amount of physical memory granted |
| Swapped Memory | Amount of memory that is swapped |
| Heap Memory | Amount of memory allocated for heap |
| VMKernel Memory | Amount of memory used by the VMKernel |
This tab displays metrics pertaining to the data stores of the server.
| Parameter | Description |
|---|---|
| Datastore | Name of the datastore |
| Type | Type of datastore (example: VMFS or VMware File System) |
| Capacity GB | The total space available in this datastore in giga bytes |
| Used GB | The used space of this datastore in giga bytes |
| Free GB | The free space of this datastore in giga bytes |
| Utilization % | Percentage of used space in this datastore |
| Free Space % | Percentage of free space in this datastore |
| Health | Overall health of the datastore |
| Read Rate | The rate at which data is read from the datastore (kbps) |
| Write Rate | The rate at which data is written to the datastore (kbps) |
| Read Latency | The average time taken for a read from the datastore (ms) |
| Write Latency | The average time taken for a write to the datastore (ms) |
Note: The capacity, used and free metrics are not supported for NFS datastores.
This tab provides metrics about network utilization
| Parameter | Description |
|---|---|
| Name | Name of the network interface card (NIC) of the host |
| Data Receive Rate | The rate at which this NIC receives data(Kbps) |
| Data Transfer Rate | The rate at which this NIC transfers data (Kbps) |
| Packets received | Number of network packets received by this NIC |
| Packets Transmitted | Number of network packets transmitted by this NIC |
| Health | Overall health of this NIC |
This tab shows detailed disk I/O(Input/Output) stats of the ESX/ESXi server
| Parameter | Description |
|---|---|
| LUN | Logical unit number associated with the physical disk |
| Disk Read Rate | Disk read rate of this LUN(Kbps) |
| Disk Write Rate | Disk write rates of this LUN(Kbps) |
| Disk Reads | Number of reads to this LUN |
| Disk Writes | Number of writes to this LUN |
| Health | Overall health of this LUN |
| Read Latency | The average amount of time taken during the collection interval to process a SCSI read command issued from the Guest OS to the virtual machine (ms). |
| Write Latency | Average amount of time taken during the collection interval to process a SCSI write command issued by the Guest OS to the virtual machine (ms). |
| Commands Aborted | The number of SCSI commands aborted during the collection interval. |
| Bus Resets | The number of SCSI-bus reset commands issued during the collection interval. |
This tab shows a detailed Event List for monitoring of ESX Events.
| Parameter | Description |
|---|---|
| Event Name | The name of the event. |
| Description | A description of the Event. |
| Severity | The severity of the log event. |
| Generated Time | The time at which the event is generated. |
Note: To configure new events, Click the Monitor Actions button in the right-hand corner of the page and in the drop-down menu, click Configure Events.
This tab provides info on the ESX/ESXi server's configuration details.
| Parameter | Description |
|---|---|
| Host Name | The name of VMware ESX/ESXi server monitor |
| Power | The power status of the server. The values include poweredOn, poweredOff and standBy |
| Vendor Name | The name of the vendor offering Virtualization(VMware) |
| Version | Version of ESX/ESXi server |
| Hardware Vendor Name | Hardware vendor identification |
| Hardware Model | System model identification |
| CPU Model | Information about the overall CPU |
| CPU Capacity MHz | The overall CPU capacity in Mega Hertz |
| CPU Cores | Number of CPU cores present in the server |
| Number of VMs | Number of virtual machines discovered in the server |
Applications Manager automatically maps VMware vSphere servers and their VMs to their underlying physical storage arrays. You can track the vSphere servers and their VMs to the datastores, to the host bus adapters and the actual physical storage. This tab displays a storage mapping table displaying Virtual Machine, Datastore, Storage Array and corresponding LUN statistics.
| Parameter | Description |
|---|---|
| STORAGE ADAPTERS | |
| Adapter Name | The name of the Storage Adapter. |
| Adapter Status | The status of the Storage Adapter: Online, Offline, Fault, Unknown. |
| Model | The model of the storage adapter. |
| Type | The type of storager adapter. |
| Driver | The driver details of the storage adapter. |
| Target Count | The Target Count for that storage adapter. |
| LUN Count | The number of array LUNs on the host. |
| Path Count | The number of total storage paths on the server. |
| Parameter | Description |
|---|---|
| Virtual Machine | The name of VMware ESX/ESXi server monitor |
| Datastore | The name of the datastore |
| LUN | Virtual disk information for the corresponding LUN |
The folloiwng are metrics pertaining to the hardware of the server.
| Parameter | Description |
|---|---|
| Power | Sensor Reading will be monitored in watts |
| Fan | Sensor Reading will be monitored in percentage |
| Temperature | Sensor Reading will be monitored in Degree Celsius |
| Processors | Health status of the sensor will be monitored. |
| Memory | Health status of the sensor will be monitored. |
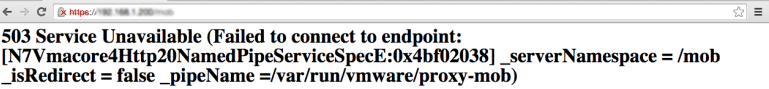
1. How can I check if the Managed Object Browser (MOB) service is enabled in the ESX host?
The MOB service is disabled by default. So when you try to access the MOB URL of ESX host, the output should look like this:
The Output should look like this:
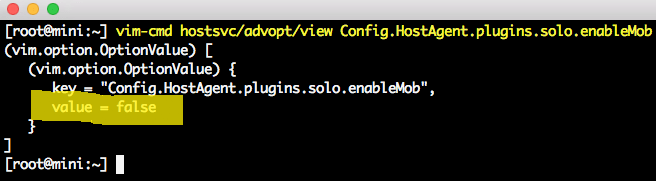
vim-cmd hostsvc/advopt/update Config.HostAgent.plugins.solo.enableMob bool true
Thank you for your feedback!