Reports in LAMA (Logging and Monitoring Mechanism)
Overview
The LAMA (Logging and Monitoring Mechanism) Report is a powerful feature provided by ManageEngine Applications Manager that offers complete visibility into your data transmission processes. It serves as a centralized interface where you can track all pushed data—what was sent, when it was sent, and whether it was successfully processed. Designed to support real-time monitoring and post-event analysis, LAMA Reports help to validate data flow, troubleshoot issues, and ensure integration accuracy.
LAMA Reports
In APM, you can view the data pushed from APM to LAMA in a structured data table format. Simply navigate to the LAMA Data Card and click on the Reports option. This will display a detailed table containing the pushed records along with all relevant fields and values. You can also apply custom date range filters to view specific data as needed.
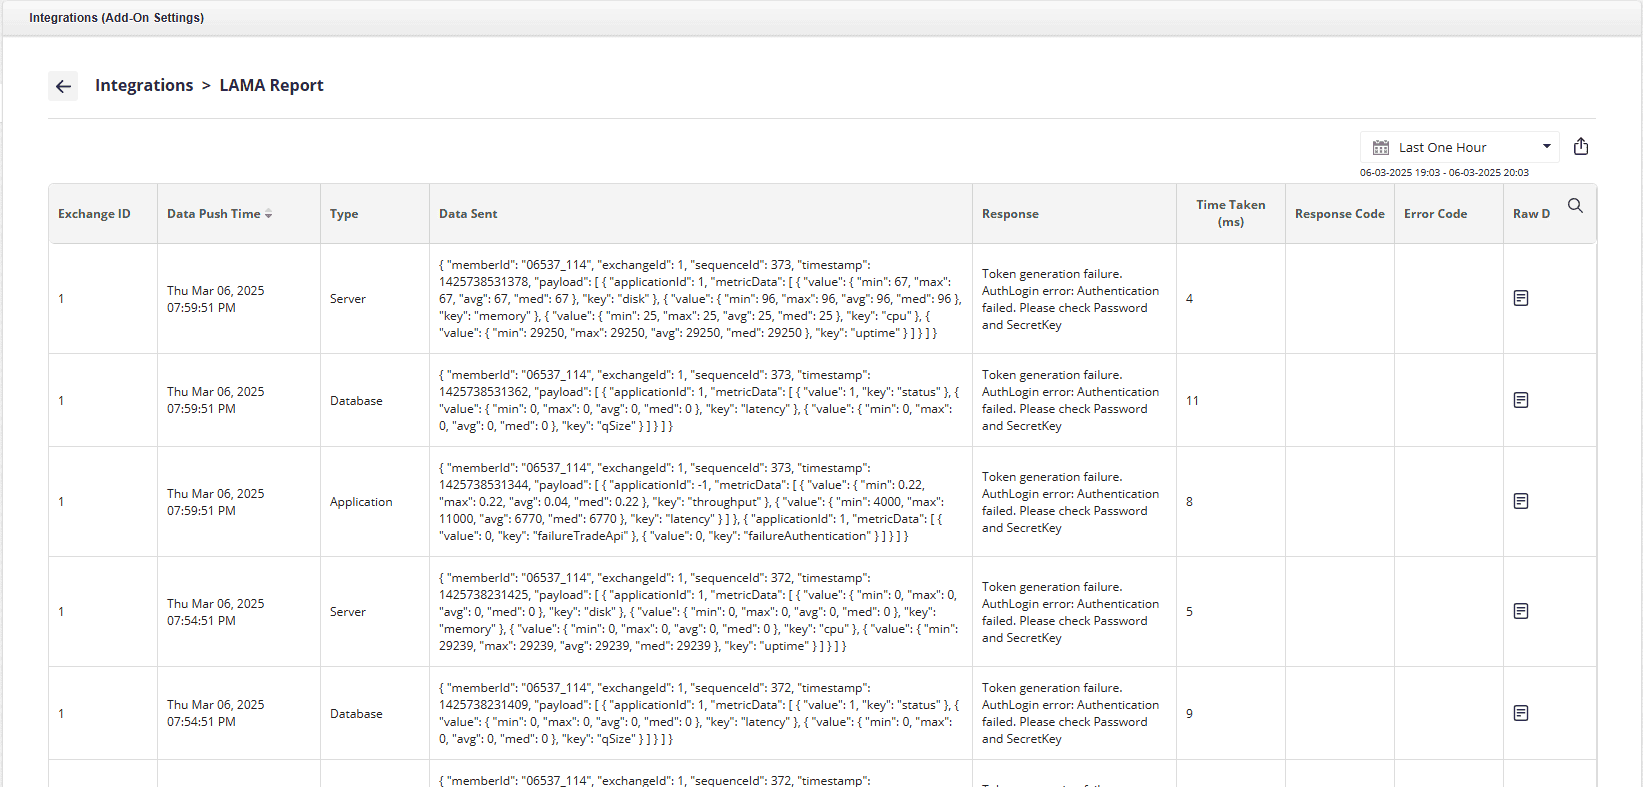
Following are the key features of LAMA Reports:
- Data Table: Displays LAMA integration details with columns for Exchange ID, Sync Time, Type, Request Data, Response Message, Request Time, Response Code, Error Code, and Raw Data.
- Export Options: Data can be exported in PDF, Excel, and CSV formats.
Note:Data Retention Period has been increased to 3 years.
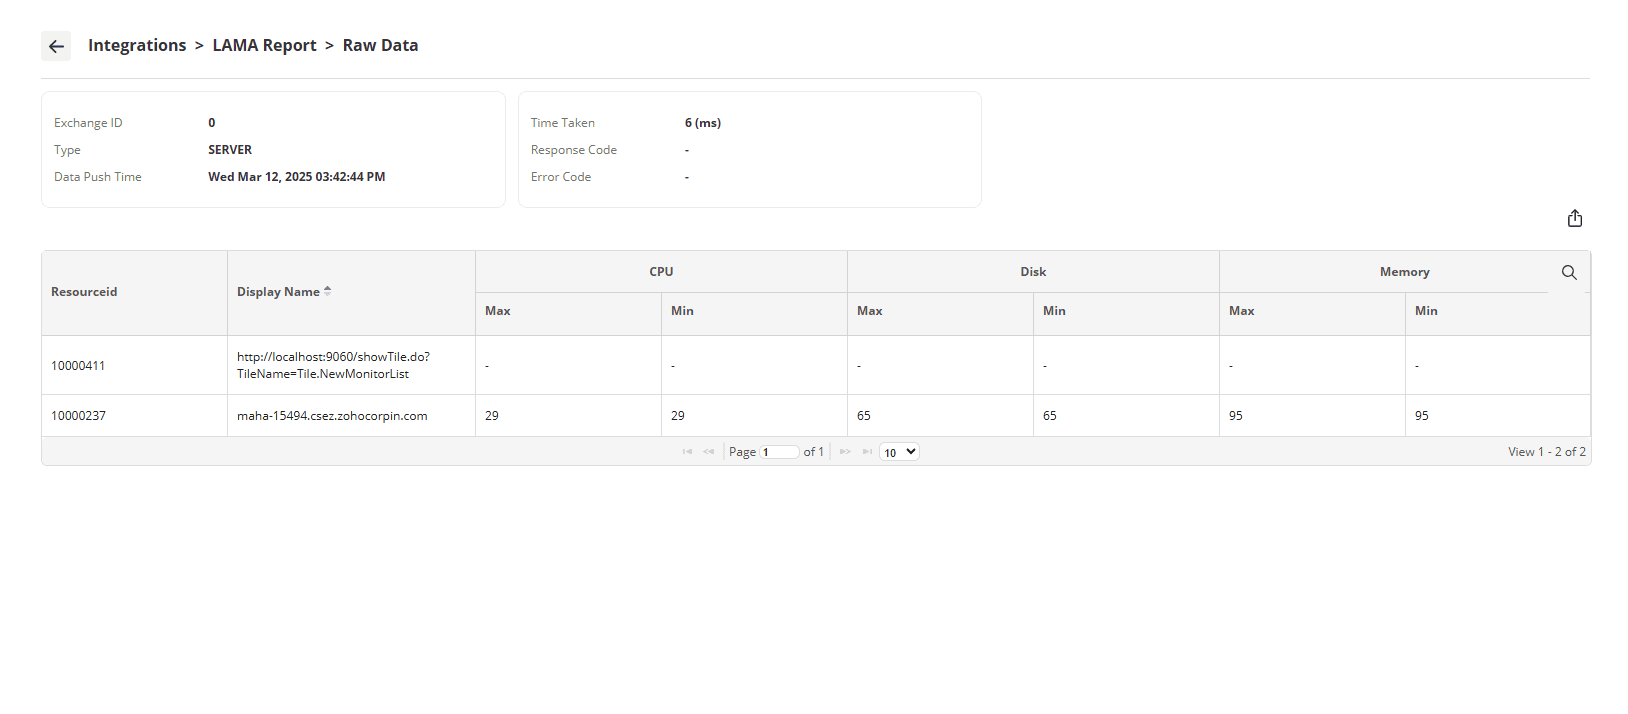
LAMA Raw Data Report
The raw data collected during each LAMA push is stored, which includes information for all Resource Ids that are part of the selected Monitor Group. When a user selects a specific Sync Time, generate the Raw Data report is generated using the corresponding values, providing detailed insights into the collected metrics at that point in time. To ensure optimal database performance, this data is retained for a period of six months, after which it is automatically cleaned up as part of a scheduled cleanup process.
Data Retained for Metrics Categories
| Category | Metrics | Details |
|---|---|---|
| Application |
| Min and Max for all ResourceIds will be added to JSON |
| Consolidated value for the ResourceId during the time period will be stored | |
| Database |
| Min and Max for all ResourceIds will be added to JSON |
| The overall replication status of the ResourceId (Database) will be displayed. | |
| Server |
| Consolidated value for the ResourceIds during the time period will be stored |
Note: If any metric data is not available for the ResourceId during the poll interval or if the data is not supported by the ResourceId, the metric will be represented with a hyphen (null entry).
Refer the given screenshot for a sample LAMA Raw Data Report.