Mobile App Monitor Dashboard
Applications Manager's Mobile App Monitor dashboards help you understand your user interactions in your web applications at a single glance. You can obtain a holistic view about the status of your Mobile App Monitoring applications. Mobile App Monitor dashboard lists all your active, inactive applications along with the ones that are in Critical, Warning or Clear state. Details of every aspect of your application can be assessed using various tabs in the page.
Monitored Parameters
Go to the Monitors Category View by clicking the Monitors tab. Click on Mobile App Monitor under the Application Servers table. Displayed is the Mobile App Monitor bulk configuration view distributed into three tabs:
- Availability tab gives the Availability history for the past 24 hours or 30 days.
- Performance tab gives the Health Status and events for the past 24 hours or 30 days.
- List view enables you to perform bulk admin configurations.
Following are the list of metrics shown in the Mobile App Monitor in their corresponding tabs:
Overview
| Parameter | Description |
|---|
| Summary Report - World View - Displays a real-time geographic summary of the locations where the application is being accessed. Summary includes Apdex score, average response time, page views, and global error count. Users can select a country from the dropdown menu to view summary reports for that specific location. |
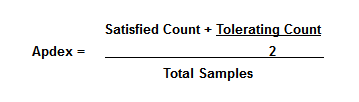
| Apdex Score | Apdex is a measure of response time against a set threshold. It measures the ratio of satisfactory response times to unsatisfactory response times. The Apdex Score is calculated using the following formula:
 |
| Avg. Response Time | The overall response time of the application including Transactions, Screens and Http calls (in ms). |
| Page Views | Number of times the users have visited the screen/invoked the transaction/Http call. One http call/transaction/screen/Crash is considers as one page view |
| Error Count | The overall count of the Crashes occurred in the the application. |
| Response Time - Displays the 95th percentile graph of Response Time for the application. |
| Throughput - Displays the 95th percentile graph of Throughput for the application. |
| App Start Warm vs Cold chart - Displays the graphical representation of the Application Warm vs Cold Start Response time. |
Transactions
| Parameter | Description |
|---|
| Transactions |
| Transaction Name | The name of the transaction (Inclusive of Transactions, Screens and Http Calls). |
| Avg. Response Time | Average time taken by the application to respond to the transaction (in ms). |
| Total Count | Number of times the transaction has occurred in the application. |
| Throughput | The number of transactions served per minute for the chosen time frame (in cpm). |
Geographic
| Parameter | Description |
|---|
| Geographic Summary - Displays a real-time geographic summary of the locations where the application is being accessed based on their response time. |
| Geographic Summary |
| Country | The country where the End User/Client is located. |
| Avg. Response Time | Average time taken by the application to respond to the transaction from the location (in ms). |
| Throughput | The number of transactions served per minute for the chosen time frame (in cpm). |
| Total Count | Number of transactions performed by the user from the location. |
| Carrier Type Summary |
| Carrier Type | The carrier type of the application where the End User/Client is located. |
| Avg. Response Time | Average time taken by the application to respond to the carrier type transactions from the carrier (in ms). |
| Throughput | The number of transactions served per minute for the chosen time frame from that carrier (in cpm). |
| Total Count | Number of transactions performed by the user from the carrier. |
Device Type
| Parameter | Description |
|---|
| Response time by Device - Displays a graphical representation of the list of devices with respect to their response times. |
| Device Summary |
| Device Name | The name of the device. |
| Platform | The OS platform of the device (Android/iOS) |
| Avg. Response Time | Average time taken by the application to respond to the transaction from the device (in ms). |
| Throughput | The number of transactions served per minute for the chosen time frame for that device (in cpm). |
App Details
| Parameter | Description |
|---|
| Response Time By Application Version - Displays a graphical representation of the list of Application Version with respect to their response times. |
| Application Version Summary |
| App Version | The version of the Application. |
| Avg. Response Time | Average time taken by the application to respond to the transaction from the mobile app for that application version (in ms). |
| Total Count | Number of times the transactions have occurred for the application version from the mobile app. |
| Throughput | The number of transactions served per minute for the chosen time frame for that application version (in cpm). |
HTTP Calls
| Parameter | Description |
|---|
| HTTP Calls |
| Transaction Name | The name of the HTTP Call invoked in the application. |
| Avg. Response Time | Average time taken by the application to respond to the HTTP Call (in ms). |
| Total Count | Number of times the HTTP call has occurred in the application. |
| Throughput | The number of transactions served per minute for the chosen time frame for that HTTP Call (in cpm). |
| 1xx | Number of 1xx errors occurred for that HTTP Call. |
| 2xx | Number of 2xx errors occurred for that HTTP Call. |
| 3xx | Number of 3xx errors occurred for that HTTP Call. |
| 4xx | Number of 4xx errors occurred for that HTTP Call. |
| 5xx | Number of 5xx errors occurred for that HTTP Call. |
| 0 | The no of errors occurred for that HTTP Call with response code 0. |
Screens
| Parameter | Description |
|---|
| Screens |
| Transaction Name | The name of the screen assessed. |
| Avg. Response Time | Average time taken by the application to respond to the screen (in ms). |
| Total Count | Number of times users have visited the transaction. |
| Throughput | The number of requests served per minute for the chosen time frame (in cpm). |
User Sessions
| Parameter | Description |
|---|
| Avg. Pages Navigated | Average number of transactions occurred during the session. |
| Avg. Viewing Time | Average amount of time for which the screens/transactions were viewed during the session (in ms). |
| Total Users | Total number of unique users visited the application. |
| Active Sessions | Total number of Active sessions |
| Live Sessions | Total number of Live sessions |
| Total Sessions | Total number of sessions that are established. |
| User Sessions |
| Start Time | Timestamp at which the session was started. |
| User Name | Name of the user establishing the session. |
| Device Name | Name of the device from which the session was established. |
| App Version | The application version in which the session is invoked. |
| Country | Name of the country from which the session was established. |
| User Experience | The experience of the user in that session. |
| Pages Navigated | The total number of pages or transactions viewed in the user session. |
| Viewing Time | Amount of time for which the application is viewed during the session (in ms). |
Click on the session to view the summary of the session details (such as User Name, Start Time, and User Experience Status) and the list of transactions present in that session along with their corresponding transaction type, Orientation and the Response time.
Crash Analytics
| Parameter | Description |
|---|
| Errors | Total number of errors occurred. |
| Screens | Total number of pages in which the error has occurred. |
| Files | Total number of files in which the error has occurred. |
| Users | Total number of affected users for which the error has occurred. |
| Errors vs Affected Users Graph - Displays a graphical representation of users and the corresponding errors with respect to their total counts. |
| Errors |
| Errors | Displays complete details about type of errors, the URL location of the error and the timestamp of its last occurrence along with their count. |
| Type | Displays the list of error types occurred along with their error count. |
| File | Displays the list of files in which the error has occurred along with their error count. |
| Screen | Displays the list of screens in which the error has occurred along with their error count. |
| App Version | Displays the list of app versions in which the error has occurred along with their error count. |
| Affected Users | Displays the list of affected users for which the error has occurred along with their error count. |
| OS Version | Displays the list of OS versions in which the error has occurred along with their error count. |
| Platform | Displays the list of platforms in which the error has occurred along with their error count. |
Click on the Errors to get details about the error like the list of files, screens, device, app version and users where the error exists, along with their corresponding timestamps.
