Mobile Applications of Applications Manager
ManageEngine Applications Manager Android App and iPhone App allows your technicians to access the Applications Manager performance data from your smartphones. With on-the-go monitoring you can reduce the time for resolution of a fault occurring in your system, thereby increasing the overall availability of your business services. Check out the blog post to know more about Applications Manager's mobile apps.
ManageEngine Applications Manager provides three options:
- Use the Android App, available in the Google Play Store.
- Use the Applications Manager iPhone App, available in the iPhone App Store.
- Use the Mobile Web Client, which can be accessed using popular Mobile Web browsers.
Optimized for most types of smart phones, Applications Manager provides a convenient method to track critical applications, perform actions, receive alerts and identify issues quickly and easily from any location.
Prerequisites for Mobile App:Click here
Configuring Applications Manager's Mobile App:Click here
- Push Notifications
- List of options available in Mobile App
- Applications Manager - Microsoft Intune specific app
Prerequisites for Mobile App
- The mobile device should be connected to the same network or establish connection via VPN, where Applications Manager server is running.
- The hostname or IP address should be reachable from the mobile.
- The minimum supported OS version for Applications Manager mobile apps:
- Android : 6.0 and above
- iOS : 11.0 and above
- Support for TFA authentication in the mobile app (android+ios) is included from v16640 in the following versions:
- Android : 2.4.0
- iOS : 2.3.3
Configuring Applications Manager's Mobile App
Follow the steps given below to configure Applications Manager's iPhone/Android app:
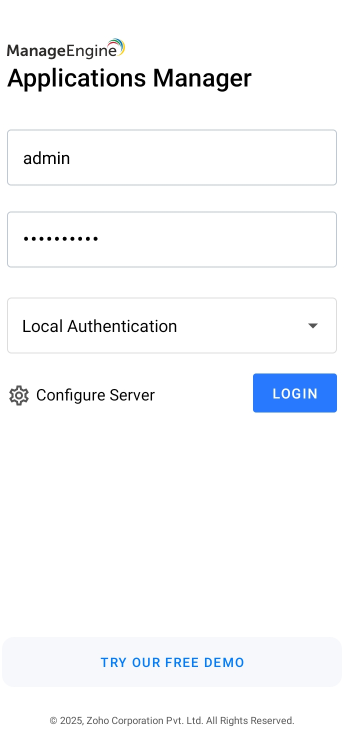
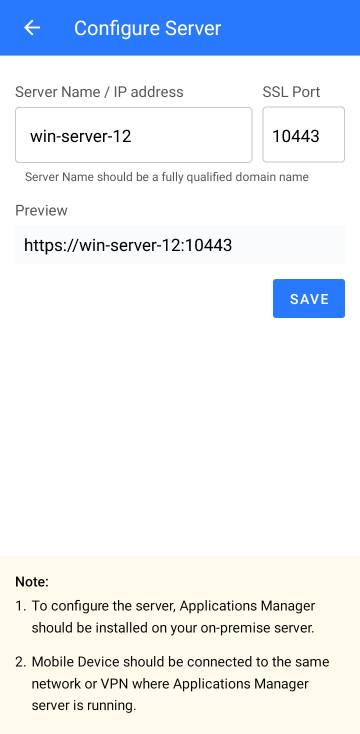
- Click on the link 'Configure Server' from the Login page, to provide Applications Manager installation details.
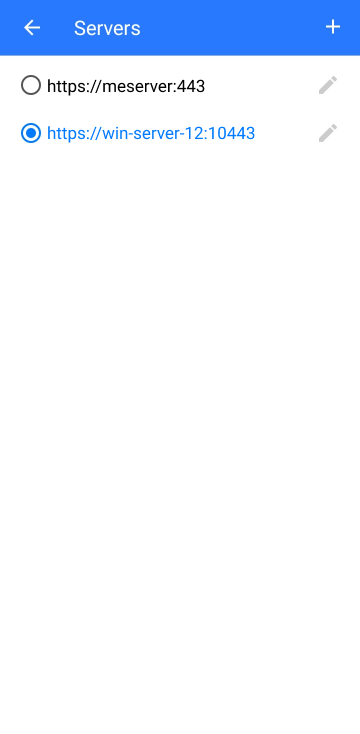
- Here, you can find options to Edit or Add Applications manager server details.
- Click on the '+' symbol and provide the Applications Manager Host Name and SSL Port. You can also use this page to add multiple installations of Applications Manager.
- Select the particular row to switch between the various installations and use the 'Sign In' button at the top of the screen to land in the Login page.
Push Notification
The iPhone/Android app provides you with push notifications for health and availability related alerts. The option will be enabled by default in Settings → Push Notifications. By default, the option to notify during a Critical Health condition will be enabled. You can receive alerts at the right time even if you are not connected to APM, with the help of push notifications.
Check for more troubleshooting steps for APM Mobile Client and Native Apps.
List of options available in Mobile App
There are six options available to navigate through Applications Manager in your mobile apps:
Home
Home page lists all the widgets which helps to enhance the user experience by giving overview into alarms, monitors, monitor types and monitor groups.
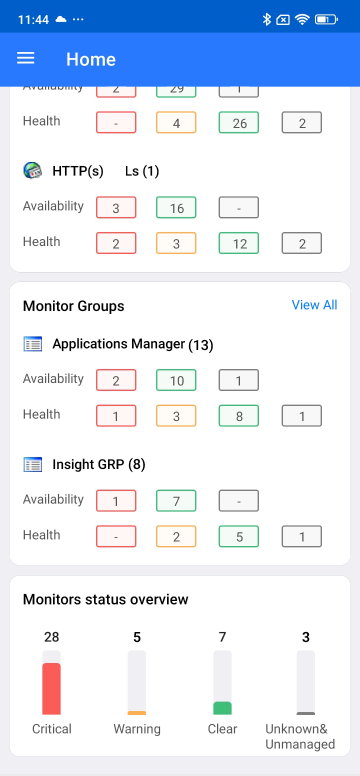
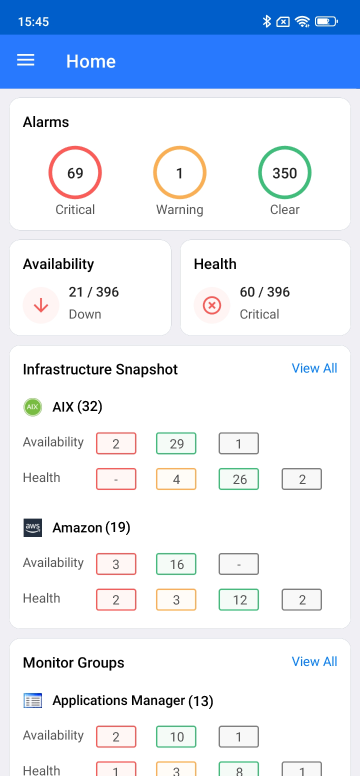
Following are the six different widgets in Home page:
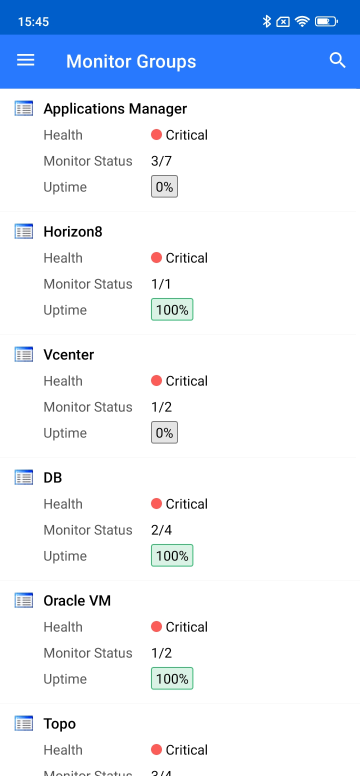
- Monitor Groups widget: The Monitor Groups Widget lists all the monitor groups categorized by their health and availability statuses. Each monitor group is visually segmented based on Health states - Critical, Warning, Clear, and Unknown as well as Availability statuses — Up, Down, and Unknown. Users can quickly gauge the status of each group at a glance, enabling swift identification of areas requiring attention. By clicking on any category within a monitor group, users can directly access a comprehensive list of the associated monitors that fall under the selected status.
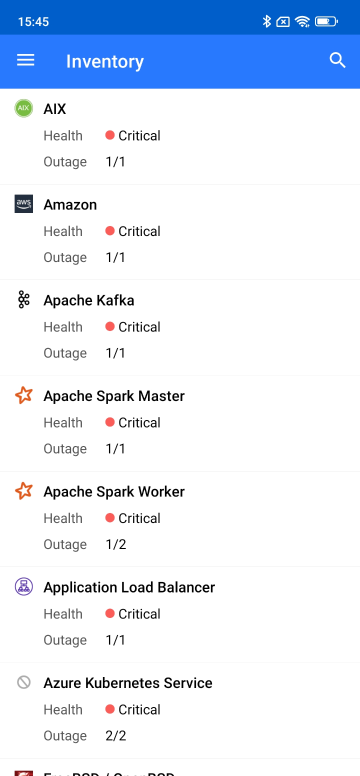
- Infrastructure/Inventory widget: The Infrastructure widget provides a streamlined view of various monitor types, categorized for quick access based on Health (Critical, Warning, Clear, Unknown) and Availability (Up, Down, Unknown) statuses. Each category is visually highlighted, offering an intuitive understanding of the system’s current state. By clicking on any status, users are presented with a detailed list of monitors falling under the selected category, enabling direct navigation to specific monitors for in-depth analysis or troubleshooting.
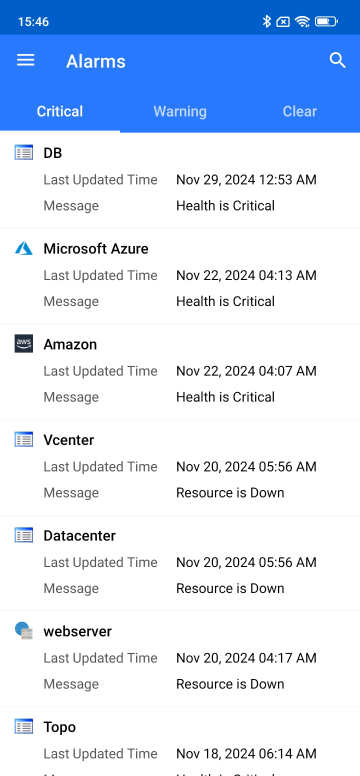
- Alarms widget: The Alarms widget serves as a centralized dashboard to monitor and manage system alarms, offering a clear overview based on alarm severity. By default, it categorizes and displays alarms with critical, warning, and clear statuses, enabling users to quickly assess the health and status of the system. This streamlined view ensures that high-priority issues, such as critical alarms, receive immediate attention while providing insights into warnings that may require monitoring or action.
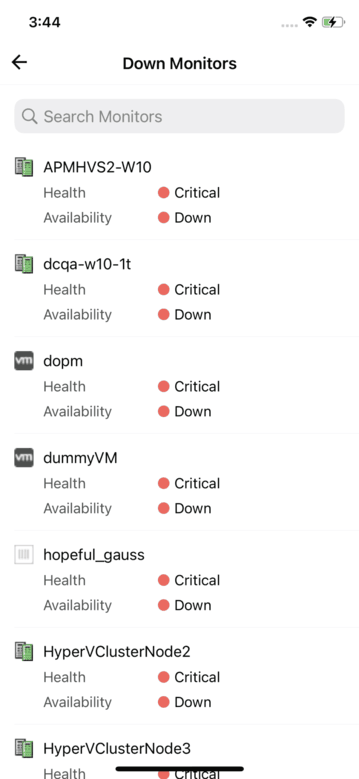
- Down Monitors widget: The Down Monitors widget displays the current status of monitored systems by displaying the number of monitors that are currently down alongside the total number of monitors being tracked. This widget serves as a crucial element for real-time system health monitoring, enabling users to quickly assess the extent of issues and prioritize their troubleshooting efforts.
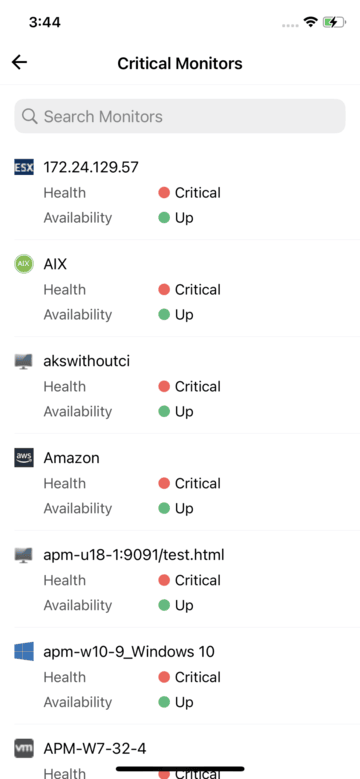
- Critical Monitors widget: The Critical Monitors widget provides a quick overview of system health by displaying the count of monitors currently in a "Critical" state alongside the total number of active monitors. This visual cue enables users to assess the proportion of critical issues at a glance. Clicking on it presents a detailed list of the monitors categorized as critical.
- Monitor Status Overview widget: The Monitor Status Overview Widget provides a comprehensive snapshot of monitor health categorized by severity levels: Critical, Warning, Clear, and Unknown/Unmanaged. This widget enables quick identification of areas requiring attention, offering an at-a-glance summary of the current state of monitors within the system. Each severity category is clearly distinguished, often with color-coded labels, to enhance usability and streamline decision-making. The widget is interactive; clicking on any category dynamically filters and displays detailed information about the monitors falling under that specific severity.
APM
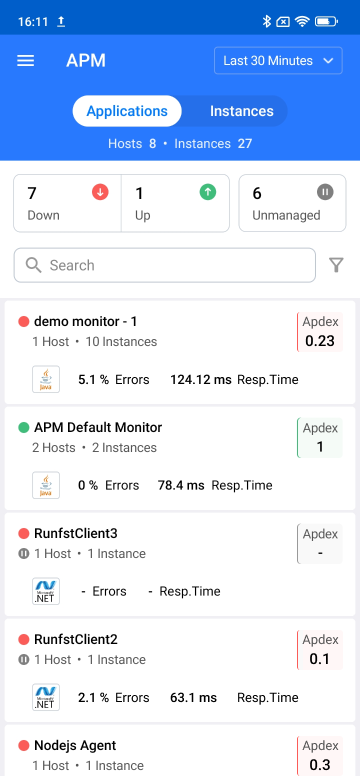
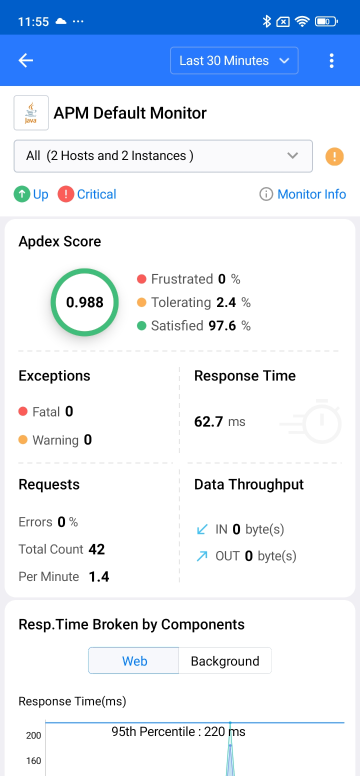
APM Insight provides a comprehensive view of applications and instances, enabling users to filter data based on criteria such as Apdex score, availability, response time, and more. Clicking on an application or instance reveals a detailed overview, allowing seamless navigation between different instances of the selected application. For quick access to alarm details, users can click on the specific severity level. Additionally, Advanced filters, including availability and time filters, are designed to enhance usability and deliver an efficient and intuitive user experience.
- Availability filter: Filter by availability like Up, Down or Unmanaged to attain a quick view of the required data.
- Time filter: You can choose to obtain the APM Insight data for any desired time period like Last 24 Hours, Yesterday, Last 7 Days, and more.
Outages
Outages lists all the ongoing and past service disruptions, helping administrators to quickly identify and resolve issues affecting application performance. It lists details about unavailable applications, services, or components, including the start time, duration, and severity of the outage.
Advanced Search
You can display the Search page from the drop-down menu at the top of the page or from the tab at the bottom. You can use the search bar to search for any keyword. The Search result will have the list of monitors or monitor groups related to the keyword along with their availability and health status. You can go to the monitor/group details page by clicking on the monitor/group name.
The seven monitoring views in the Mobile Client of Applications Manager are tailored to meet the end user's needs and provides you with effective portable monitoring of your environment.
Applications Manager - Microsoft Intune specific app
Applications Manager integrated with Microsoft Intune helps you to protect your monitoring console more efficiently on your iOS and Android devices. It enables efficient app protection and seamless hosting on mobile devices. This integration addresses critical security concerns like user authentication and data integrity. It provides you with options like Pin protection, Copy and paste restriction, Screenshot restriction and Navigation controls.
