Using ADDM
The process of working with ADDM is performed in two steps. The first step is to discover servers and applications using Network Discovery. The next is to map them using Dependency Mapping.
Note: Host servers will be discovered by default during the discovery process.
How to discover resources?
Network Discovery is the process of discovering all the resources (monitors) in a specified network. You can scan your network to discover and monitor your host servers and applications running in it.
Prerequisites: Provided credentials should have the admin/root privileges.
To discover all the monitors in a network, follow the steps given below:
- Go to New Monitor and click on Discover Monitors.
- This opens the Add New Discovery page. Alternatively, this can also be done by navigating to Settings → Add/Discover → Discovery and clicking on Add New link under Network Discovery section.
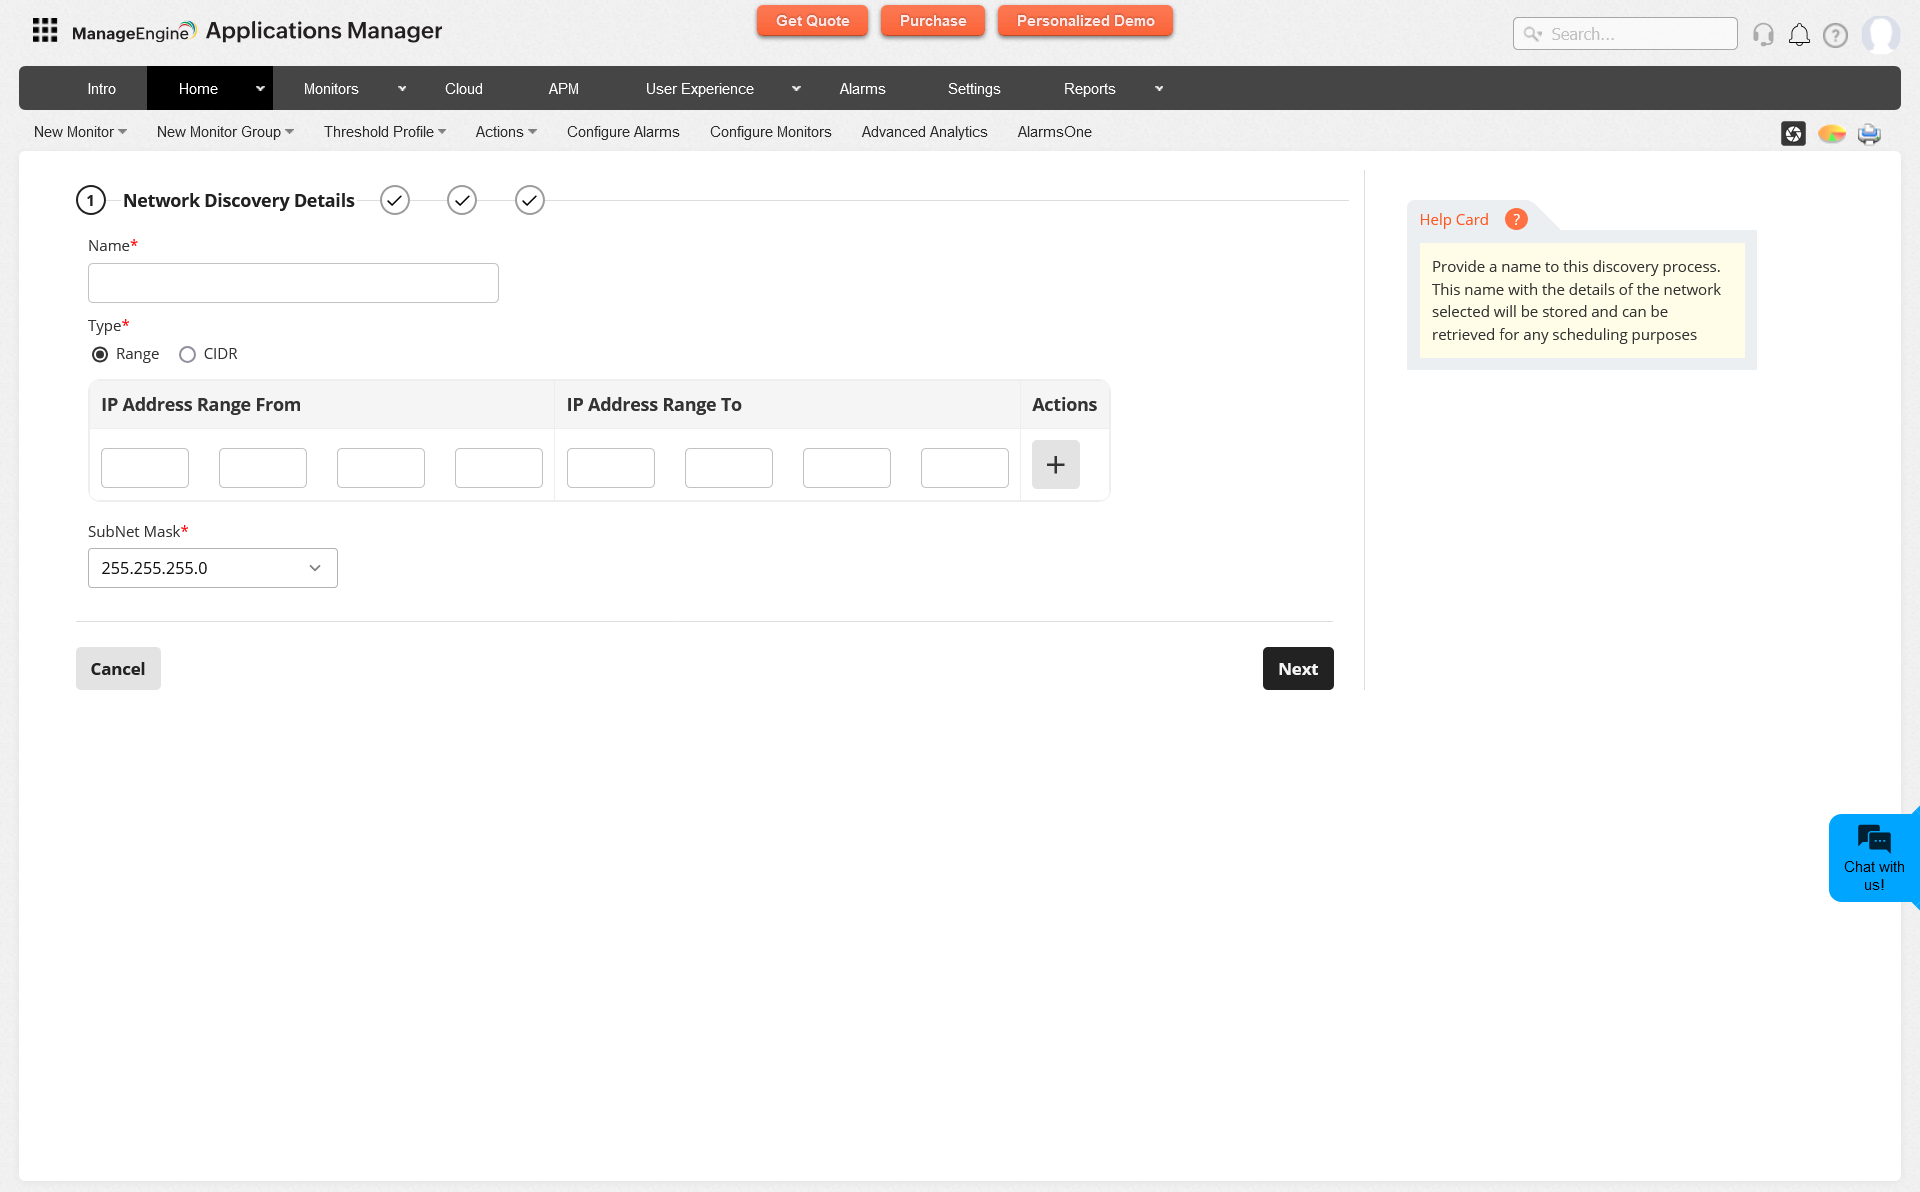
- Enter the display name for the discovery to be created.
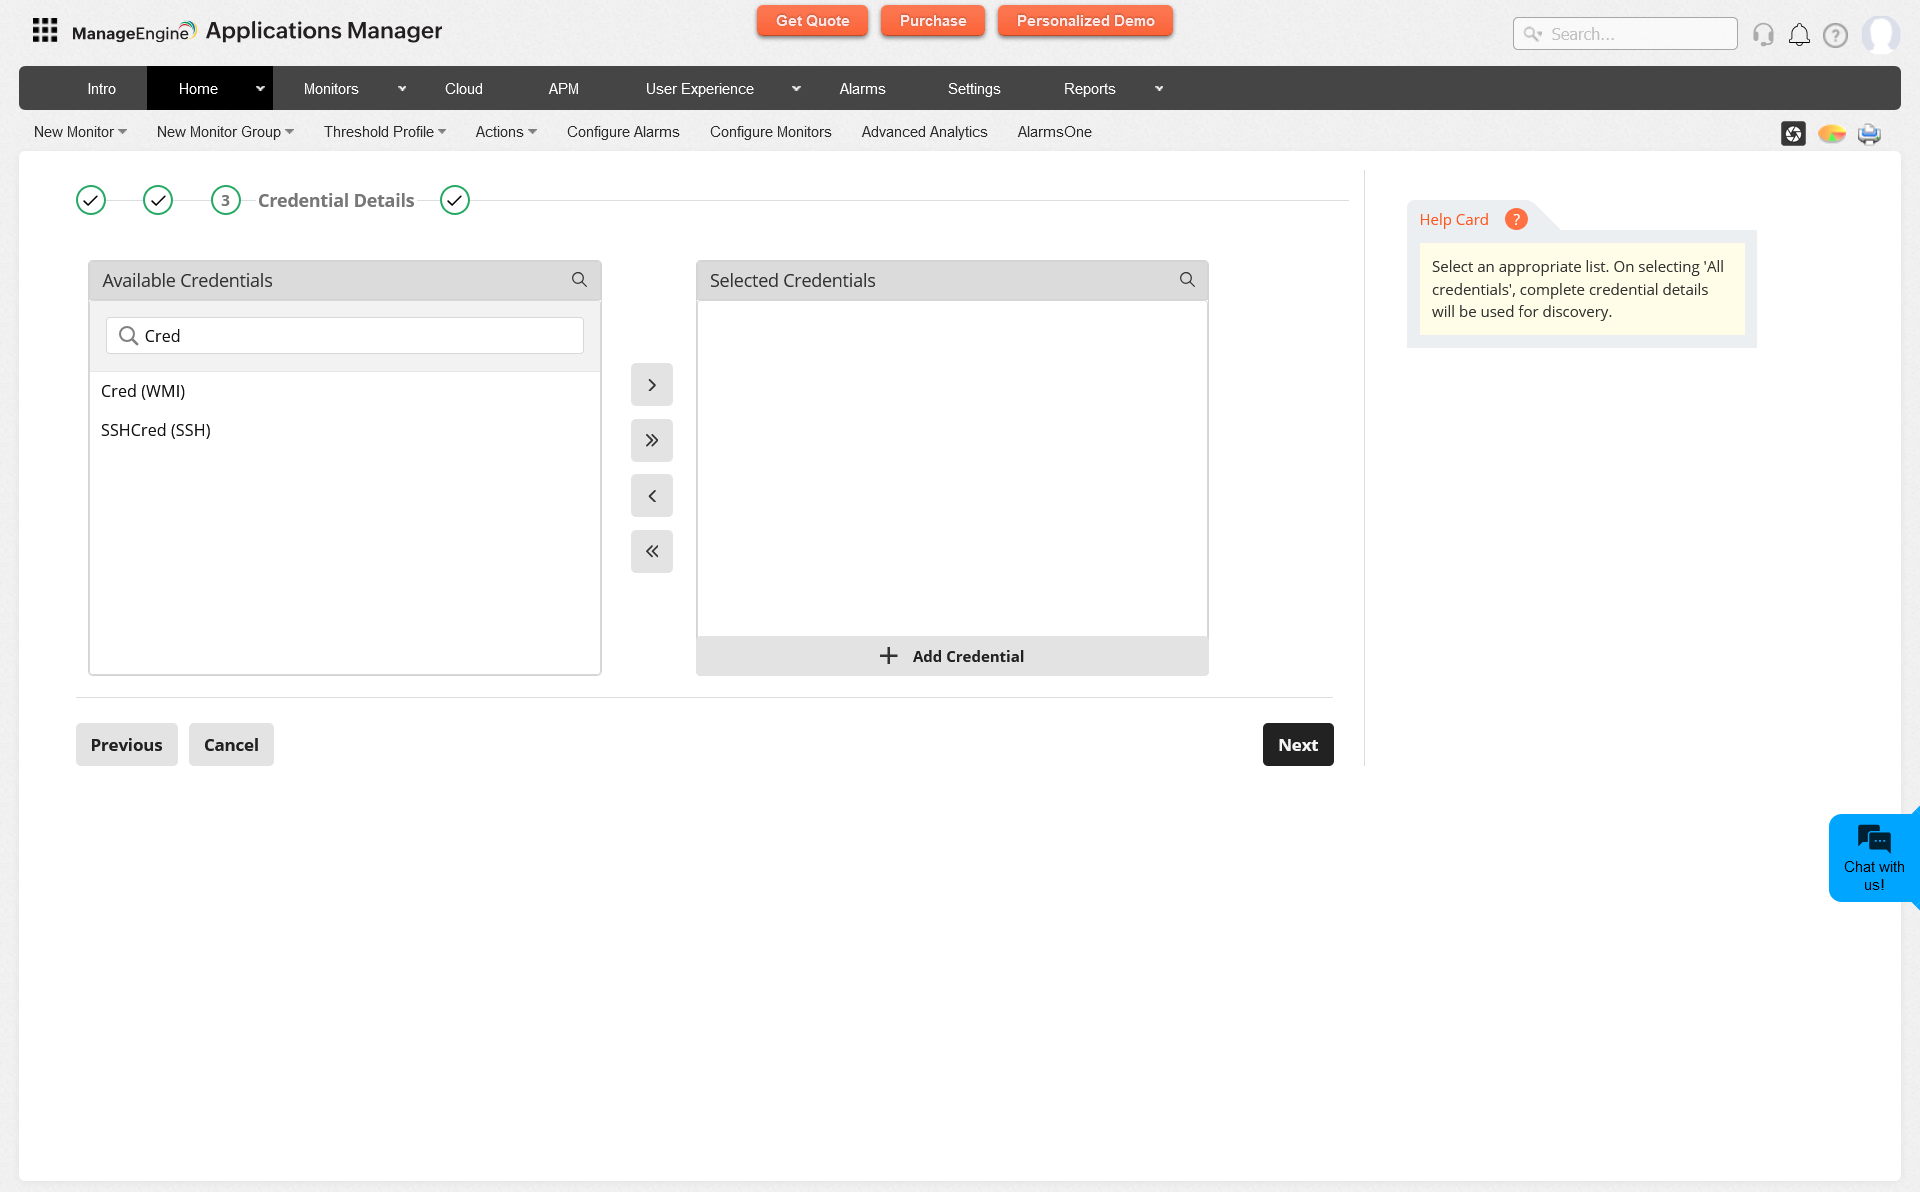
- Associate the credentials of the resources corresponding to the IP range provided either from the existing credential details using Credential Manager or by adding new credentials. In case the credentials for certain IP address are unknown, you can still discover them by enabling the option Discover unknown devices during ADDM discovery located under Settings → Global Settings, so that servers without credentials will be added as unknown server and application discovery for that unknown server will also happen.
- Select the Type with which the network IP Address should be entered for discovery.
- IP Address Range - Enter the From and To IP Address range within which the discovery should be performed. You can also provide multiple IP Address ranges (up to 10) for discovery by clicking the [+] button.
- CIDR - Enter the network address under which the discovery should be performed. You can use an IPv4 or IPv6 Address to add your network.
- VMWare - Allows you to discover the VMWare hosts from the vCenter infrastructure. Enter details such as hostname/IP address, Port, username, password and TLS Version of the vCenter. Also, you can choose to create a Virtual Infrastructure View of all the hosts and VMs associated to the vCenter infrastructure.
- Enter the SubNet Mask of the network.
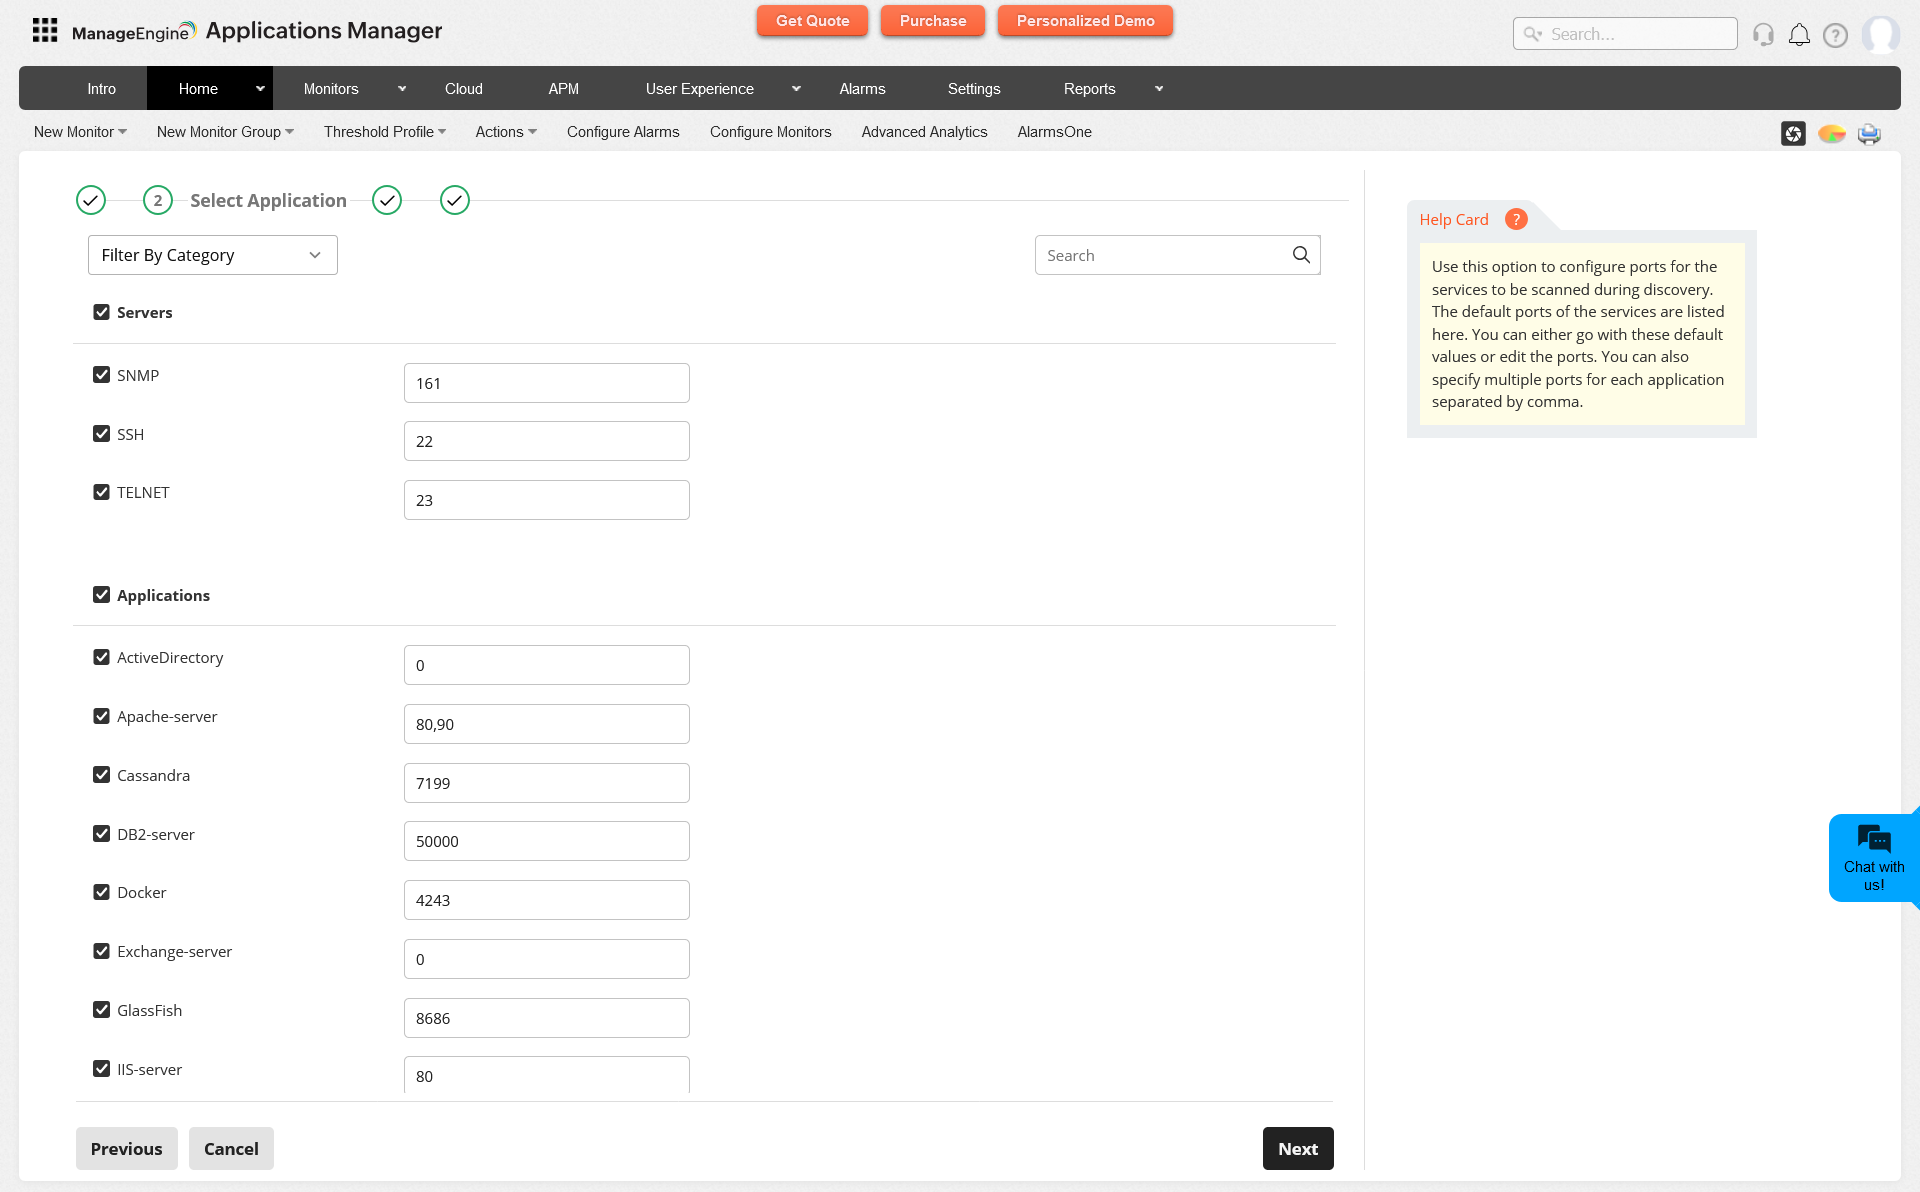
- Configure the port details for the services to be scanned during the discovery. You can either go with these default values or edit the ports. You can also specify multiple ports for each application (separated by comma) as well as disable the discovery of specific ports/applications in the Configure ports section.
- After performing the above steps, click on one of the following buttons:
- Discover: Discovers all the possible monitors available within the mentioned network. Clicking this button will display the list of all the possible resources discovered within the network, from which required monitors can be selected and added using the Add Selected Devices button.
- Discover & Add: Discovers all the monitors available within the network and add them.
Upon implementing the above steps, the discovery process is completed and you will be taken to the Network Discovery section, located under Settings → Add/Discover → Discovery. Please follow the given steps to successfully perform Network discovery.
- Step 1: Provide the details including Name and Type of the Discovery process, IP address range and Subnet mask.
- Step 2: Configure the necessary ports for the services to be scanned during the discovery. You can either choose the default ports listed in the page or edit them according to the requirement. You can also specify multiple ports for each application separated by comma.
- Step 3: Select an appropriate list of Credentials. Choosing the option All credentialswill use the complete credential details for the discovery.
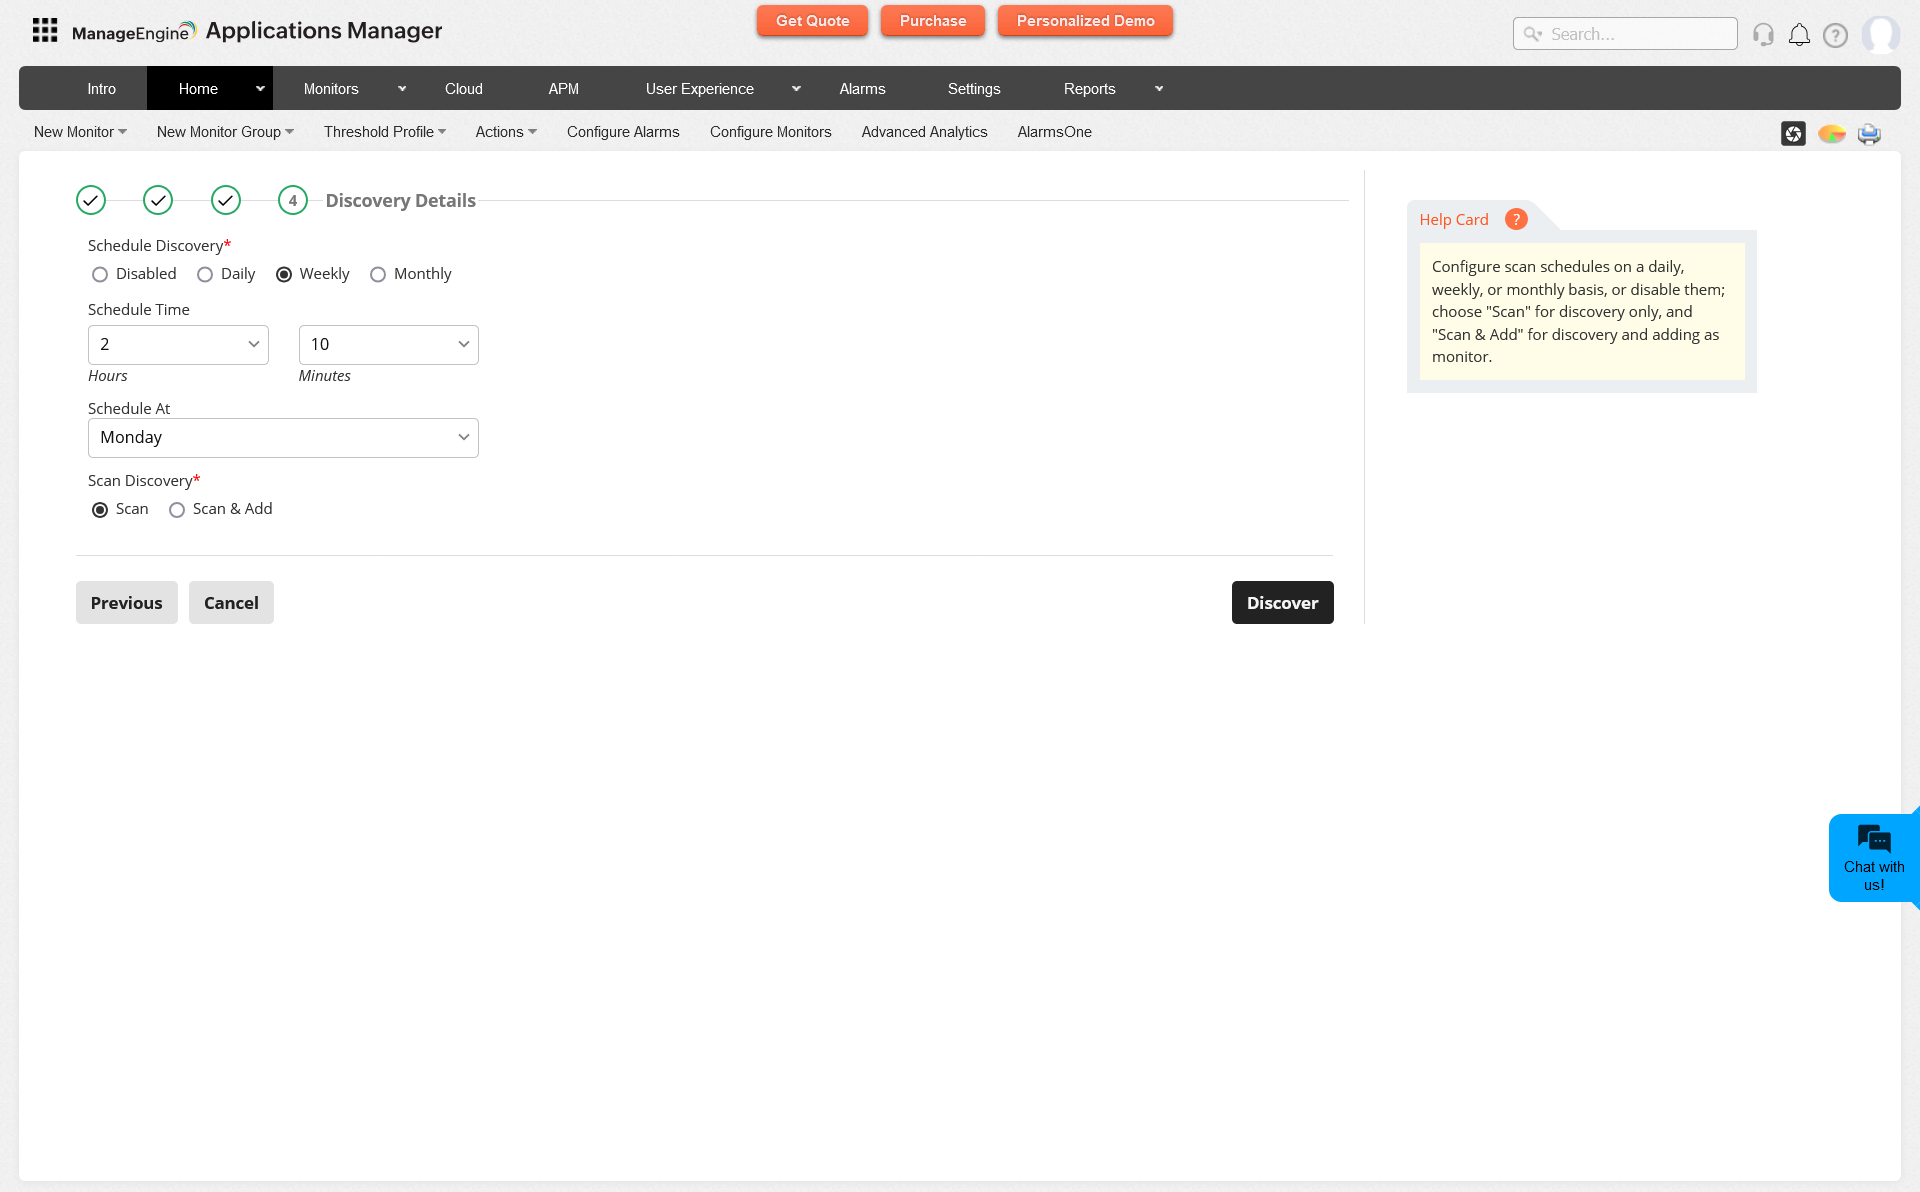
- Step 4: Schedule discovery on a Daily, Weekly or Monthly basis or disable them. Also you can either choose Scan option for discovery only or Scan & Add for discovery and adding as a monitor.
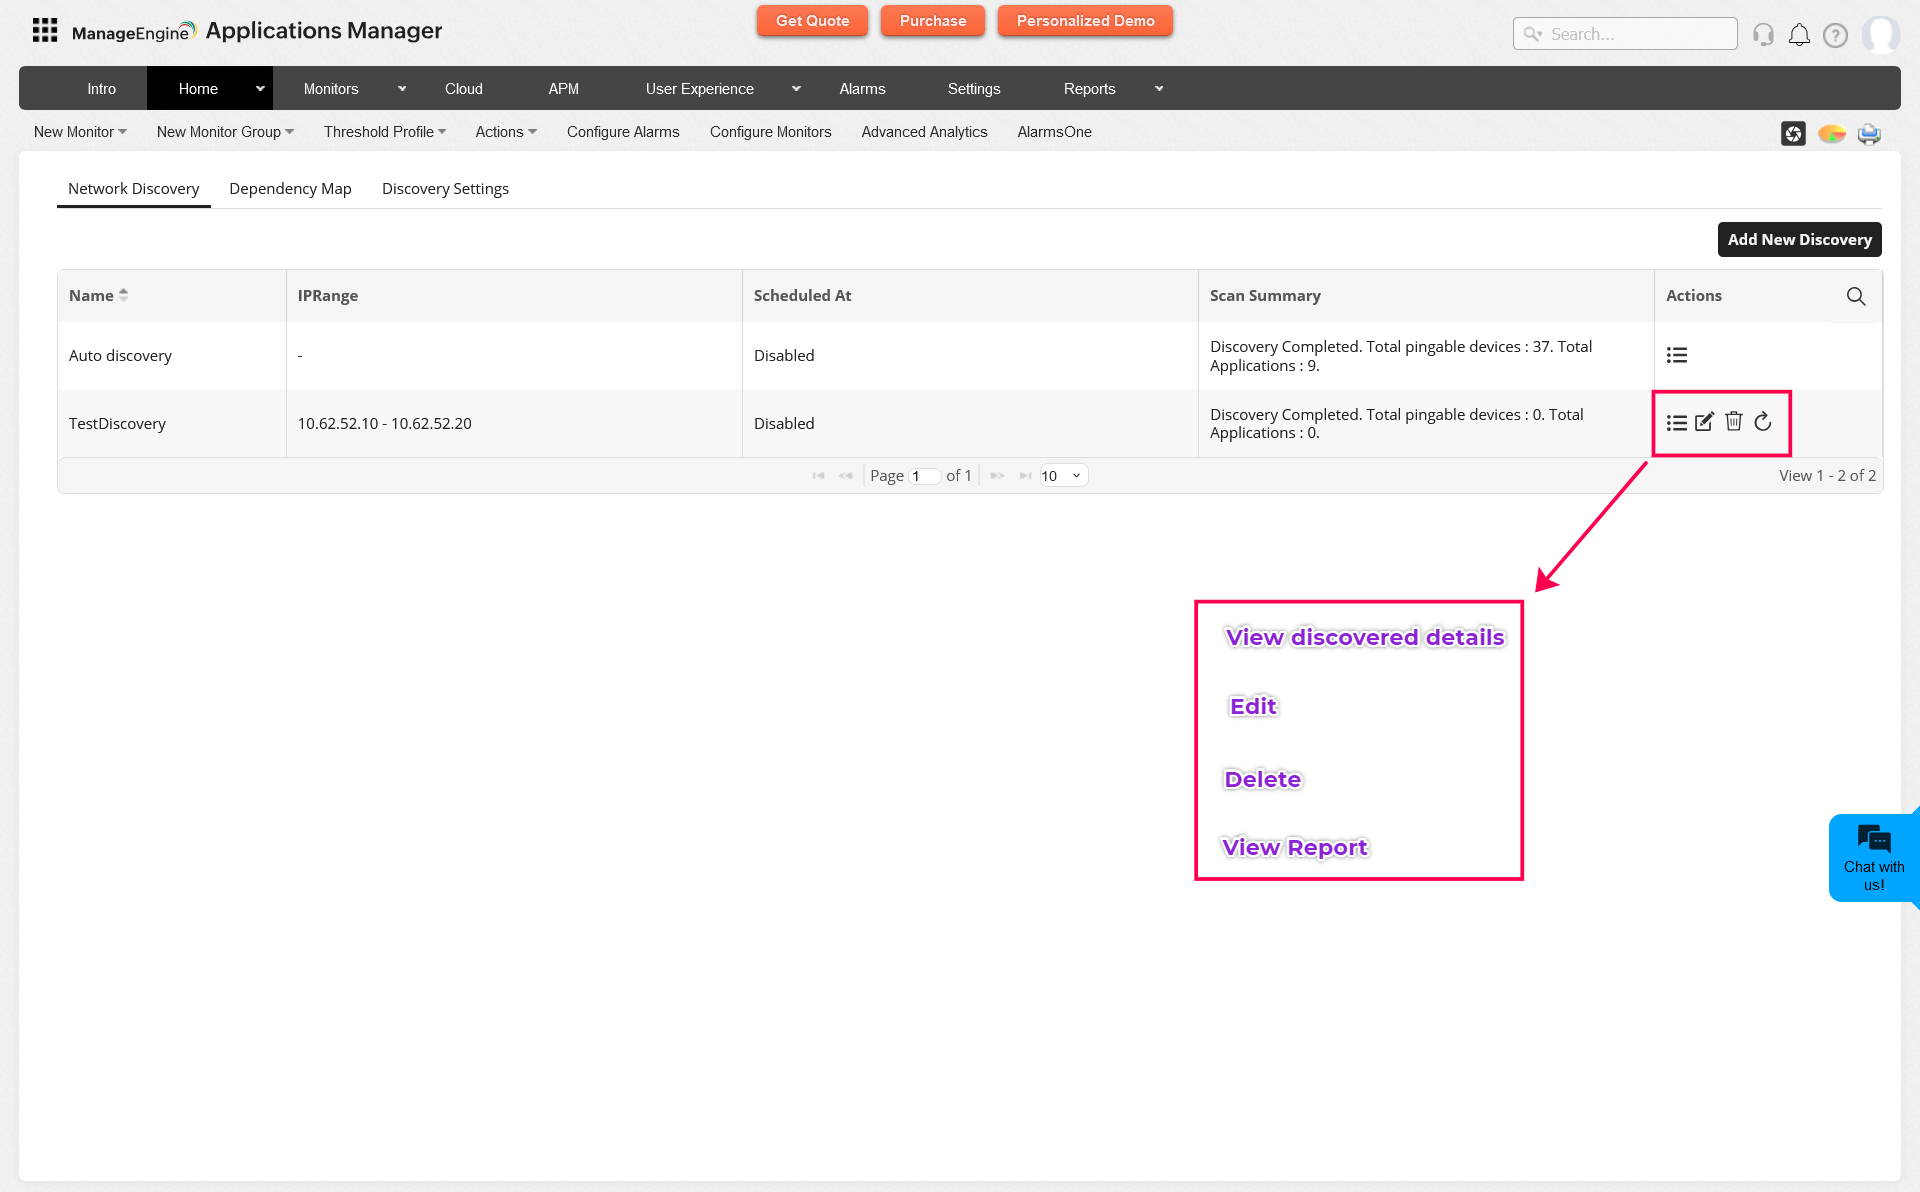
Network Discovery
The Network Discovery section is displayed once the discovery process is completed. Here you can view the list of various devices (servers & applications) that have been discovered in Applications Manager. Also, there is an option to View Application Dependency Maps. In View Application Dependency Map page, you can create a monitor group among the applications discovered through the ADDM by enabling the 'Use Application Dependency Mapping (ADM)' option. If disabled, you can create a monitor group by associating monitors manually to it.
You can perform various operations to the required discovery profiles by selecting appropriate options given below from the Network Discovery table:
- View Discovered Details: Displays the list of all the servers and applications that were discovered from the network. Here, you can select the required monitors and add them using the Add Selected Devices option.
- Edit: Allows you to edit/modify the details entered in the discovery profile.
- View Report Page: Displays the list of servers and associated applications that were discovered and added in the discovery profile. Also, there is a 'Debug' link available in the right-hand corner that shows the list of IP addresses for which credentials have not passed during discovery along with its error message.
- Delete: Allows you to delete the required discovery profile. You can delete the discovery profile by choosing either of the below two options:
- Delete discovery profile alone: Deletes only the discovery profile and excludes the monitors associated with it.
- Delete monitors from this discovery: Allows you to delete the selected monitors associated with the discovery profile. Here you can select the required monitors that need to be deleted and clicking on the Delete button will delete the monitors. Also, there is an option to delete the discovery profile, enabling which will delete the discovery profile. You can also delete the vCenter Infrastructure associated with the profile, enabling which will delete the vCenter Infrastructure along with the ESXi hosts associated with it.
- Schedule discovery: Allows you to schedule discovery in Daily, Weekly, or Monthly basis.
- Rediscover: While selecting Rediscover Now icon, discovery will get started using the configured details in the profile.
How to map dependencies?
After the resources are discovered and added with network discovery, the next step is to map dependencies between them with the help of Dependency Mapping. To learn more about Dependency Mapping, refer here.
Additional options for ADDM
Following are the list of options that can be configured in the Global Settings page under Settings tab:
- Show servers in Application Dependency Mapping - By selecting this option, servers details will also be displayed along with application dependency in Business view.
- Discover unknown devices during ADDM discovery - Enabling this option will result in Applications Manager adding servers and applications for which credentials have not passed.
- Restart failed discoveries on startup - Enabling this option will restart failed discoveries during startup.
- Enable ADDM dependency view - On enabling this option, the View Application Dependency Map option in the Discovery reports page redirects to create new dependency map option. On disabling, it redirects to Business view.
