REST API Sequence Monitoring
Overview
Modern web applications are built with an complex mix of HTML and API calls ie. applications are highly dependent on REST API calls to retrieve the data or perform an actions. When an API call fails, it can affect complete workflow of the application. Therefore, it is important to monitor each API call. REST API Sequence monitor is meant to monitor the complete workflow of REST-based mobile and web applications.
Creating a new REST API Sequence monitor
To configure REST API Sequence monitor, follow the steps mentioned below:
- Click on Add New Monitor link under New Monitor. Select REST API Sequence.
- Enter Display Name of the monitor.
- Specify the polling interval for which the status of the monitor should be updated (in minutes).
- Provide the transaction steps that are to be monitored. Each step represents an API call in your application's workflow. Transaction steps can be added by choosing any one of the following options:
- Import Steps: This option allows you to add the transaction steps by importing the recorded API transactions from the HAR file generated by the web browser. Click here to learn about generating HAR file
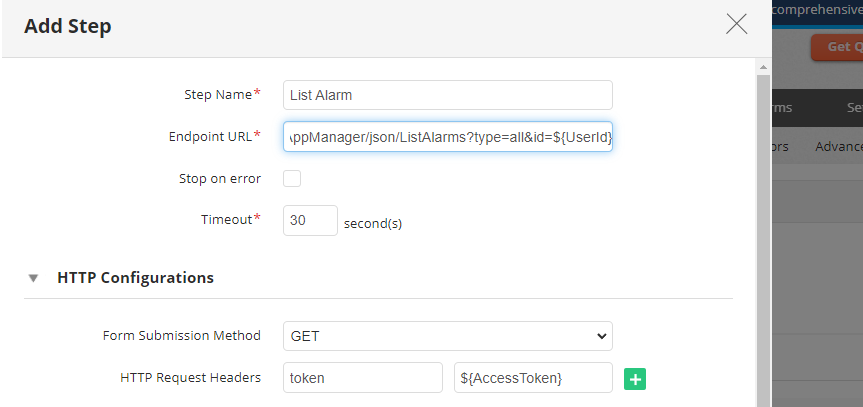
Add Step: This options lets you to add the transaction steps manually into the monitor. After selecting this option, enter the following details:
- Specify the step name that is to be added.
- Enter the Endpoint URL of the REST API to be monitored. The URL must be in HTTP/HTTPS.
Enable the Stop on error option to make the monitor down when the step fails and stop further execution of steps.
Note:
- When the Stop on error option is enabled for the API step, it means that if the API call within the sequence encounters an error or failure, the data collection for the rest of the APIs in the sequence will be stopped. Additionally, the REST API sequence itself will be down immediately. This behaviour ensures that if a critical API within the sequence fails, the monitoring process is halted to prevent any further actions. By stopping the data collection for the remaining APIs and marking the REST API sequence as down, it allows for quick identification and notification of the issue, ensuring that potential problems are addressed promptly.
- On the other hand, if the Stop on error option is disabled for API steps, the monitoring process will continue executing the remaining API calls in the sequence even if errors are encountered along the way. This can be beneficial if you want to collect data or perform additional actions despite individual API calls failing.
- Specify the Timeout in seconds.
- Select the Form Submission Method used to access the API request using any one of the following HTTP methods: GET, POST, PUT, or DELETE.
- If you select POST or PUT method, you will be asked to choose the Request Body Type from the following options:
- FORM: If you select this, enter the Request body in a line-by-line format
- Text: If you select this, enter the Request body in text format
- XML: If you select this, enter the Request body in XML format
- JSON: If you select this, enter the Request body in JSON format
- Configure the HTTP Request Headers required to establish a connection with the API server.
- Enter the credential details for user authentication, if required. or select credentials from a Credential Manager list. Choose None if no authentication is required. You can choose any of the following options:
- Basic authentication: Authenticates the REST API endpoint using basic credentials such as username and password.
- Credential Manager: Authenticates the REST API endpoint by selecting credentials from Credential Manager.
- OAuth Token: Authenticates the REST API endpoint using an OAuth Provider.
- Web Token: Authenticates the REST API endpoint using a Web Token.
Specify the list of success status code(s) that indicate successful response, separated by commas. Example:202,200
You can also provide the status code range separated with a colon. Example:200:250
- Specify the Response Type to be expected. For XML and JSON response, user can define specific response values to monitor in the Response Details tab in the Monitor Details page.
- Enable the Add content check for response checkbox if you wish to perform content check in the API response. Once enabled, perform the following steps:
- Specify the contents that should contain and/or should not contain while performing the check in the API response.
- Enable the Do case sensitive keyword search checkbox if you wish to perform a content check for case-sensitive character strings.
Enable the Regular Expression checkbox if you wish to perform a content check based on regular expressions. (Refer Regex Guide for more info)
Note:
- Ensure that the content you try to match is present in the API response.
- The content search is case-sensitive. If you provide two or more words, the content match is performed for the words separately. Space character will be acting as the delimiter.
- For example, if you specify the content as 'applications manager', the match is found for 'applications' and 'manager' separately. If you need the content match to be performed for the complete text, specify the two words in quotes, like "applications manager".
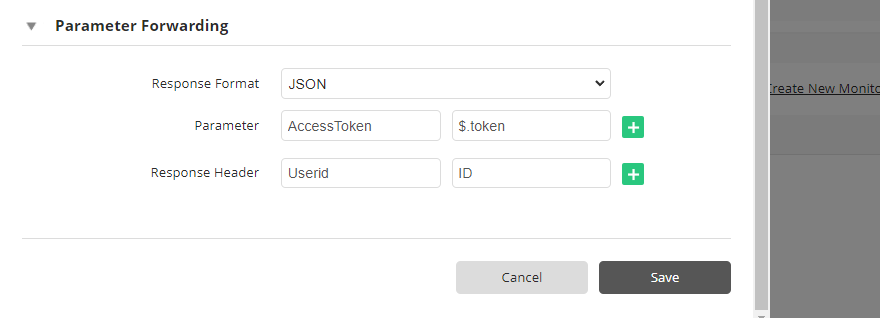
- Select Response Format based on which values are to be extracted for parameter forwarding. Individual values from responses can be extracted using regular expressions, JSONPath expressions or XPath expressions for parameter forwarding. (Text, XML, or JSON)
Provide additional parameters required to fetch the values from the API response, in the form of 'name-value' pair. The value should be provided based on the API response type. ie.
- For TEXT, provide value as regular expression.
- For JSON, provide value as JSONPath expression.
- For XML provide value as XPath expression.
Refer Parameter Forwarding to know more.- In the Response Header field, provide a name and a regular expression to fetch the required values from the API response for use in the successive request.
After entering all the above details, click Save.
- Choose the Monitor Group from the combo box with which you want to associate REST API Sequence monitor (optional). You can choose multiple groups to associate your monitor.
- Click Add Monitor(s). This discovers the REST API sequence from the network and starts monitoring.
Note:
- A maximum of 25 steps are allowed to be added to a monitor.
- Security/firewall requirement: The API should be accessible from the machine where the Applications Manager server is running.
- User privilege: The required credentials should be provided to read the API response.
Parameter Forwarding
Parameter forwarding can be used to pass data and test data validation between chained requests. Individual values from API response are extracted using XPath, JSONPath, or Regular expressions and can be saved as custom parameters. Also, values can be extracted from response headers using a regular expression. These parameters can then be used to build custom query strings or POST data for subsequent steps. Based on your selection of Text, XML or JSON-based response data format, you can build custom Regex-based expressions, XPath expressions, or JSONPath based expression assertions. Upon invoking ${Parameter} argument into the HTTP requests of your successive steps, the output value of the invoked expression assertion will be used in these steps for various step validation scenarios.
Monitored Parameters
Go to the Monitors Category View by clicking the Monitors tab. Click on REST API Sequence under the Web Server/Services section. Displayed is the REST API Sequence Monitor's bulk configuration view distributed into three tabs:
- Availability tab gives the Availability history for the past 24 hours or 30 days.
- Performance tab gives the Health Status and events for the past 24 hours or 30 days.
- List view enables you to perform bulk admin configurations.
Following are the list of metrics shown in the REST API Sequence Monitor in their corresponding tabs:
Performance Overview
| Parameter | Description |
|---|---|
| Average Response Time | Average time taken to obtain complete response of all the APIs in the sequence (in ms). |
| Transaction Time | Total time taken to complete all the transactions in the sequence (in ms). |
| Step Response Time | Total time taken to obtain response of the API in a recorded step (in ms). |
| Page Size | Total response size of the API in a recorded step (in bytes). |
Response Details
| Parameter | Description |
|---|---|
| REST API Sequence | |
| Step Name | Name of the recorded step. |
| Response Time | Time taken to obtain response of the API in a recorded step (in ms). |
| DNS Time | Amount of time spent for resolving domain name for the request (in ms). |
| Connection Time | Amount of time spent for establishing TCP connection with server (in ms). |
| First Byte Time | Amount of time taken from when the connection to the server established until the first response starts coming in for the API (in ms). |
| Download Time | Amount of time taken for receiving last byte of the response for the API (in ms). |
| Page Size | Total response size of the API in a recorded step (in bytes). |
| Response Code | Indicates whether a specific HTTP request has been successfully completed. Interpreted from numeric values:
|
| Response | Displays the response of the API obtained in the recorded step. You can also monitor specific values by defining custom attributes in the API response. Learn more |
Custom attributes in API response
To customize your own attributes to monitor specific values in the API response, go to the Response Details tab of the REST API Sequence monitor and select the Response icon. A pop-up window displaying the custom attribute option will open. Click here to learn more about custom attributes.
