Script Monitor
- Script Monitor - An Overview
- Creating a new Script Monitor
- Configuring scripts based on Script Type
- Output Settings - Sample Input
- Output Settings - Sample Output file
- Overriding Availability and Response Time of the Script
- Monitoring SNMP OIDs
- Monitoring UDP Port
- Monitored Parameters
- Custom Monitor Types
- Enabling Configure Alarms Template for script monitor
Script Monitor - An Overview
Custom script monitoring can be challenging if script outputs need to be manually tracked. To simplify this, Applications Manager provides a Script Monitoring functionality that automatically tracks the output of custom scripts (Windows, Linux, or Solaris) and generates alarms based on the configured thresholds.
Note: This feature provides ready-to-use templates for Linux shell and Windows batch scripts, while also enabling indirect support for PowerShell, Perl, and Python scripts. These can be embedded within .sh or .bat scripts for monitoring purposes. It allows you to monitor scripts on local or remote systems, transfer the output to an output file, parse the results, and execute configured actions automatically.
By automating the monitoring of in-house ad-hoc scripts, this functionality eliminates the need for manual intervention, ensuring seamless tracking and issue resolution.
- During creation of a new script monitor, you must give the location of the custom script (local / remote), attributes (numeric/string) to be monitored, the Output File in which the output is going to be redirected and the polling interval.
- Based on the polling interval, Applications Manager executes the script.
- The script will transfer its output to the Output File configured. The output of the script should be in a Key=Value format where '=' can be any delimiter.
- Applications Manager parses the Output File and executes the actions configured. It enables you to alert an Administrator or automatically take corrective actions by way executing other OS scripts.
- Reports for the attributes configured would be shown as graphs. Option to enable or disable reports is given.
- Since the script execution relies on user's environment and the credentials provided, it is important that the monitored script has the required permissions for executing the script to ensure smooth output monitoring functionality and to prevent any potential vulnerability issues.
- If the product has domain admin privilege, users can execute scripts in any device. Use at your own discretion.
Creating a new Script Monitor
Prerequisites for monitoring Script metrics: Click here
Using the REST API to add a new Script monitor:Click here
To add a Script Monitor, follow the given steps:
- Click New Monitor. Choose Script Monitor
- Enter the Display Name of the Monitor.
- Specify the Script Location whether the script to be monitored is present in the Local Server or in a Remote Server.
- If the script is in Local Server, give the absolute path of the script to be monitored under Script / Command to Monitor and also the absolute path of the directory from which the script should be executed under Execution Directory. The execution directory should be in the same hierarchy as that of the directory structure of the script to be monitored specified in the Script / Command to Monitor field.
- If the script is in a Remote Server, select the required host from the dropdown list. If the remote server is a new host, then specify the following details to create a new host:
- Enter the Host Name / IP Address of the server.
- Choose the Mode of Monitoring - Telnet, SSH or Powershell.
- If Telnet is selected, provide the user name, password, and port number (default is 23) of the server.
- If SSH is selected, provide the user name, password and port number (default is 22) of the server. You have an option to give Public Key Authentication (User name and Private Key). You can also give a Passphraseif the private key is protected with one.
Note: To identify the Public/Private key, go to command prompt, type cd.SSH/ then from the list, open the files <id_dsa.pub>/<id_rsa.pub> [Public] or <id_dsa>/<id_rsa>[Private] to get the keys.
- If Powershell is selected, provide the user name and password of the server.
- Enter the credential details like user name and password for authentication, or select the required credentials from the Credential Manager list after enabling the Select from Credential list option.
- For Telnet/SSH mode of monitoring, specify the command prompt value, which is the last character in your command prompt. Default value is $ and possible values are >, #, etc.Note: In the server which you are trying to monitor through SSH, the PasswordAuthentication variable should be set as 'yes' for the data collection to happen. To ensure this, access the file /etc/ssh/sshd_config and verify the value of PasswordAuthentication variable. If it is set as 'no', modify it to 'yes'and restart the SSH Daemon using the command /etc/rc.d/sshd restart.
- Select the Script Type as Command or Script/Batch file. Learn more
- Specify the absolute path of the Script / Command to be monitored.
- Specify the absolute path of the Execution Directory from which the script should be executed. The execution directory should in the same hierarchy of the script to be monitored directory structure.
- Specify the Shell Type in which script should be executed. By default, it is sh.
- Enable the Output Settings checkbox to configure output settings. View sample input
- Check the Get output from file checkbox and specify the path of the file. If the checkbox is not checked, Applications Manager takes the output from the output stream. View sample output file
- Enter the String and Numeric attributes (one attribute per line).
- Enter the value of Delimiter used in the output file. By default, it is "=". If you don't specify a delimiter, then 'space' would be considered as a delimiter.
- If you want to monitor a tabular output file, then enable the Tables in output file checkbox and enter the details of the tables - Table Name, String and Numeric column attributes, delimiter and also specify which attribute is the Unique Column. Make sure to specify the table details entered above, in the output file.
- In order to identify a tabular output file, execute the following commands before and after the actual script:
echo <--table <table-name> starts-->
[Script Commands]
echo <--table <table-name> ends-->
This would enable Applications Manager to identify the output file's table. - Even if you are using a command instead of a script as input, then the output of the command should be in the above format. It is also mandatory to have the headers and footer in the command output as the first line in the file.
- In order to identify a tabular output file, execute the following commands before and after the actual script:
- If a table row is unavailable in the next poll, you can configure appropriate table row actions (Retain, Delete or Unmanage) by enabling the Manage Table Row option.
- If no table rows are available in the output file, you can configure appropriate health severity (Critical, Warning, or Clear) by enabling the Manage Table Data option.
- Enable the 'Affect health when exception occurs' option if you want to configure health severity based on exceptions occurred in the scripts.Note: This option can be configured by enabling under Settings → Performance Polling → Optimize Data Collection → Script/Database Query Monitors.
- Specify the Arguments. For e.g., hostname 80 http
- Set the Polling Interval. By default, it is 5 minutes
- Specify the Timeout value in seconds, which is the maximum time taken by the script to execute.
- Choose the Monitor Group from the combo box to which you want to associate the monitor (optional).
- Click Add Monitor(s). This will add the script monitor and starts monitoring them.
- Remote Windows script monitoring is supported only in Powershell mode of monitoring.
- Script/Command to monitor should not contain whitespace(s) for Powershell mode of monitoring.
- Output file is mandatory when Output Settings option is enabled for Powershell mode of monitoring.
Configuring scripts based on Script Type
- If you choose the Script Type as Command:
- Command length must not exceed 255 characters.
- Linux commands must not contain backslash (\)
- Click here to view example command
- If you choose the Script Type as Script / Batch:
- Any script in a Local Windows serverwill be executed as,cmd /C [ScriptName] [Arguments]Example: cmd /C D:\testScript.bat hostname username password.
- To execute a VBS, Powershell or any script that is not a batch file:
- The script should write the output to command prompt or file.
- You can also execute files by embedding them inside a Batch script and using the Batch script for monitoring. Click here to view example script
- You can also execute script directly as a command without having to use another batch file:
C:\windows\system32\cscript.exe D:\testFile.vbs hostname username > outputfile.txt - Arguments can be used in the script.
- Any script in a Local Windows serverwill be executed as,
- For Local and Remote non-Windows script monitoring:
- Provide proper "Shell Type" for executing the scripts. By default "sh" is used.
- You can also execute script directly as a command: sh ./test.sh
Note: The user must have permission to execute the script and read/write permission for Output file.
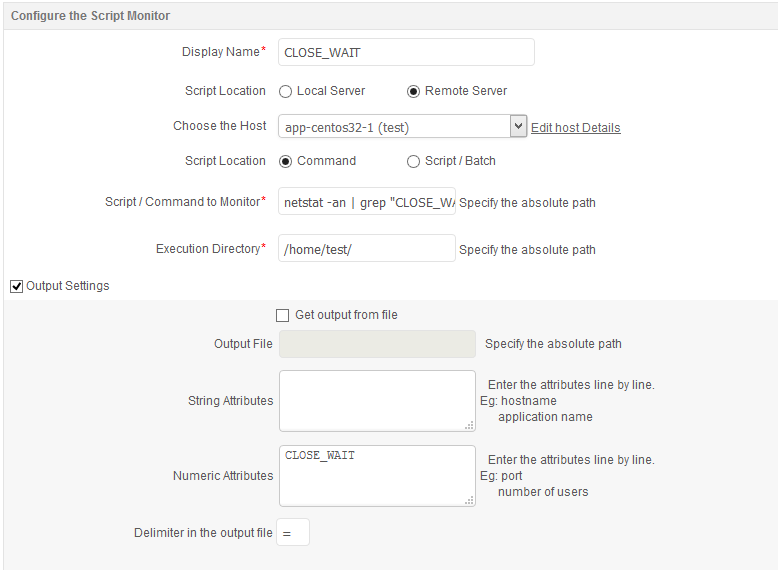
Example Command
Command: netstat -an | grep "CLOSE_WAIT" | wc -l | awk '{print "CLOSE_WAIT=" $1}'
Example Scripts
To Execute VBS files:
- To execute testFile.vbs, embed it inside a batch script testScript.bat
- Contents of testScript.bat file:
c:\windows\system32\cscript.exe D:\testFile.vbs > outputFile.txt
- Add testScript.bat for monitoring and use outputFile.txt to get Output.
To Execute a Powershell file:
- To execute test.ps1, embed it inside a batch script testScript.bat
- Content of test.bat:
PowerShell.exe -NoProfile -ExecutionPolicy Bypass -Command
- Add test.bat file for monitoring and use outputFile.txt to get Output.
- PowerShell script must be executed with -NoProfile -ExecutionPolicy Bypass
- Need to add "-encoding ascii" for output files created via powershell.
Output Settings - Sample Input
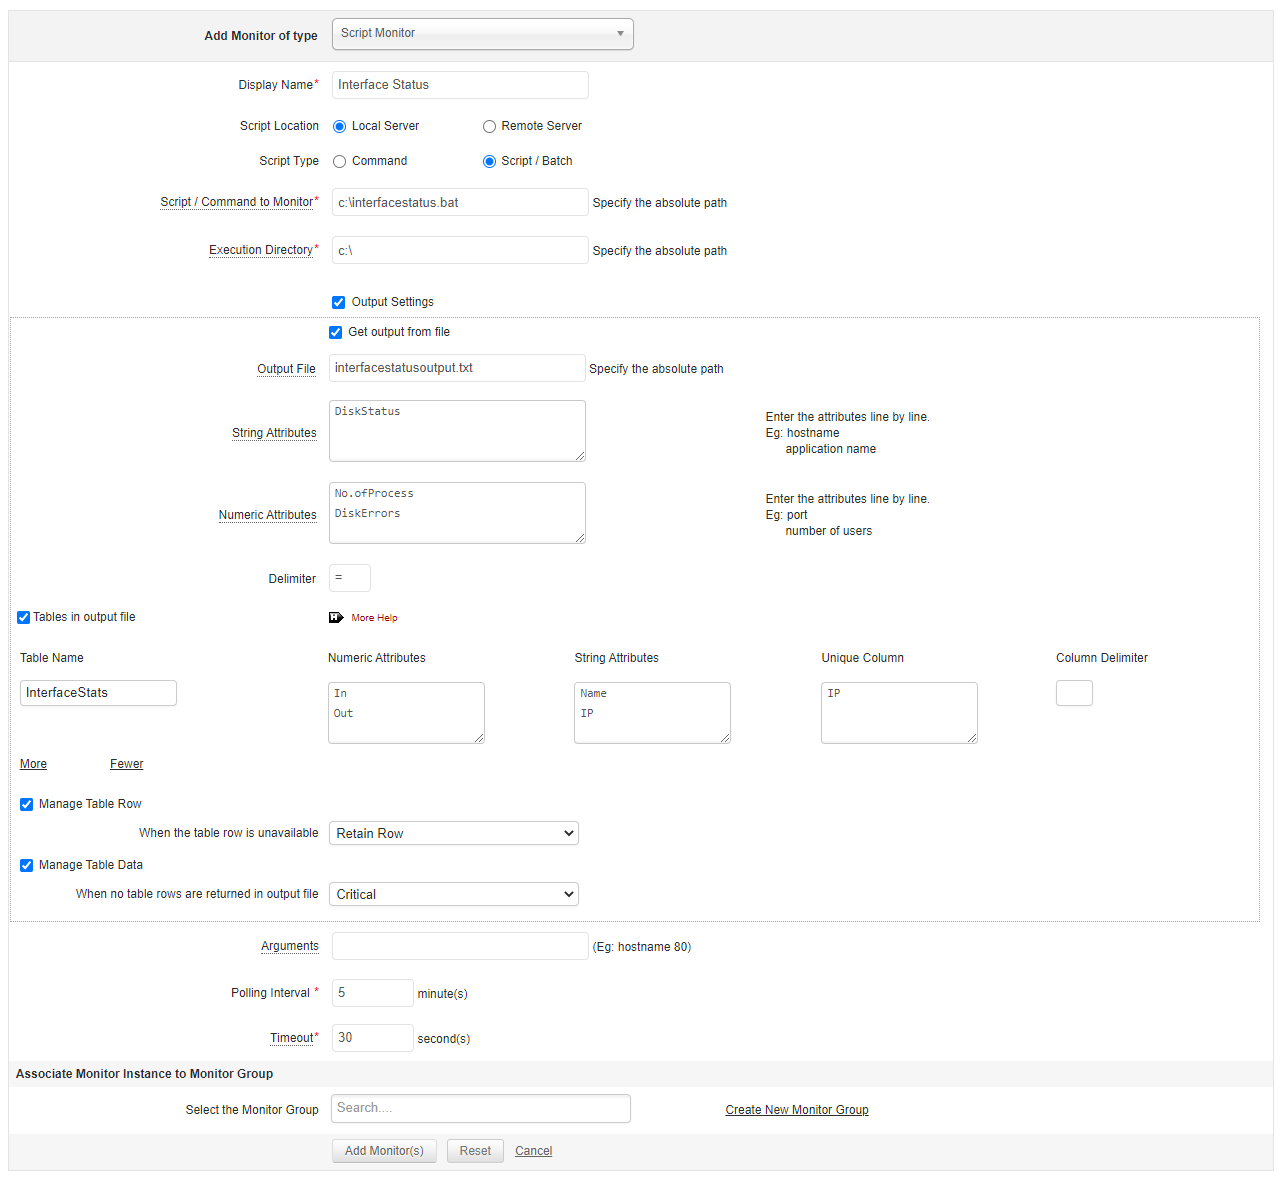
To monitor a script interfacestatus.bat that creates a user defined table called InterfaceStats and user defined parameters like DiskStatus, DiskErrors and No. ofProcess, in the output file interfacestatusoutput.txt
- In the Script Monitor additon page, give the absolute path of the script : c:\interfacestatus.bat
- Under Output settings, specify the absolute path of Output file: c:\interfacestatusoutput.txt
- Give DiskStatus as the string attribute, No.ofProcess and DiskErrors as the numeric attributes with Delimiter as "="
- To monitor statistics in a table format , select Tables in output file. Here, we have the table InterfaceStats with the stats Name, IP, In, Out where Name, IP are String Attributes and In, Out are Numeric Attributes. The Delimiter is the separator between the two column names i.e. whitespace. If tab space is the delimiter, then give \tas the value. Usually tab will be the delimiter for SQL query results.
Note: Choose appropriately unique columns for this option. Selecting frequently updated data such as timestamp will create a loss in report data and may the affect the overall performance of the monitor.
- Unique Column is the attribute that does not repeat itself in the rows and identify the row by that value. Here it is IP.
Output Settings - Sample output file
The starting tag of the table, InterfaceStats is "<--table InterfaceStats starts-->" and the end tag is "<--table InterfaceStats ends-->". Also, the first line of the table should contain the attribute names. The attribute names or the column names should also be separated by the same delimiter used to separate the data rows and that is specified as the column delimiter. In this case, they are Name, IP, In and Out. The remaining lines between the start and end tag should comprise of the actual data. Make sure that the delimiter for the table is unique and you should specify that as the column delimiter.
Following are the sample contents of the output file interfacestatusoutput.txt based on the table name InterfaceStats:
DiskStatus=Up
No.ofProcess=1
DiskErrors=0
<--table InterfaceStats starts-->
Name IP In Out
eth0 192.168.1.1 123451 234567
eth1 192.168.1.2 345633 453267
<--table InterfaceStats ends-->
Overriding Availability and Response Time of the Script
This option would be useful, if you want to override the response time measured for custom scripts using a defined value in the output file. Applications Manager looks for few reserved keywords in the output file, if it matches then it will replace the corresponding attribute.
For eg., if the script output looks like this,
script_availability=1 (Allowed values are 0 or 1. "0" refers to success. "1" refers to failure.)
script_message=Server is not running.
script_responsetime=10
Then, while parsing the output file, script_availability value will be taken and based on that the availability is calculated. The same is the case for response time.
Monitoring SNMP OIDs with Script monitor
Follow the steps below for monitoring SNMP OIDs using script monitor,
- Create a script file ( say script.sh ) under the /opt/ManageEngine/AppManager_Home/ directory
- Edit that file and type in the following content into that file,
snmpwalk -v 1 -c public app-w2k1 CPQHLTH-MIB::cpqHeFltTolPowerSupplyRedundant.0.1| awk '{ y = $1; x = $4 ; gsub(/[a-zA-Z()]/, "", x)} {print y " = " x}'>> output.txt
snmpwalk -v 1 -c public app-w2k1 CPQHLTH-MIB::cpqHeFltTolPowerSupplyRedundant.0.2 | awk '{ y = $1; x = $4 ; gsub(/[a-zA-Z()]/, "", x)} {print y " = " x}' >> output.txt - Click on "New Monitor" in applications manager and choose script monitor. Then create a new monitor using the following parameters,
Script to Monitor </opt/ManageEngine/AppManager_Home/script.sh>
Directory from which the script should be executed </opt/ManageEngine/AppManager_Home/>
Under Output Settings, Output File </opt/ManageEngine/AppManager_Home/output.txt>
Numeric Attributes <CPQHLTH-MIB::cpqHeFltTolPowerSupplyRedundant.0.1><CPQHLTH-MIB::cpqHeFltTolPowerSupplyRedundant.0.2> - Use the default parameters for configuring the remaining attributes.
Note: If an attribute does not have any data, the script returns 'N.D', where 'N.D' means No Data.
Monitoring UDP Port with Script monitor
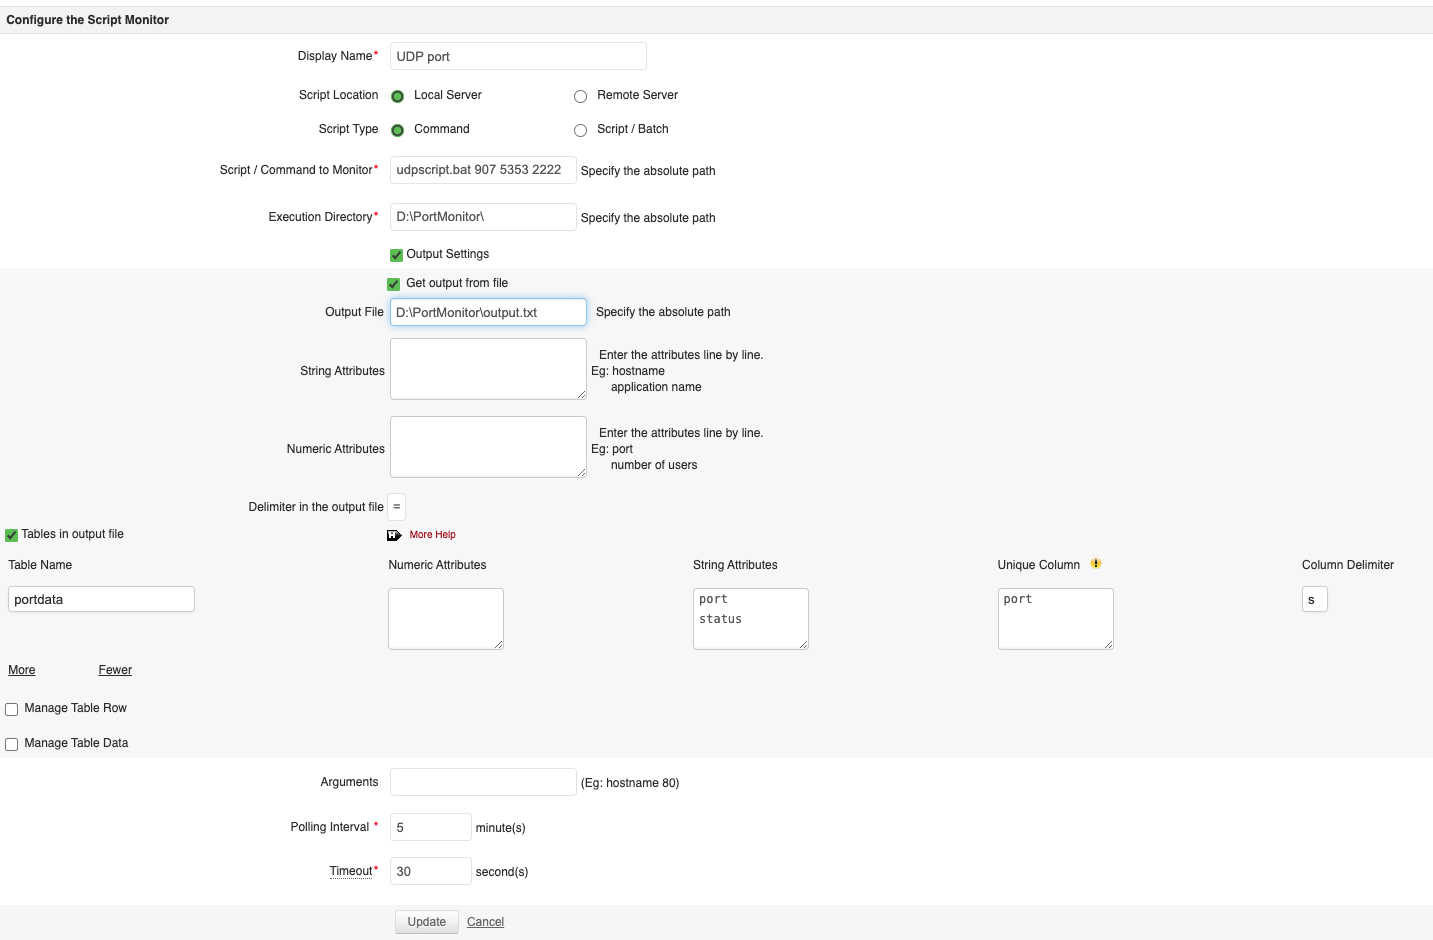
Follow the steps below for monitoring UDP Port using script monitor in Windows:
- Create a batch file ( say udpscript.bat ) in the server where the UDP service is running.
- Edit the file and type in the following content into that file.
@echo off
setlocal enabledelayedexpansion
set "output_file=output.txt"
REM Overwrite the output file with the initial lines
set "tablestart=<!--table portdata starts-->"
echo !tablestart! > "%output_file%"
echo Port Status >> "%output_file%"
REM Loop through all provided port numbers
:check_ports
if "%~1"=="" goto end
set "port=%~1"
set "found=no"
REM Check if the port is listening
for /f "tokens=*" %%a in ('netstat -an ^| findstr /i "udp" ^| findstr /i ":!port!"') do (
set "found=yes"
)
if "!found!"=="yes" (
echo !port! Up >> "%output_file%"
) else (
echo !port! Down >> "%output_file%"
)
shift
goto check_ports
:end
set "tableend=<!--table portdata ends-->"
echo !tableend! >> "%output_file%"
- Click on "New Monitor" in Applications Manager and choose Script monitor. Then create a new monitorusing the following parameters. Provide configuration details in table by referring to the image given below.
- Script location: Specify the Script Location whether the script to be monitored is present in the Local Server or in a Remote Server.
- Script/Command to Monitor: Specify the UDP ports to be monitored.
- Execution Directory / Output File: Specify the absolute path of the Execution Directory from which the script should be executed.
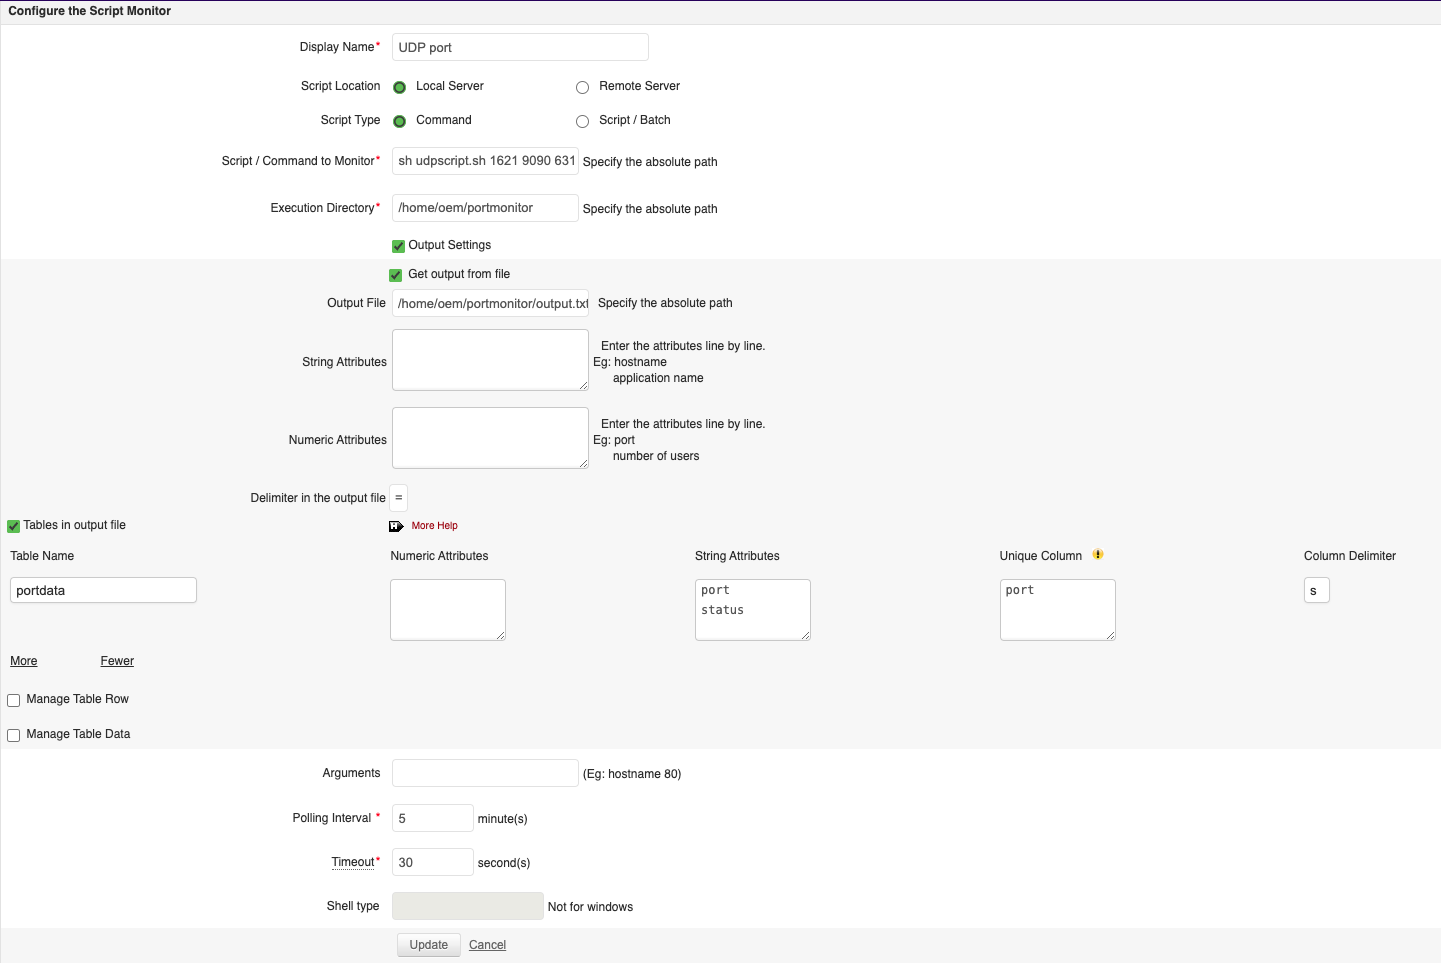
Follow the steps below for monitoring UDP Port using script monitor in Linux:
- Create a script file ( say udpscript.sh ) in the server where the UDP service is running.
- Edit the file and type in the following content into that file.
#!/bin/sh
output_file="output.txt"
output="<!--table portdata starts-->\n"
output="$output""port status\n"
for port in "$@"; do
if netstat -uln | grep -q ":$port"; then
output="$output""$port Up\n"
else
output="$output""$port Down\n"
fi
done
output="$output""<!--table portdata ends-->\n"
echo "$output" > "$output_file"
- Click on "New Monitor" in Applications Manager and choose Script monitor. Then create a new monitorusing the following parameters. Provide configuration details steps in table by referring to the image given below.
- Script location: Specify the Script Location whether the script to be monitored is present in the Local Server or in a Remote Server.
- Script/Command to Monitor: Specify the UDP ports to be monitored.
- Execution Directory / Output File: Specify the absolute path of the Execution Directory from which the script should be executed.
Monitored Parameters
Go to the Monitors Category View by clicking the Monitors tab. Click on Script Monitor under the Custom Monitors Table. Displayed is the Script Monitor bulk configuration view distributed into three tabs:
- Availability tab, gives the Availability history for the past 24 hours or 30 days.
- Performance tab gives the Health Status and events for the past 24 hours or 30 days.
- List view enables you to perform bulk admin configurations.
Custom Monitor Types
Custom Monitor Types in Applications Manager allow you to associate a monitor type to the inhouse scripts, for monitoring your own applications. You can define your own monitor types apart from the monitor types that are available by default. Know more.
Enabling Configure Alarms Template for Script Monitor
You can enable a link to Configure Alarms (link will appear on the right top corner of each table in your Script Monitor page). Using the link, the user can set Predefined Thresholds for any attributes in the table.
Here is how you can enable Configure Alarms Template for Script Monitor:
- Go to the Settings tab.
- Click Performance Polling under Discovery and Data Collection.
- Under Performance Data Collection, click on the Optimize Data Collection tab.
- Choose Script / Database Query Monitor from the drop-down menu.
- Check the Enable Configure Alarm Template for Script Monitor and Database Query Monitor option.
- The Configure Alarm link will appear on the right top corner of each table in your Script Monitor page.
