Thread Dump Analysis in APM Insight
The Thread Dump Analysis feature in APM Insight provides a comprehensive, multi-tab analysis of JVM thread dumps. It helps you diagnose application hangs, CPU hotspots, deadlocks, memory issues, and exception states from a single collected thread dump snapshot.
When a thread dump is collected, the APM Insight agent captures a snapshot of every running thread in the JVM, including its name, state, call stack, locks held, and resources waited on. The Thread Dump Analysis feature processes this raw data and presents it across 11 specialized tabs, each designed to answer a specific class of diagnostic question.
Use case: Proactive production performance management
Utilize the Thread Dump Analysis feature in Applications Manager APM Insight to proactively manage the performance of your production environment. Regularly capture thread dumps and examine the data to identify bottlenecks, resolve deadlocks, monitor garbage collection, and investigate exceptions. By leveraging comprehensive analysis tools like Flame Graphs and Call Stack Trees, you can take preventive actions before performance issues impact end users. Address any performance issues promptly and optimize your application's code and resource usage to ensure a smooth user experience.
Thread dump metrics
To obtain thread dump metrics, navigate to APM Insight → Application/Instance → Thread Profile tab → select a thread dump from the Dump List.
Note: You need to perform Thread Profiling to get the thread dump summary.
The following table lists all the analysis tabs available in the Thread Dump Analysis view:
| Tab | Description |
|---|---|
| Thread Count Summary | High-level overview with charts and state breakdown. |
| Transitive Graph | Threads transitively blocked on shared locks. |
| Last Executed Methods | Hotspot methods where the most threads are stuck. |
| CPU Threads | Threads actively consuming CPU. |
| GC Threads | Garbage collector thread activity. |
| Deadlocks | Detected deadlock cycles and chains. |
| Exception Threads | Threads with exceptions in their stack. |
| Finalizer Thread | Finalizer queue status and blocking analysis. |
| Flame Graph | Interactive SVG flame chart of call stacks. |
| Call Stack Tree | Collapsible tree of aggregated call paths. |
| Thread Dump Analysis (Detail Panel) | Inspect individual thread stack traces and apply multi-faceted filters. |
Thread count summary
Use this tab to get a quick health pulse of your application:
- A high BLOCKED count indicates lock contention. Navigate to the Deadlocks or Transitive Graph tab for further analysis.
- Many WAITING threads may indicate thread pool exhaustion. Check which methods they are waiting in via the Last Executed Methods tab.
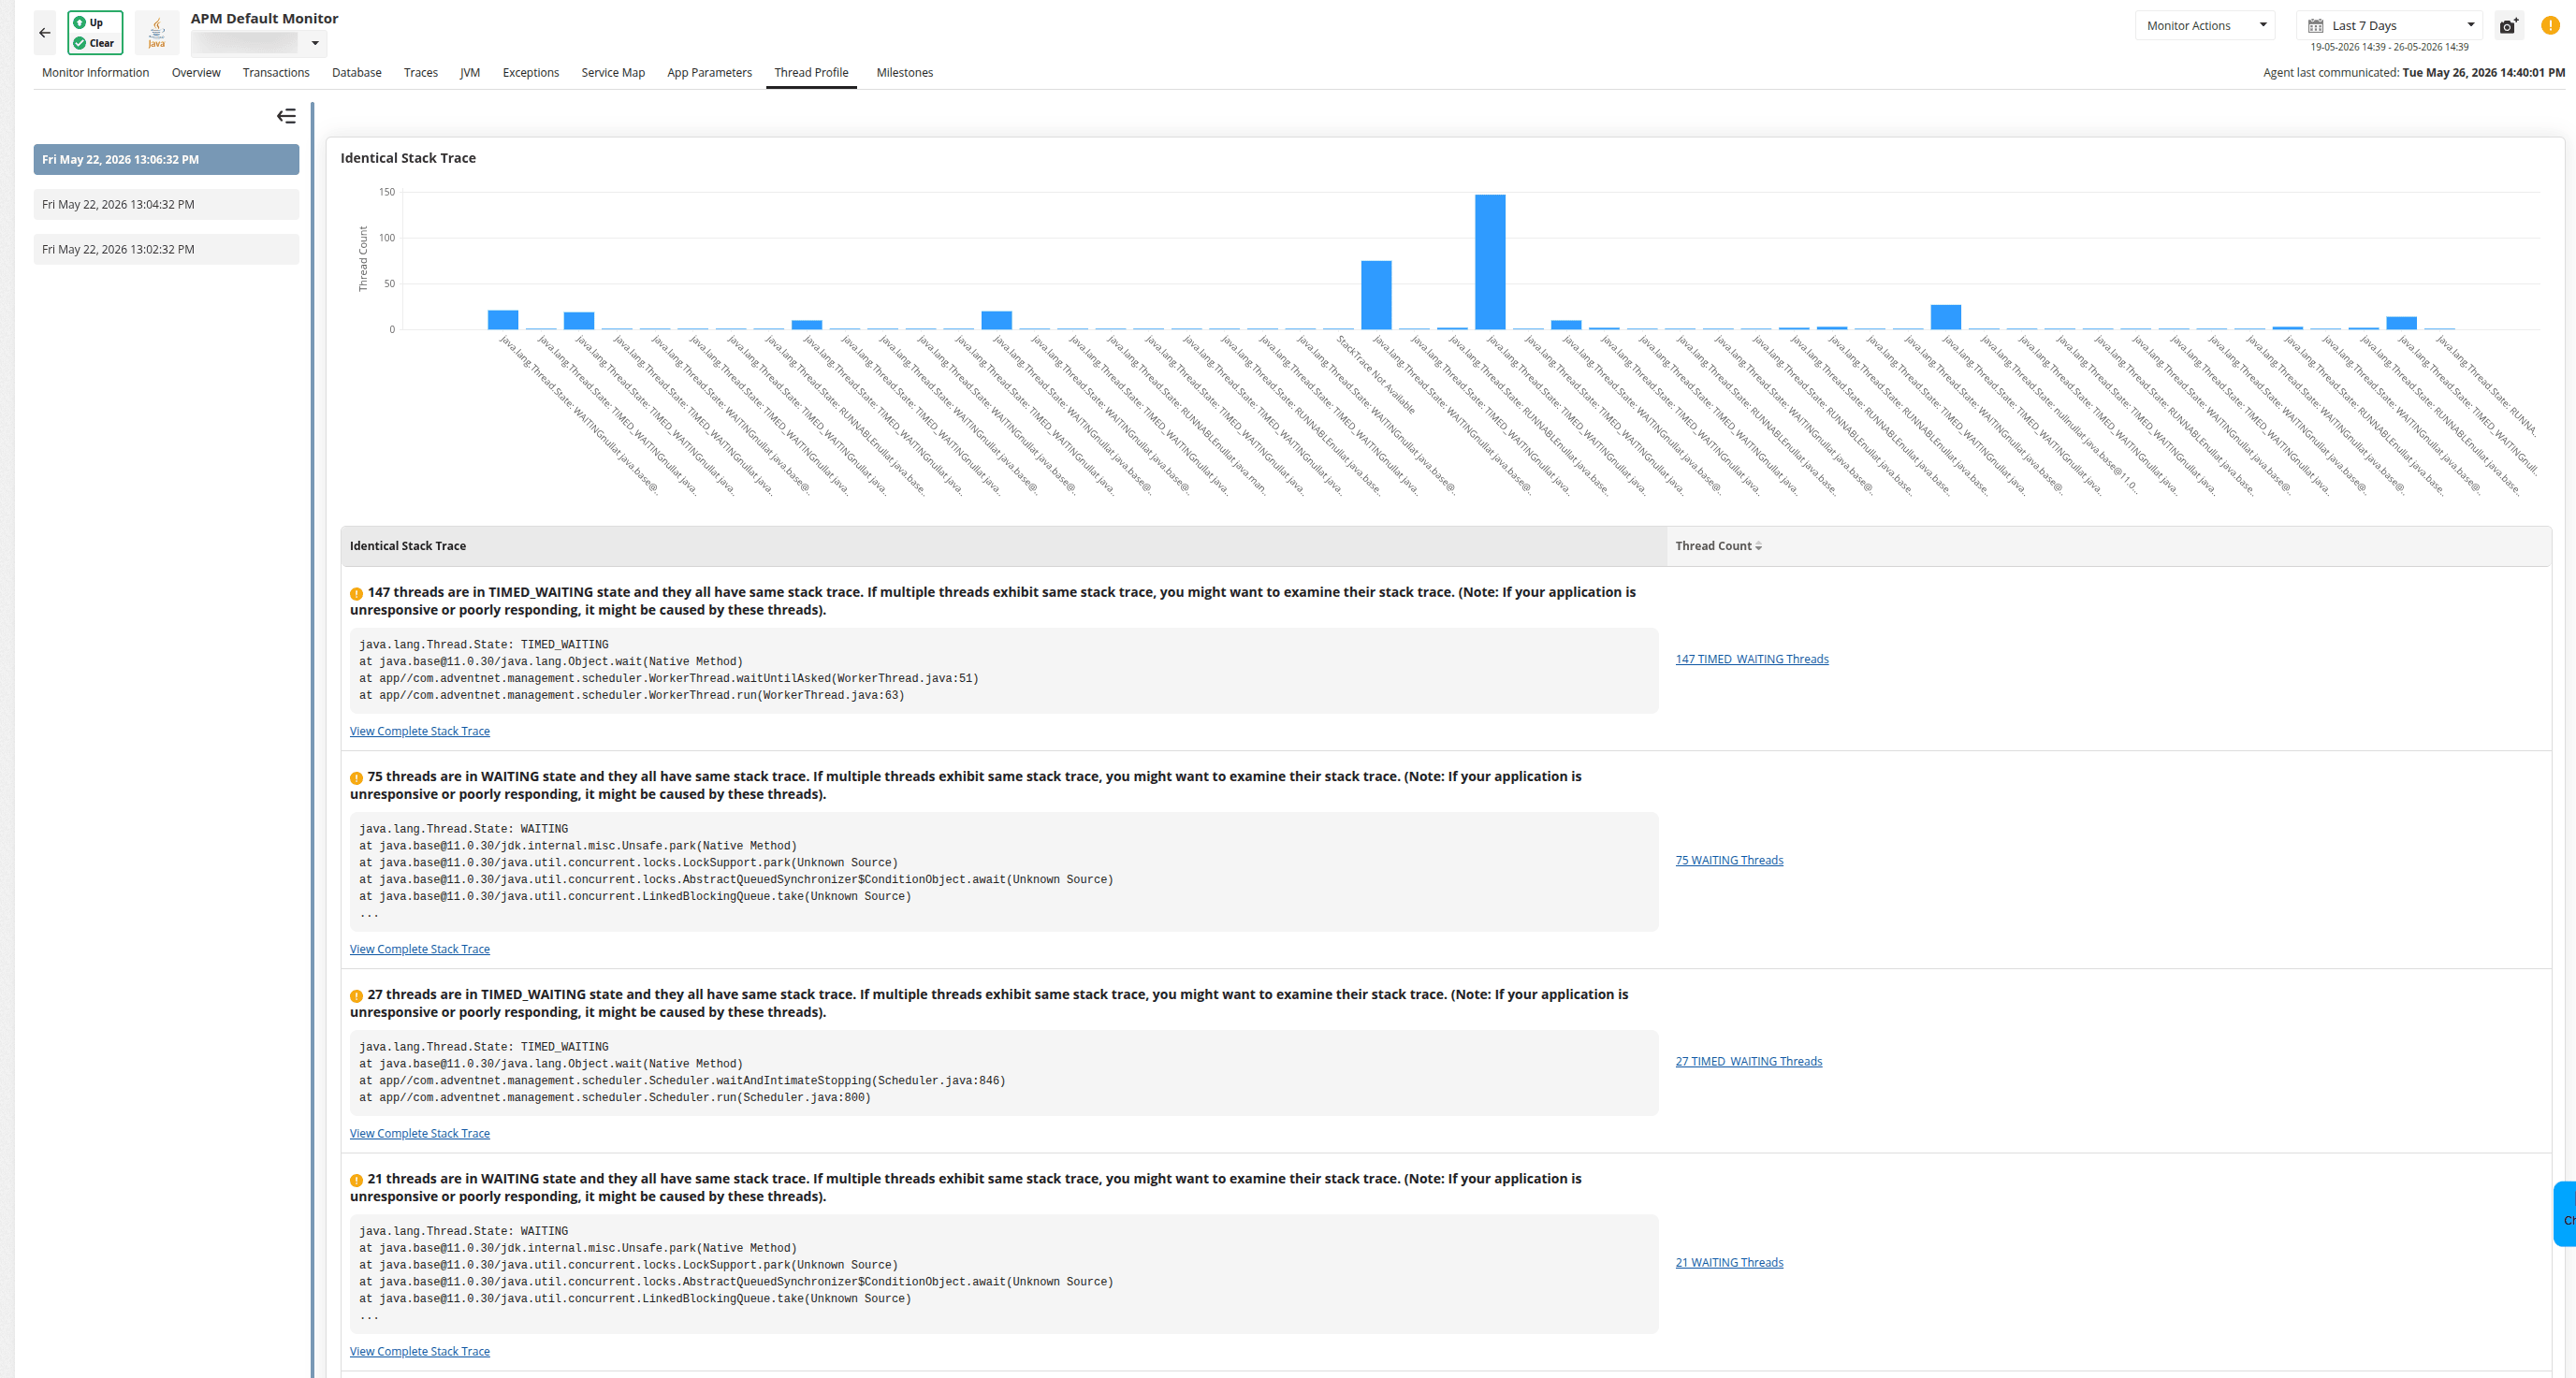
- A large cluster of identical stack traces means multiple threads are stuck at the same point. Click the stack trace row to see which threads are affected.
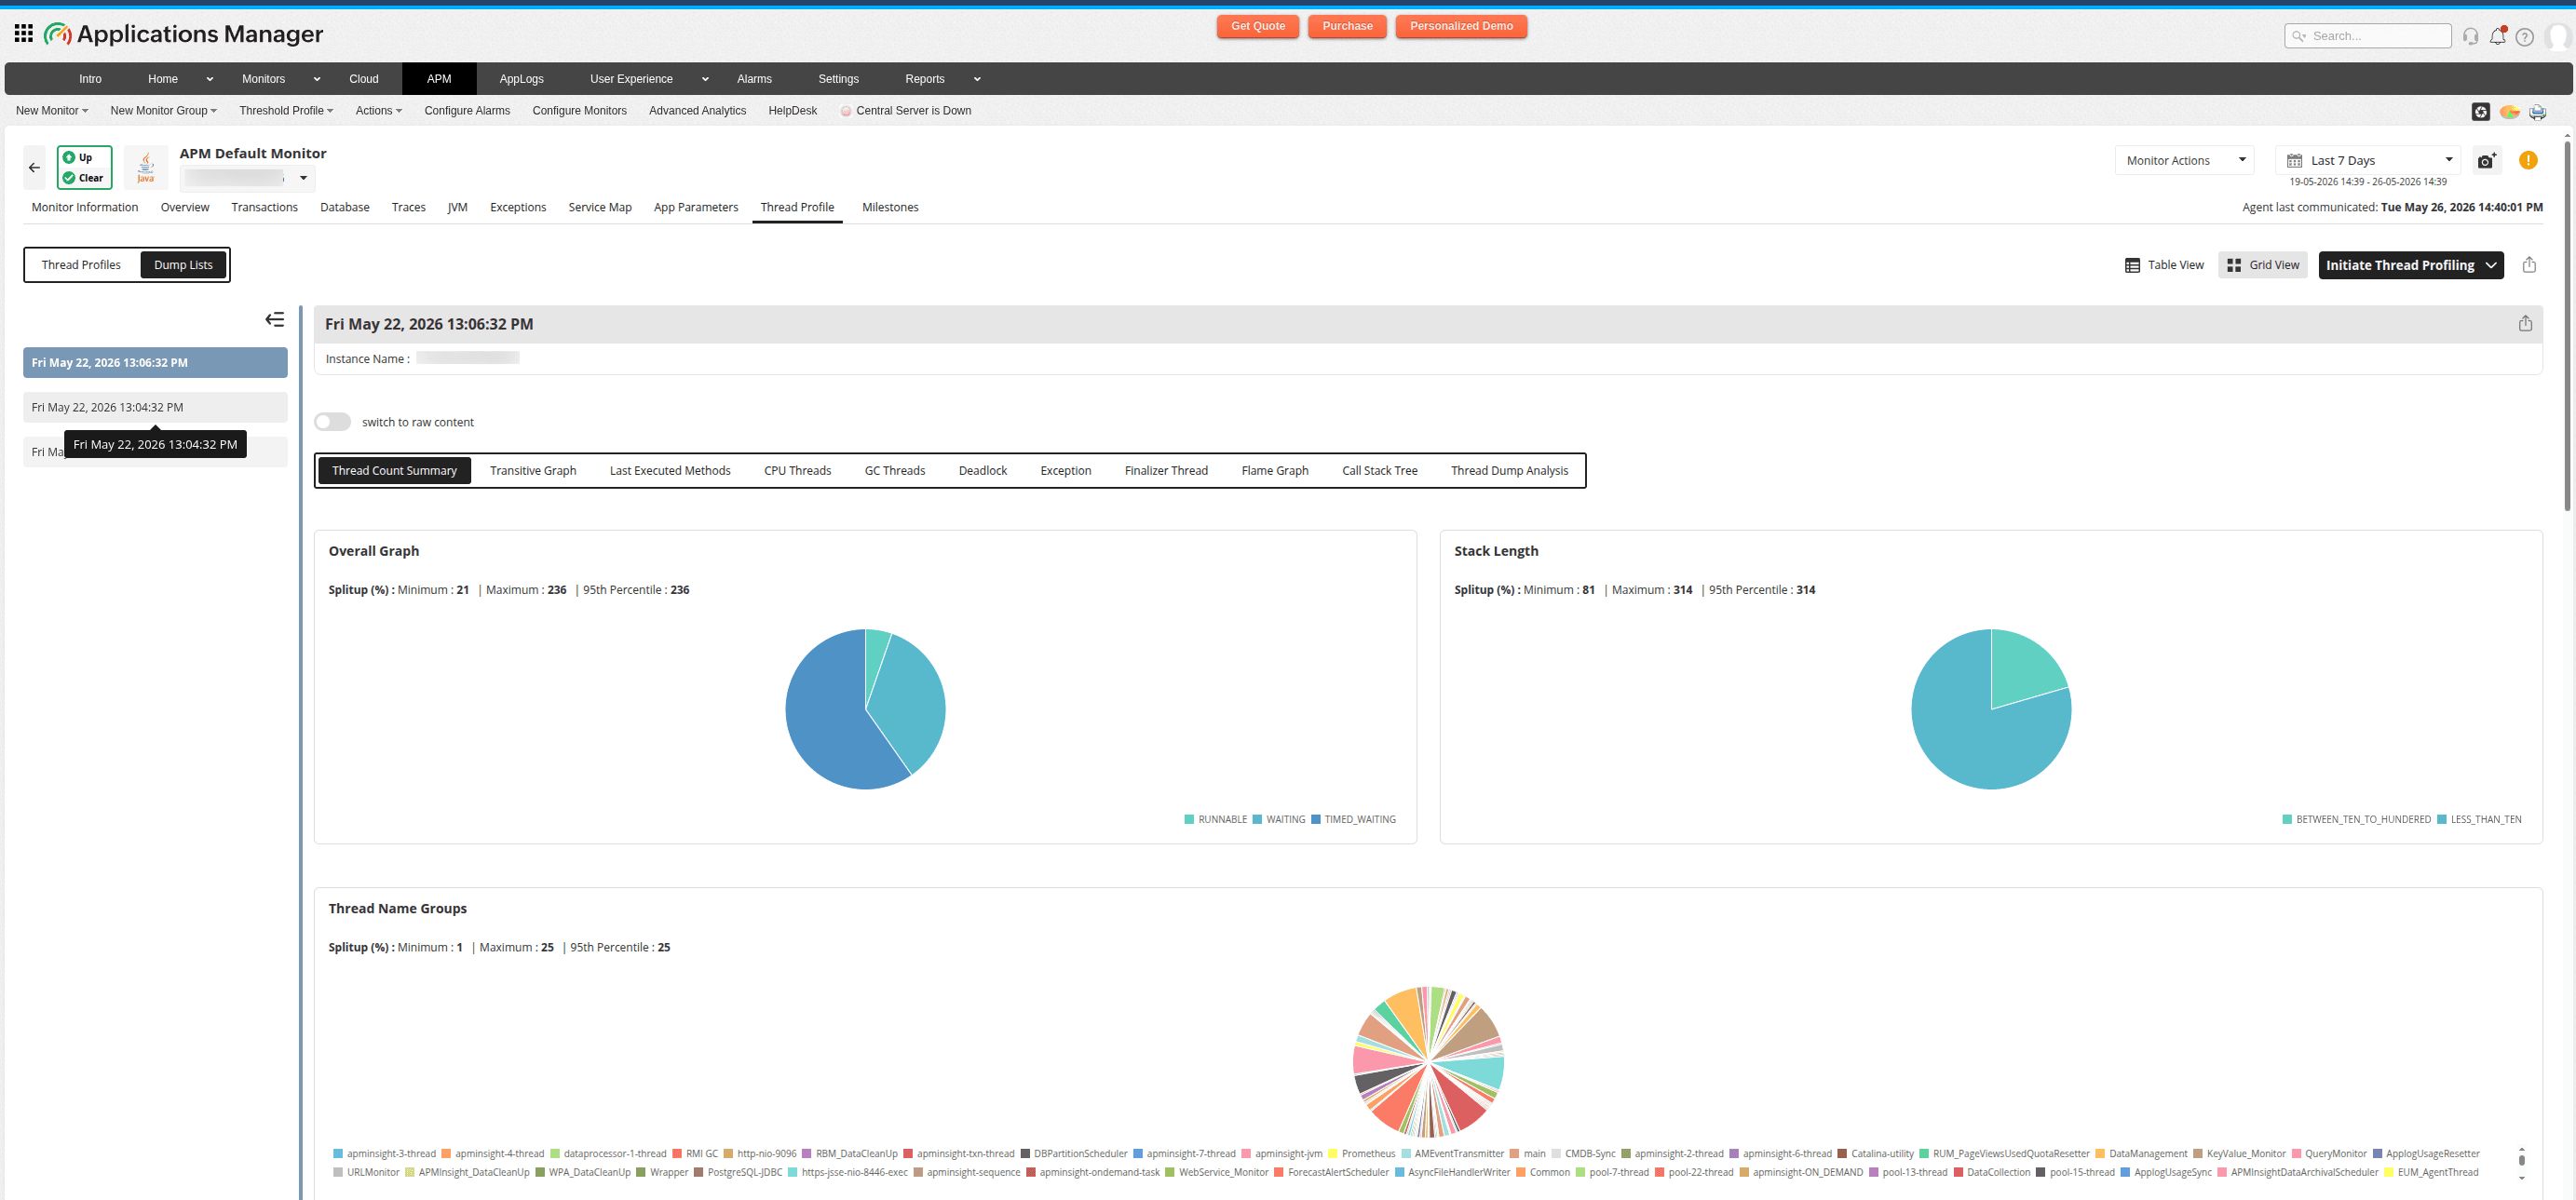
Charts
| Chart | Description |
|---|---|
| Overall Thread States | Pie chart showing a breakdown by thread state: RUNNABLE, BLOCKED, WAITING, and TIMED_WAITING. |
| Stack Length Distribution | Pie chart showing how deep the call stacks are, grouped by depth ranges. |
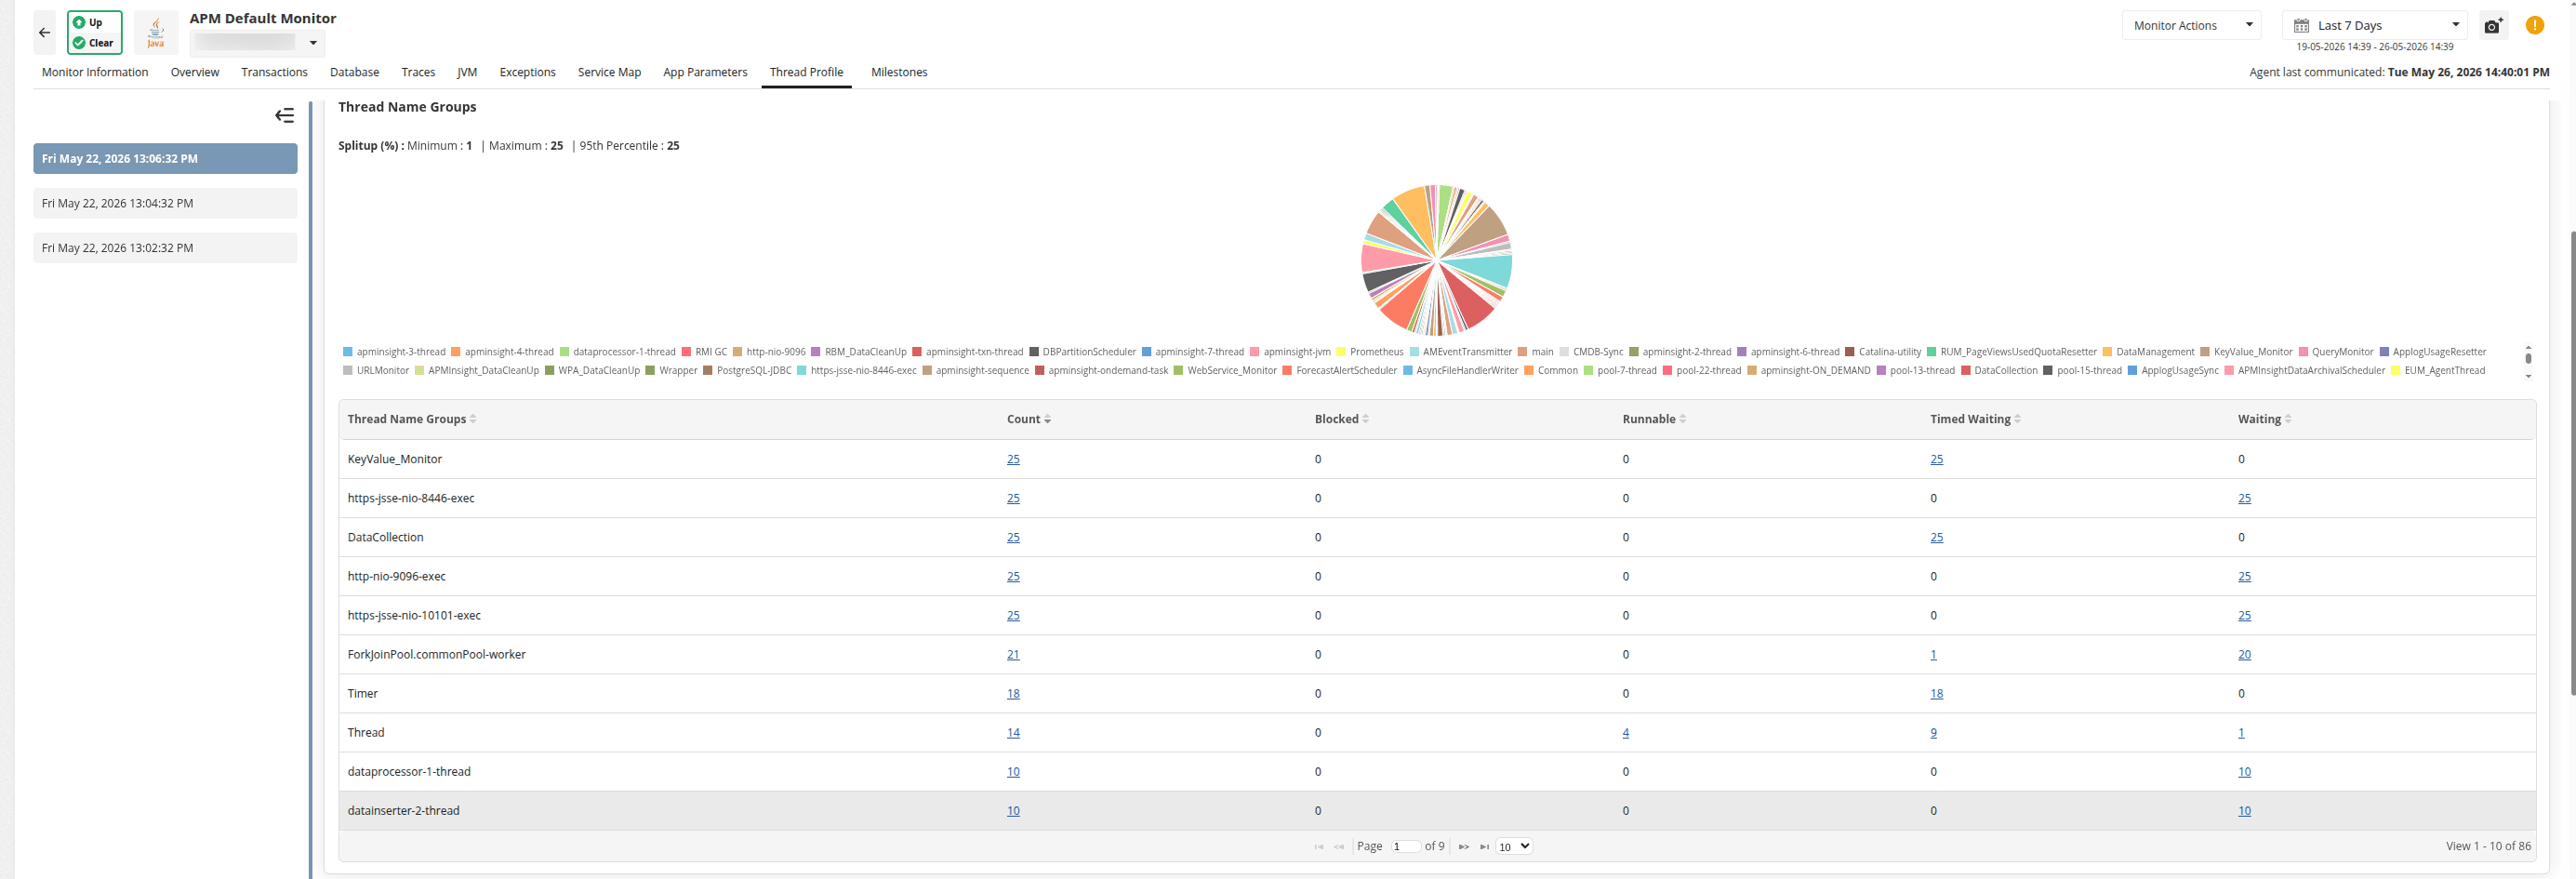
| Thread Name Groups | Pie chart highlighting which thread naming prefixes dominate (for example, http-nio-, pool-, GC). |
| Identical Stack Traces | Bar chart showing the count of threads sharing the exact same call stack. |
Tables
| Table | Columns | Description |
|---|---|---|
| Thread State Grouping | Thread Name, Total, Blocked, Runnable, Timed Waiting, Waiting | Shows thread counts per name group, broken down by state. |
| Identical Stack Traces | Stack Trace, Thread Count | Groups threads with identical stacks. High counts indicate contention. |
Transitive graph
The Transitive Graph illustrates the connections between threads in a multi-threaded application, aiding in the identification of the main thread blocking other threads. Clicking the required thread name will show the respective stack trace.
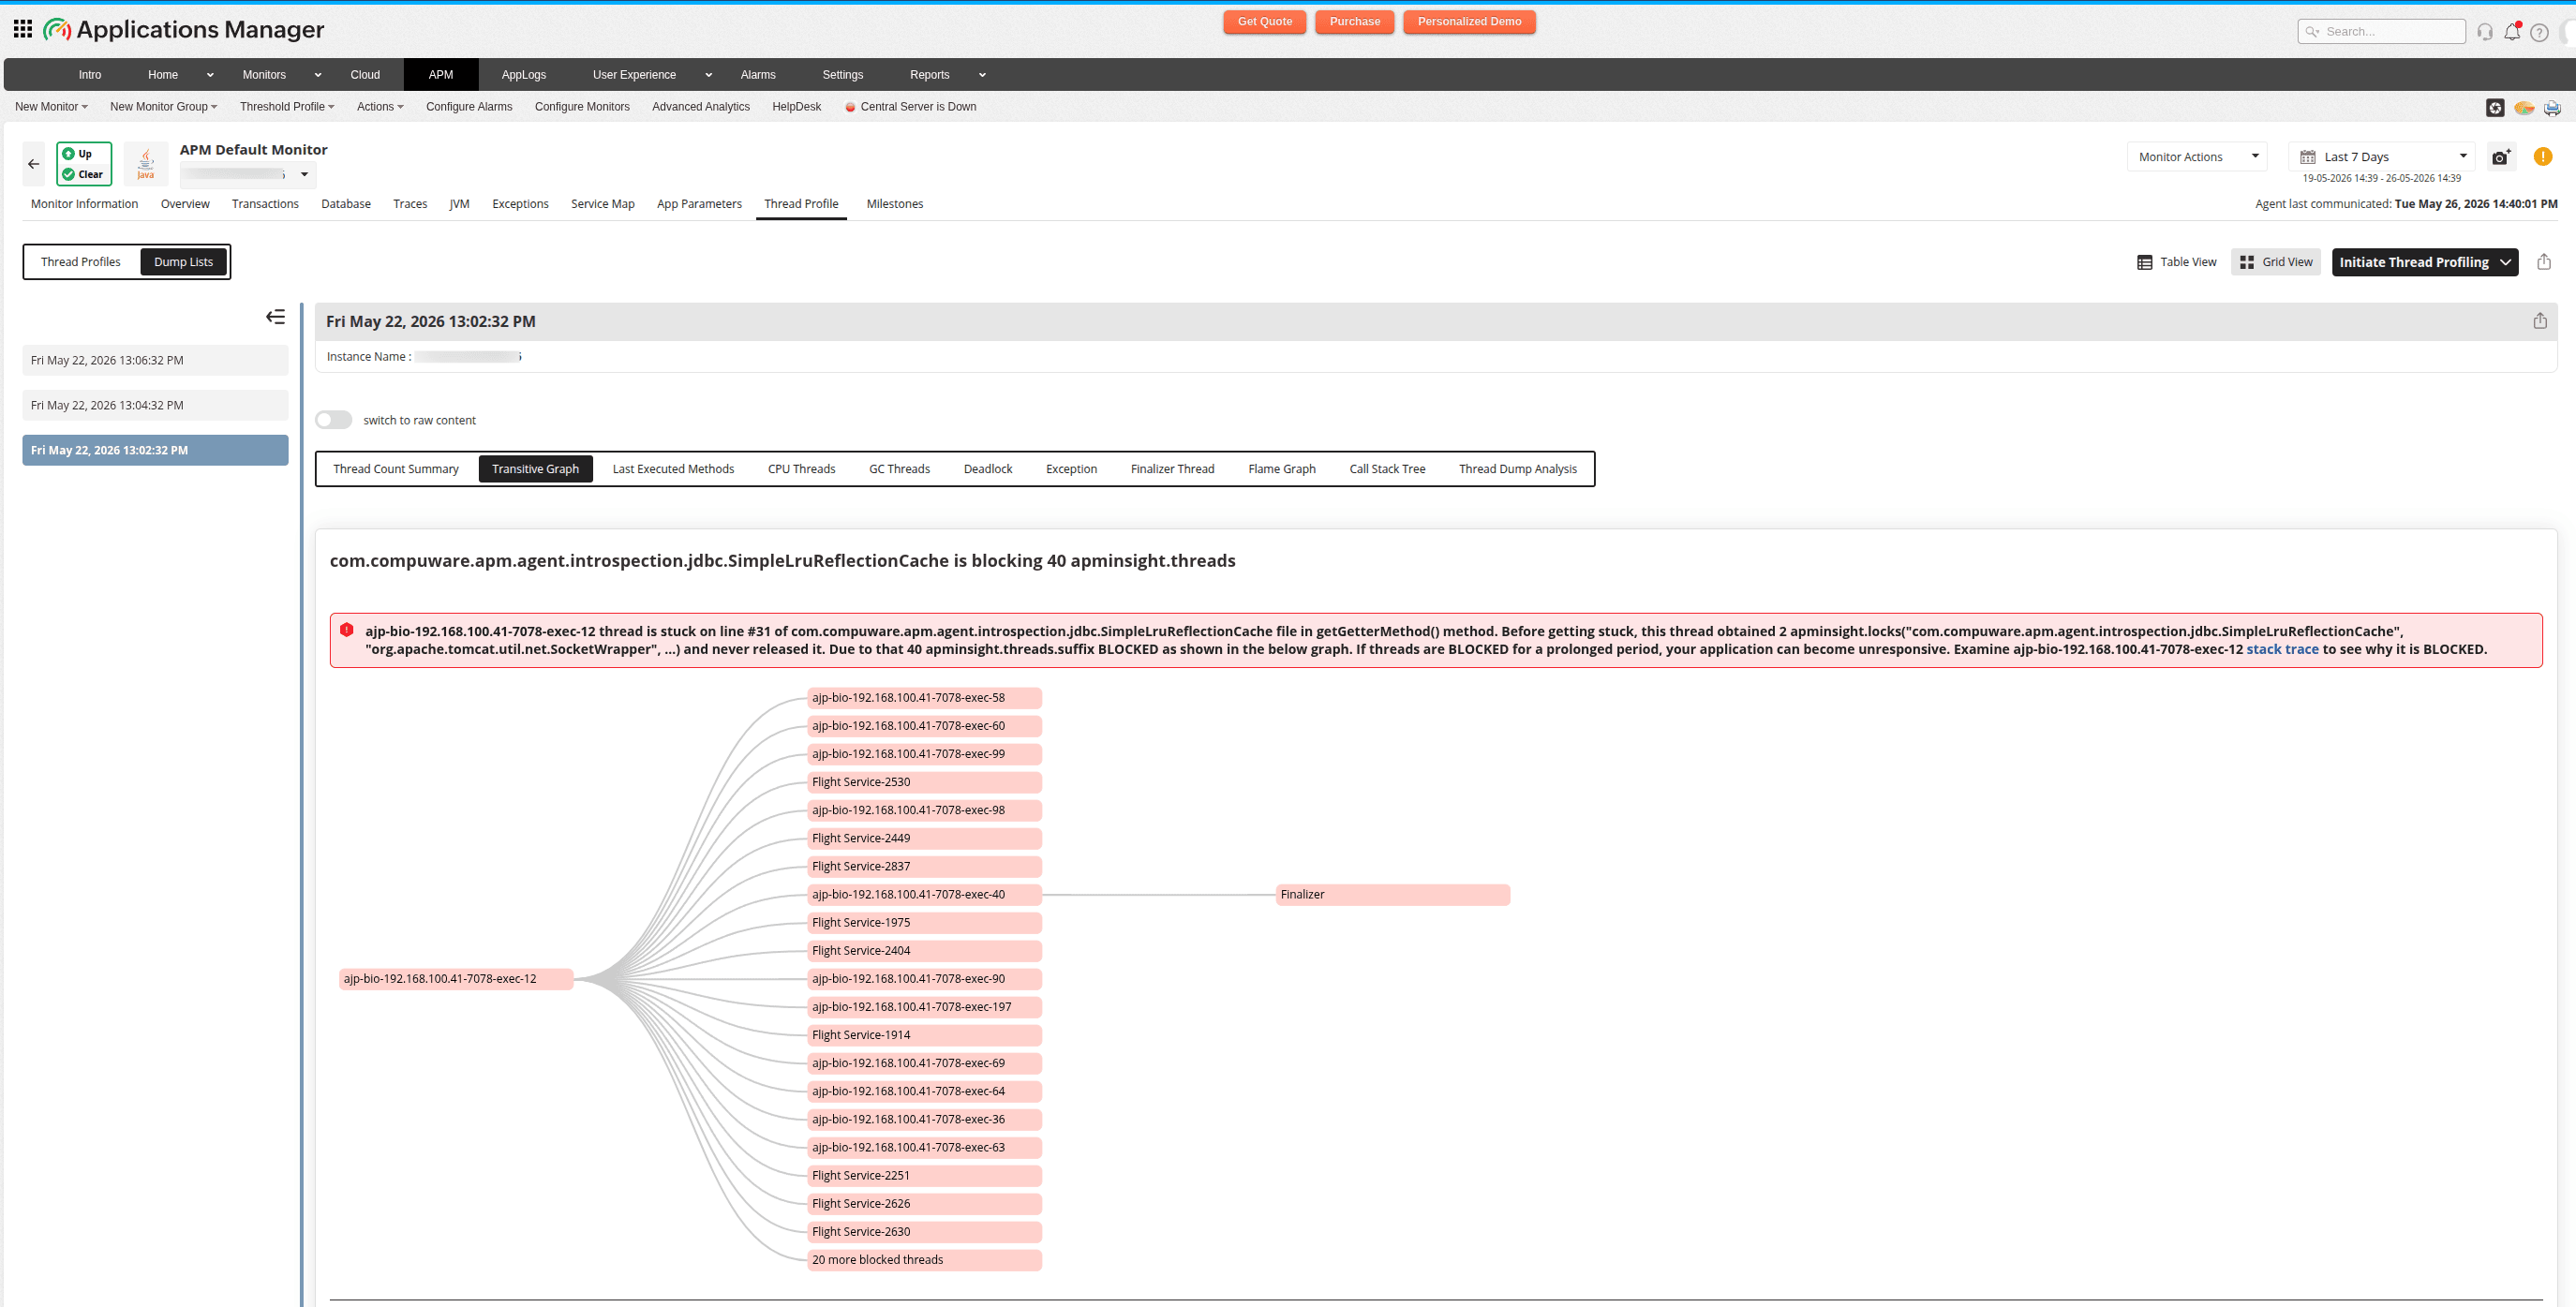
Each entry displays:
- Title message - A summary of the blocking relationship, such as the thread name, the lock it is waiting on, and the number of affected threads.
- Tree nodes - The parent thread (lock holder) and its child threads (waiters).
- Severity icon - Warning (yellow) for potential issues and Danger (red) for critical blocking.
When multiple threads are blocked on the same resource, this tab shows the full blocking chain. You can:
- Click a thread name to view the respective stack trace.
- Click a thread ID to open the Thread Dump Analysis detail panel with that thread's full stack trace.
- Hover over a node to highlight related nodes and connections.
Last executed methods
The Last Executed Methods tab shows the executed methods in descending order, along with the corresponding thread count and its percentage.
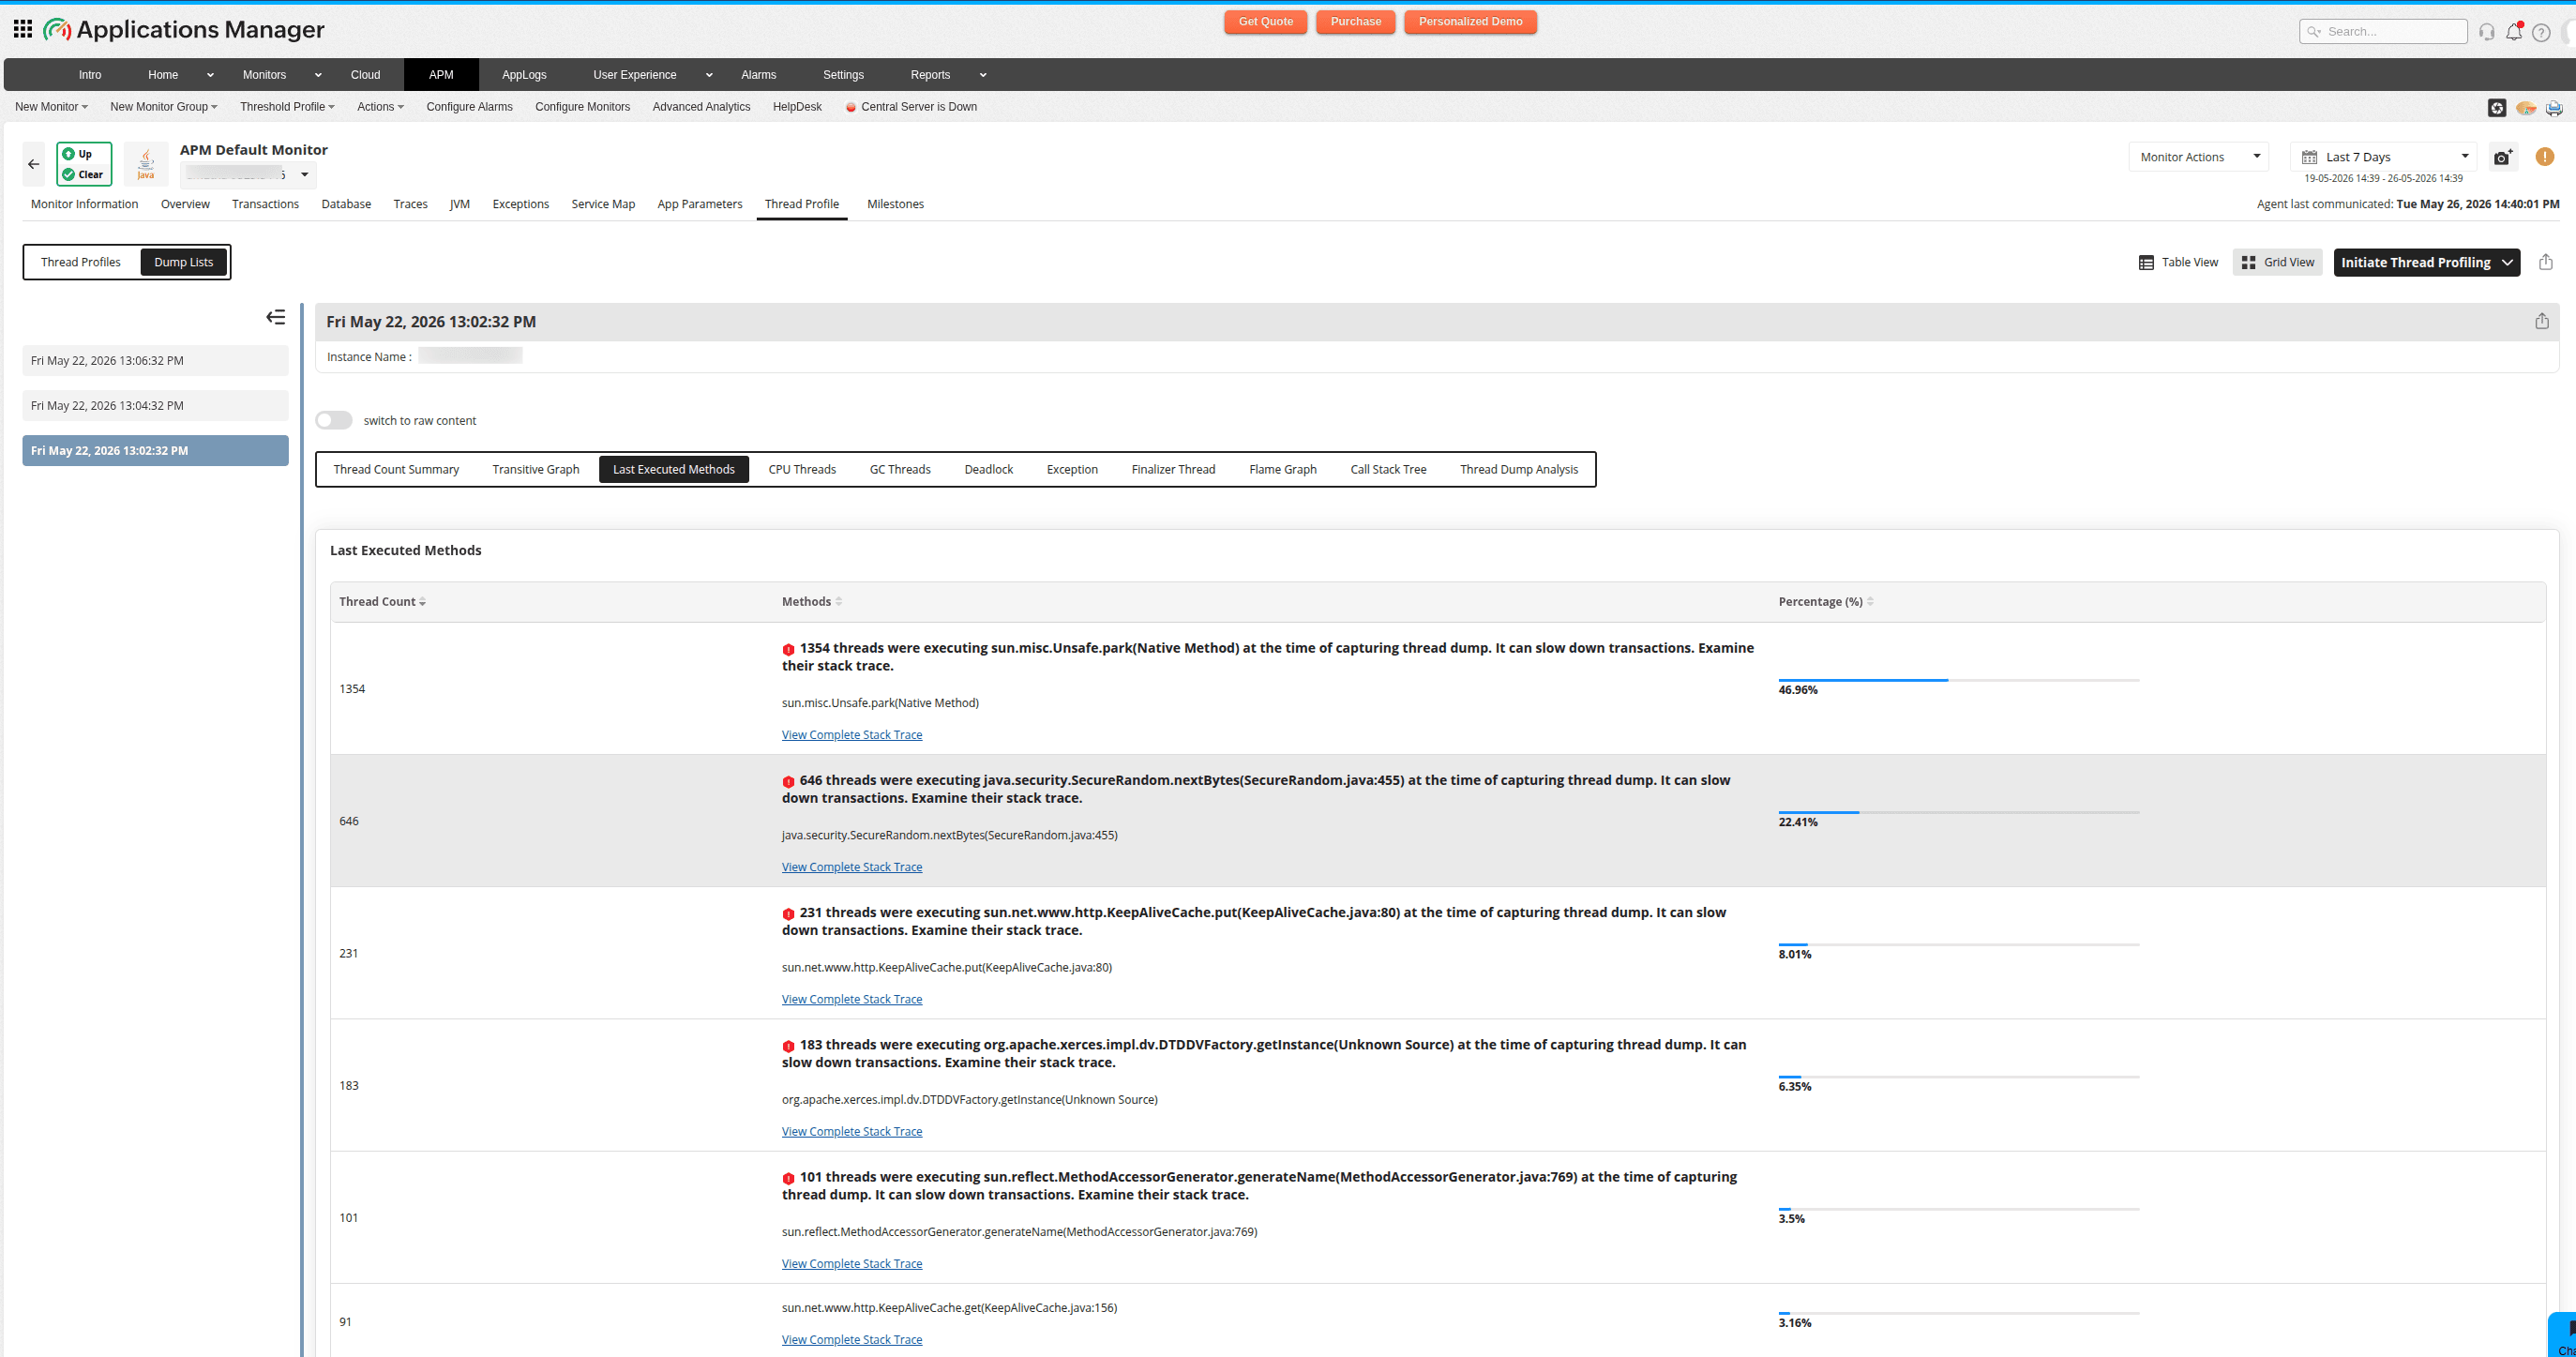
| Column | Description |
|---|---|
| Thread Count | Number of threads whose top stack frame is this method. |
| Method Name | Fully qualified method name (for example, java.net.SocketInputStream.read()). |
| Percentage | Visual progress bar showing the proportion of total threads. |
Note: When you click View Complete Stack Trace, you will be taken to the Thread Dump Analysis tab, where you can further analyze the stack trace by applying the desired filters.
CPU threads
The CPU Threads tab provides valuable insight into your application's performance by displaying the top CPU-consuming threads along with their stack trace.
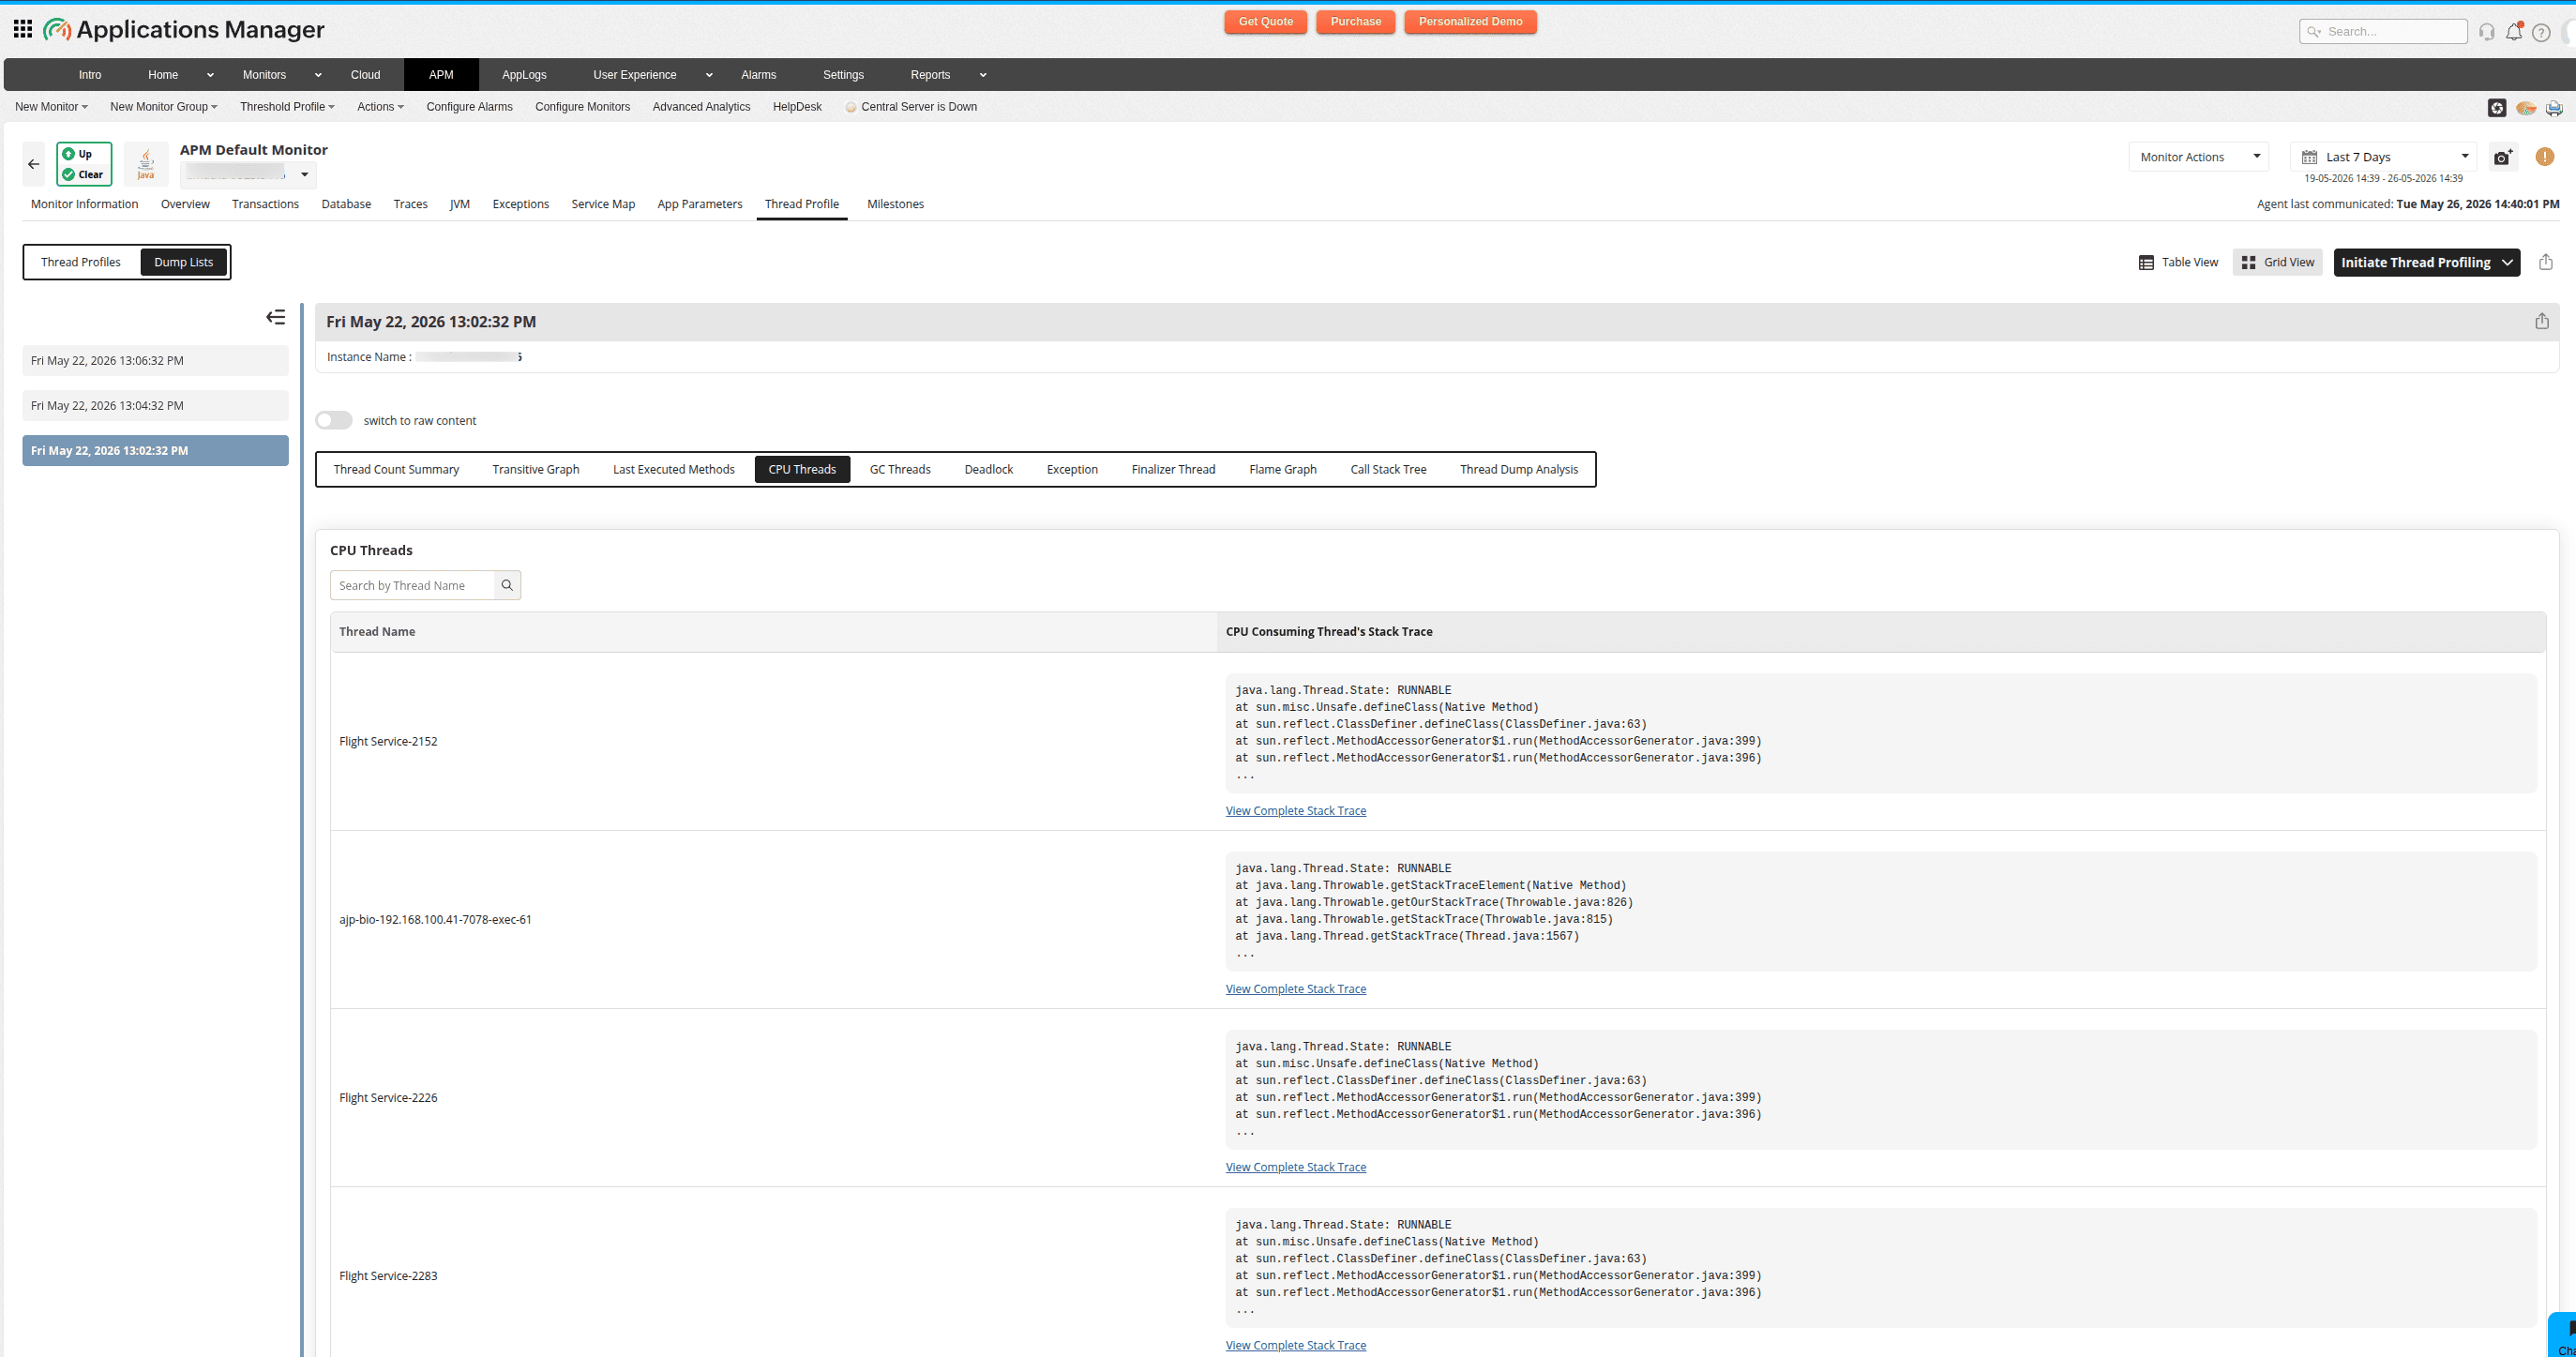
| Column | Description |
|---|---|
| Thread Name | Full thread identifier (searchable). |
| Stack Trace | Click to view the thread's complete stack trace. |
When the application has high CPU usage, this tab filters out the noise (GC threads, idle pools) and shows only application threads burning CPU. Each thread's stack trace reveals exactly which code path is consuming resources.
Note:
- You can search for specific threads by name using the Filter box.
- When you click View Complete Stack Trace, you will be taken to the Thread Dump Analysis tab, where you can further analyze the threads involved in detail.
GC threads
Garbage collection (GC) threads provide valuable insight into the memory management of your application, helping quickly identify and resolve performance issues related to GC. The GC Threads tab shows the thread count for GC_DAEMON and GC_TASK separately.
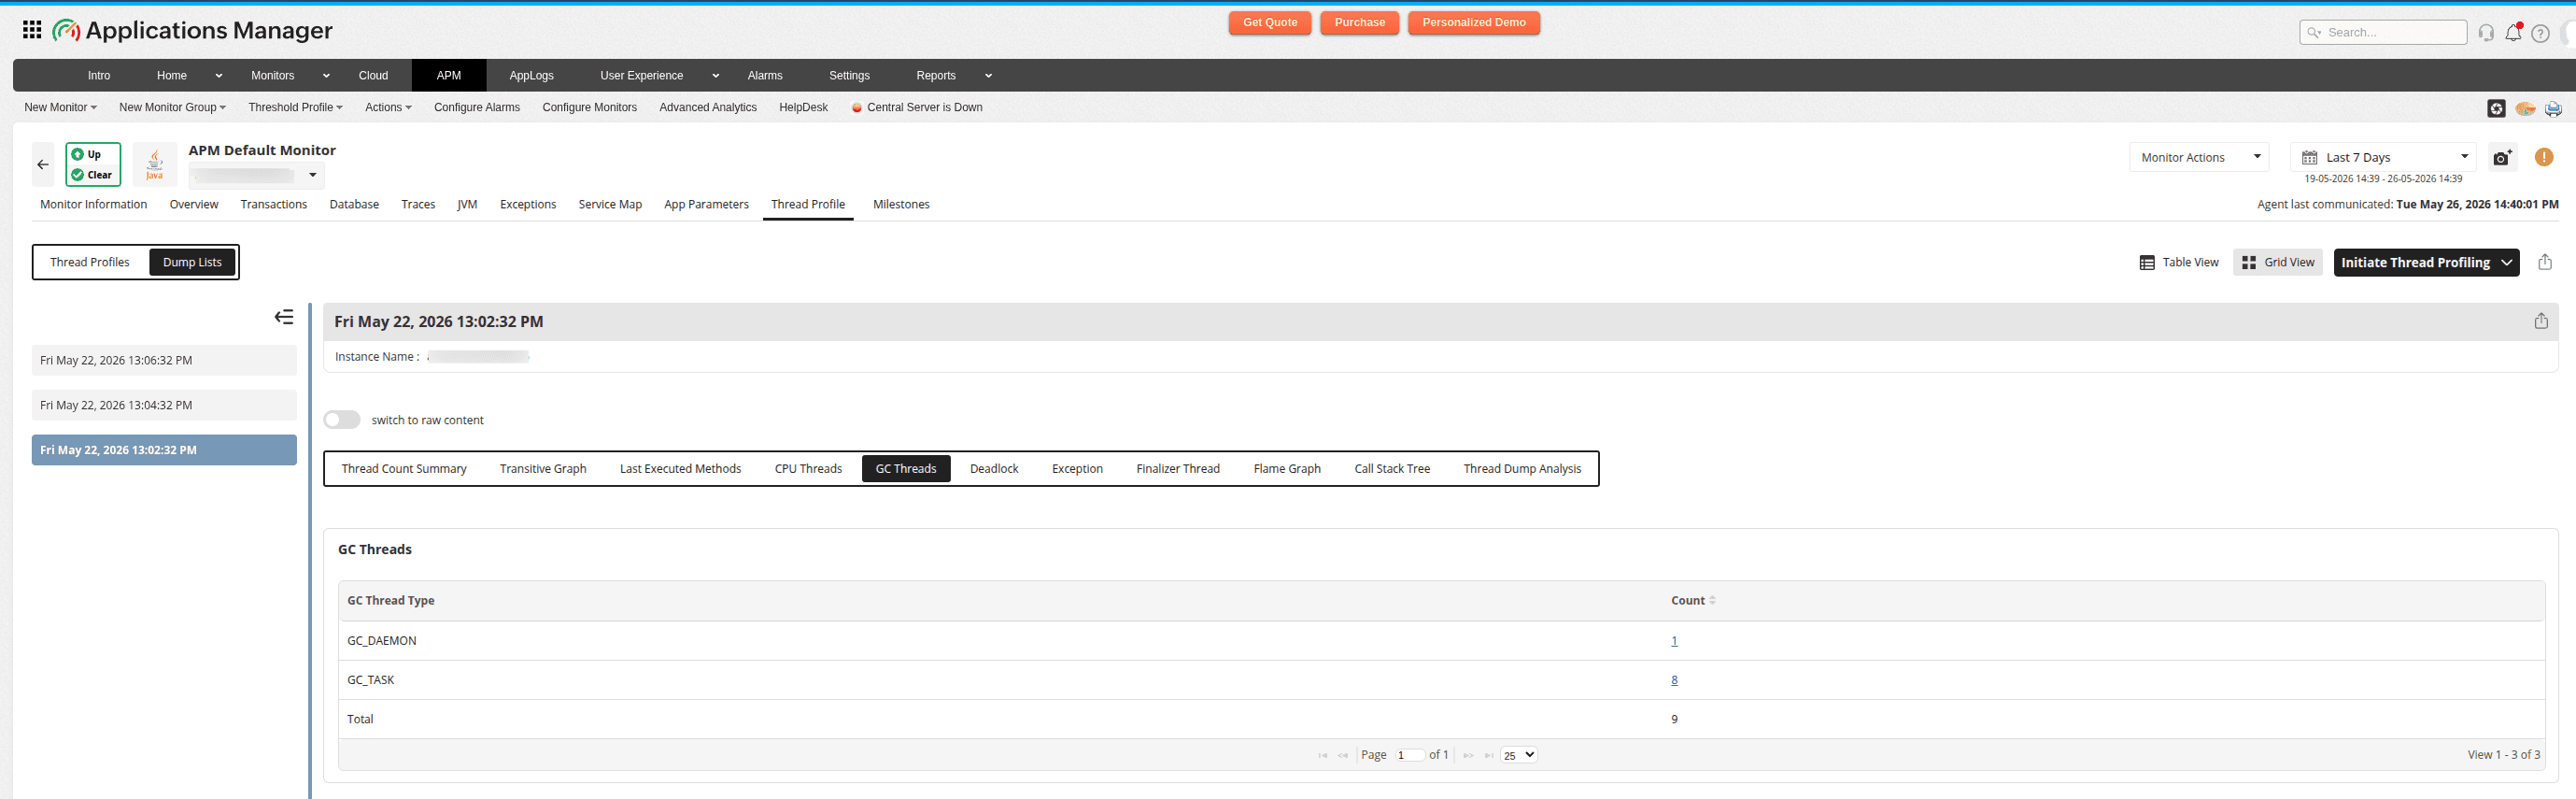
| Column | Description |
|---|---|
| GC Type | Name of the garbage collector (for example, G1 Young Generation, G1 Old Generation, ConcurrentMarkSweep). |
| Count | Number of threads dedicated to this GC type (clickable). |
This tab answers: "How much of the JVM's thread capacity is dedicated to garbage collection?"
- A high GC thread count relative to application threads indicates the JVM is spending more resources on memory management than serving requests.
- Correlate with heap memory metrics to diagnose whether the application is creating too many short-lived objects or if the heap is too small.
Note: You can click any count to find the list of threads.
Deadlocks
A deadlock happens when a group of threads are unable to proceed because each thread is holding a resource that another thread needs. The Deadlock tab contains details regarding deadlocks and the threads affected, including the resources they are waiting for and the status of each thread.
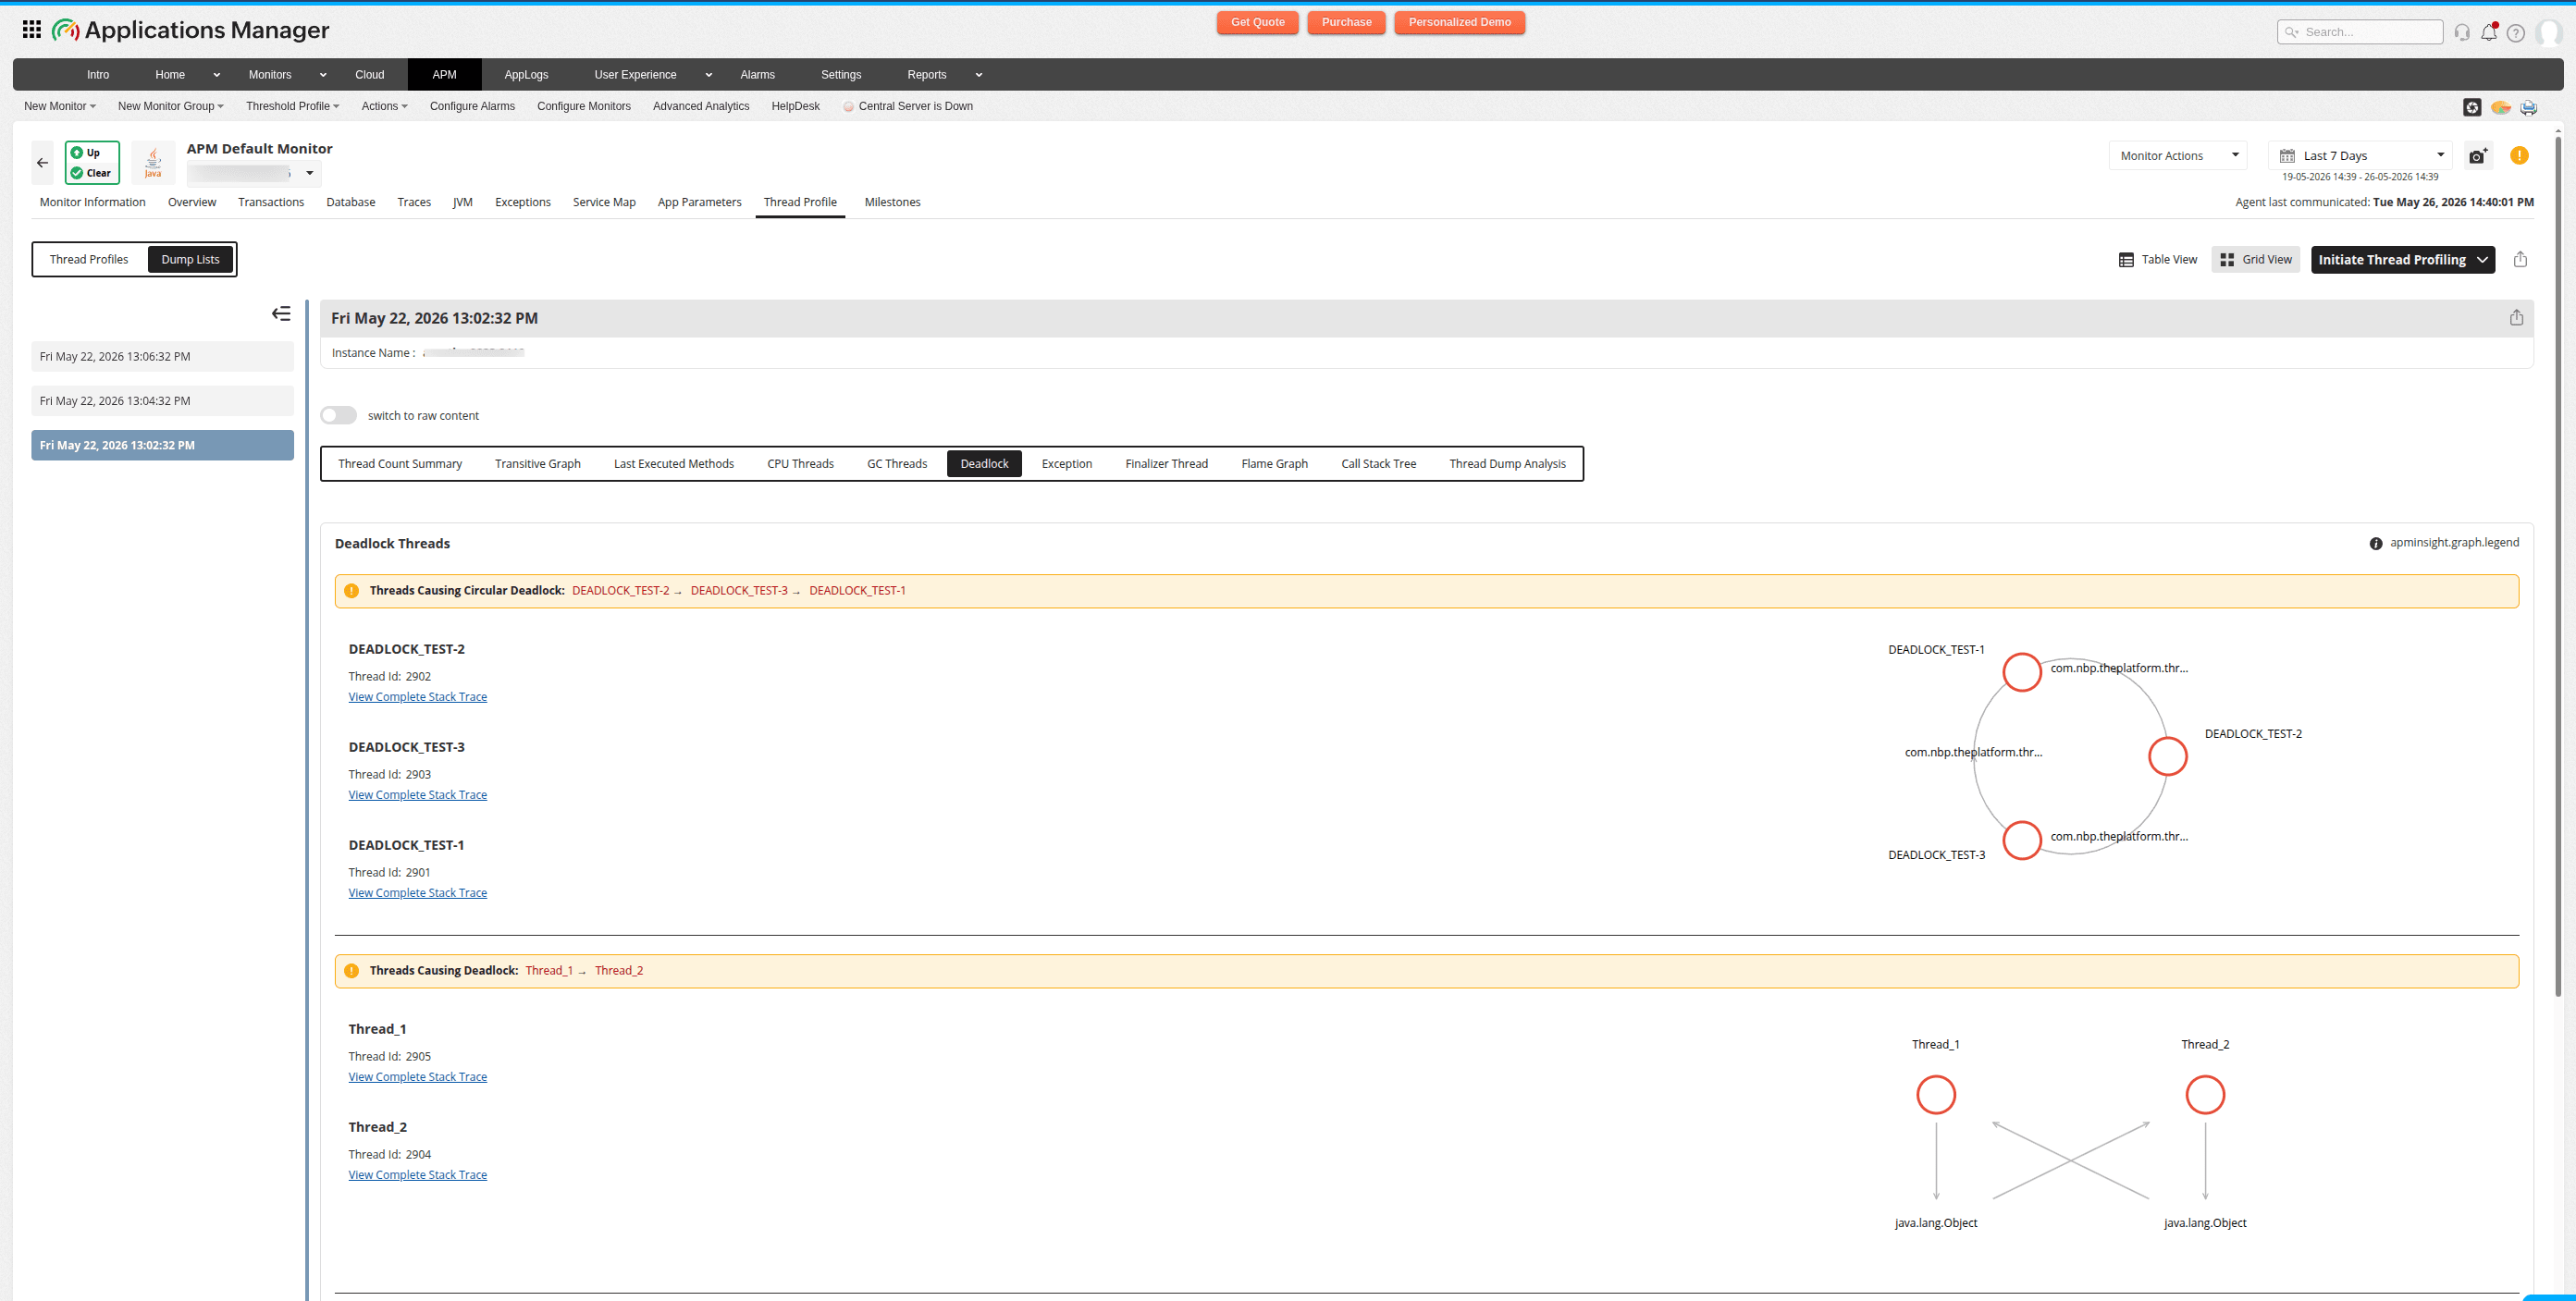
It shows:
- The names and IDs of the threads associated with the deadlock.
- A graphical representation of the deadlock.
Circular deadlocks
Threads forming a cycle where each thread holds a lock that the next thread needs. These are displayed as nodes arranged in a circle with curved directional arrows, along with an alert banner listing the cycle.
Regular deadlocks
Threads blocked waiting for resources held by other threads (non-cyclic). These are displayed as a bipartite graph with process nodes on top and resource nodes below, connected by straight directional arrows showing which thread waits on which resource.
Deadlocks are the most critical thread dump finding because they directly cause application hangs. This tab:
- Confirms if a deadlock exists (not all hangs are deadlocks).
- Identifies the exact threads and locks involved.
- Shows the full cycle so you know which lock acquisition order to fix.
You can:
- Hover over nodes to highlight related connections.
- Click View Stack Trace on any thread to see where it acquired its lock and where it is waiting for the next one.
Note: When you click View Complete Stack Trace, you will be taken to the Thread Dump Analysis tab, where you can further analyze the deadlock and affected threads by applying the desired filters.
Exception threads
Errors that can be handled in multi-threaded applications are called exceptions, enabling the application to keep running instead of crashing. The Exceptions tab displays the top exception threads and the methods used in each thread.
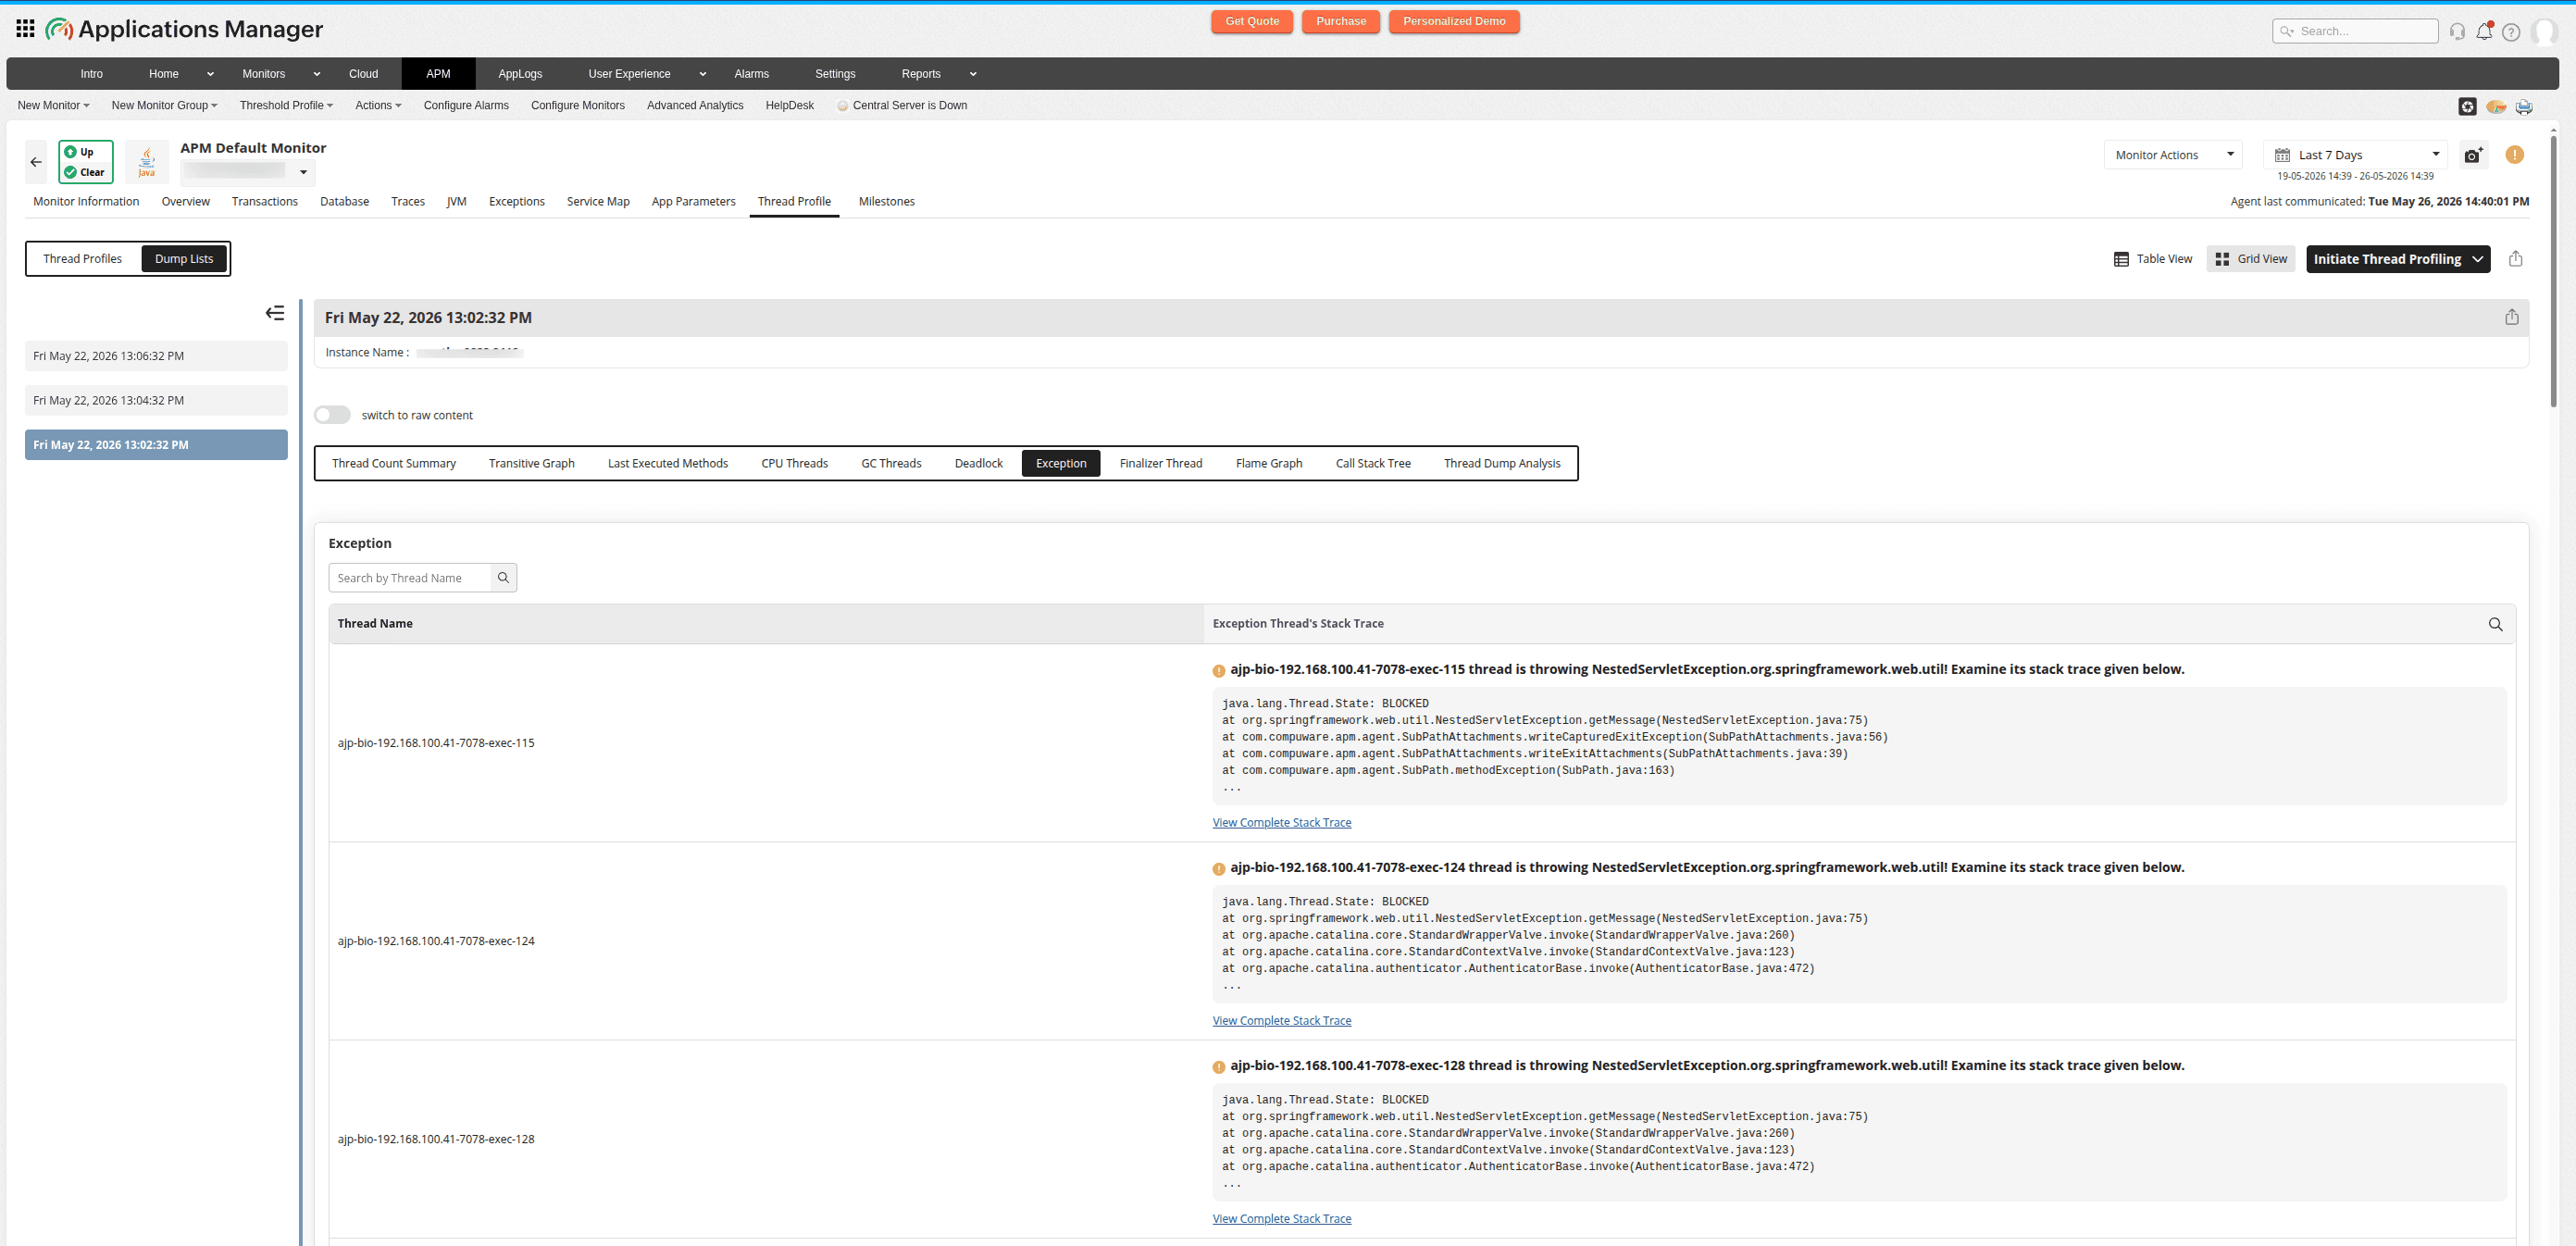
| Column | Description |
|---|---|
| Thread Name | Searchable thread identifier. |
| Exception Stack Trace | Click to view the full exception context. |
Threads with exceptions in their stack may be:
- In an error-handling code path (caught exceptions).
- Actively throwing (uncaught exceptions about to terminate the thread).
- Stuck in a retry loop after an exception.
This tab separates exception-bearing threads from normal ones so you can focus on error states. You can search by thread name or click View Stack Trace to see the full stack including the exception class and message.
Note:
- You can search for specific threads by name using the Filter box.
- When you click View Complete Stack Trace, you will be taken to the Thread Dump Analysis tab, where you can further analyze the threads involved in detail.
Finalizer thread
The finalizer thread in the JVM is responsible for executing the finalize() method of objects that are nearing garbage collection, allowing them to perform cleanup operations before being destroyed. The Finalizer Thread tab shows a transitive graph indicating which threads are causing a blockage for the finalizer thread. It assists in releasing these threads to prevent memory problems in your application.
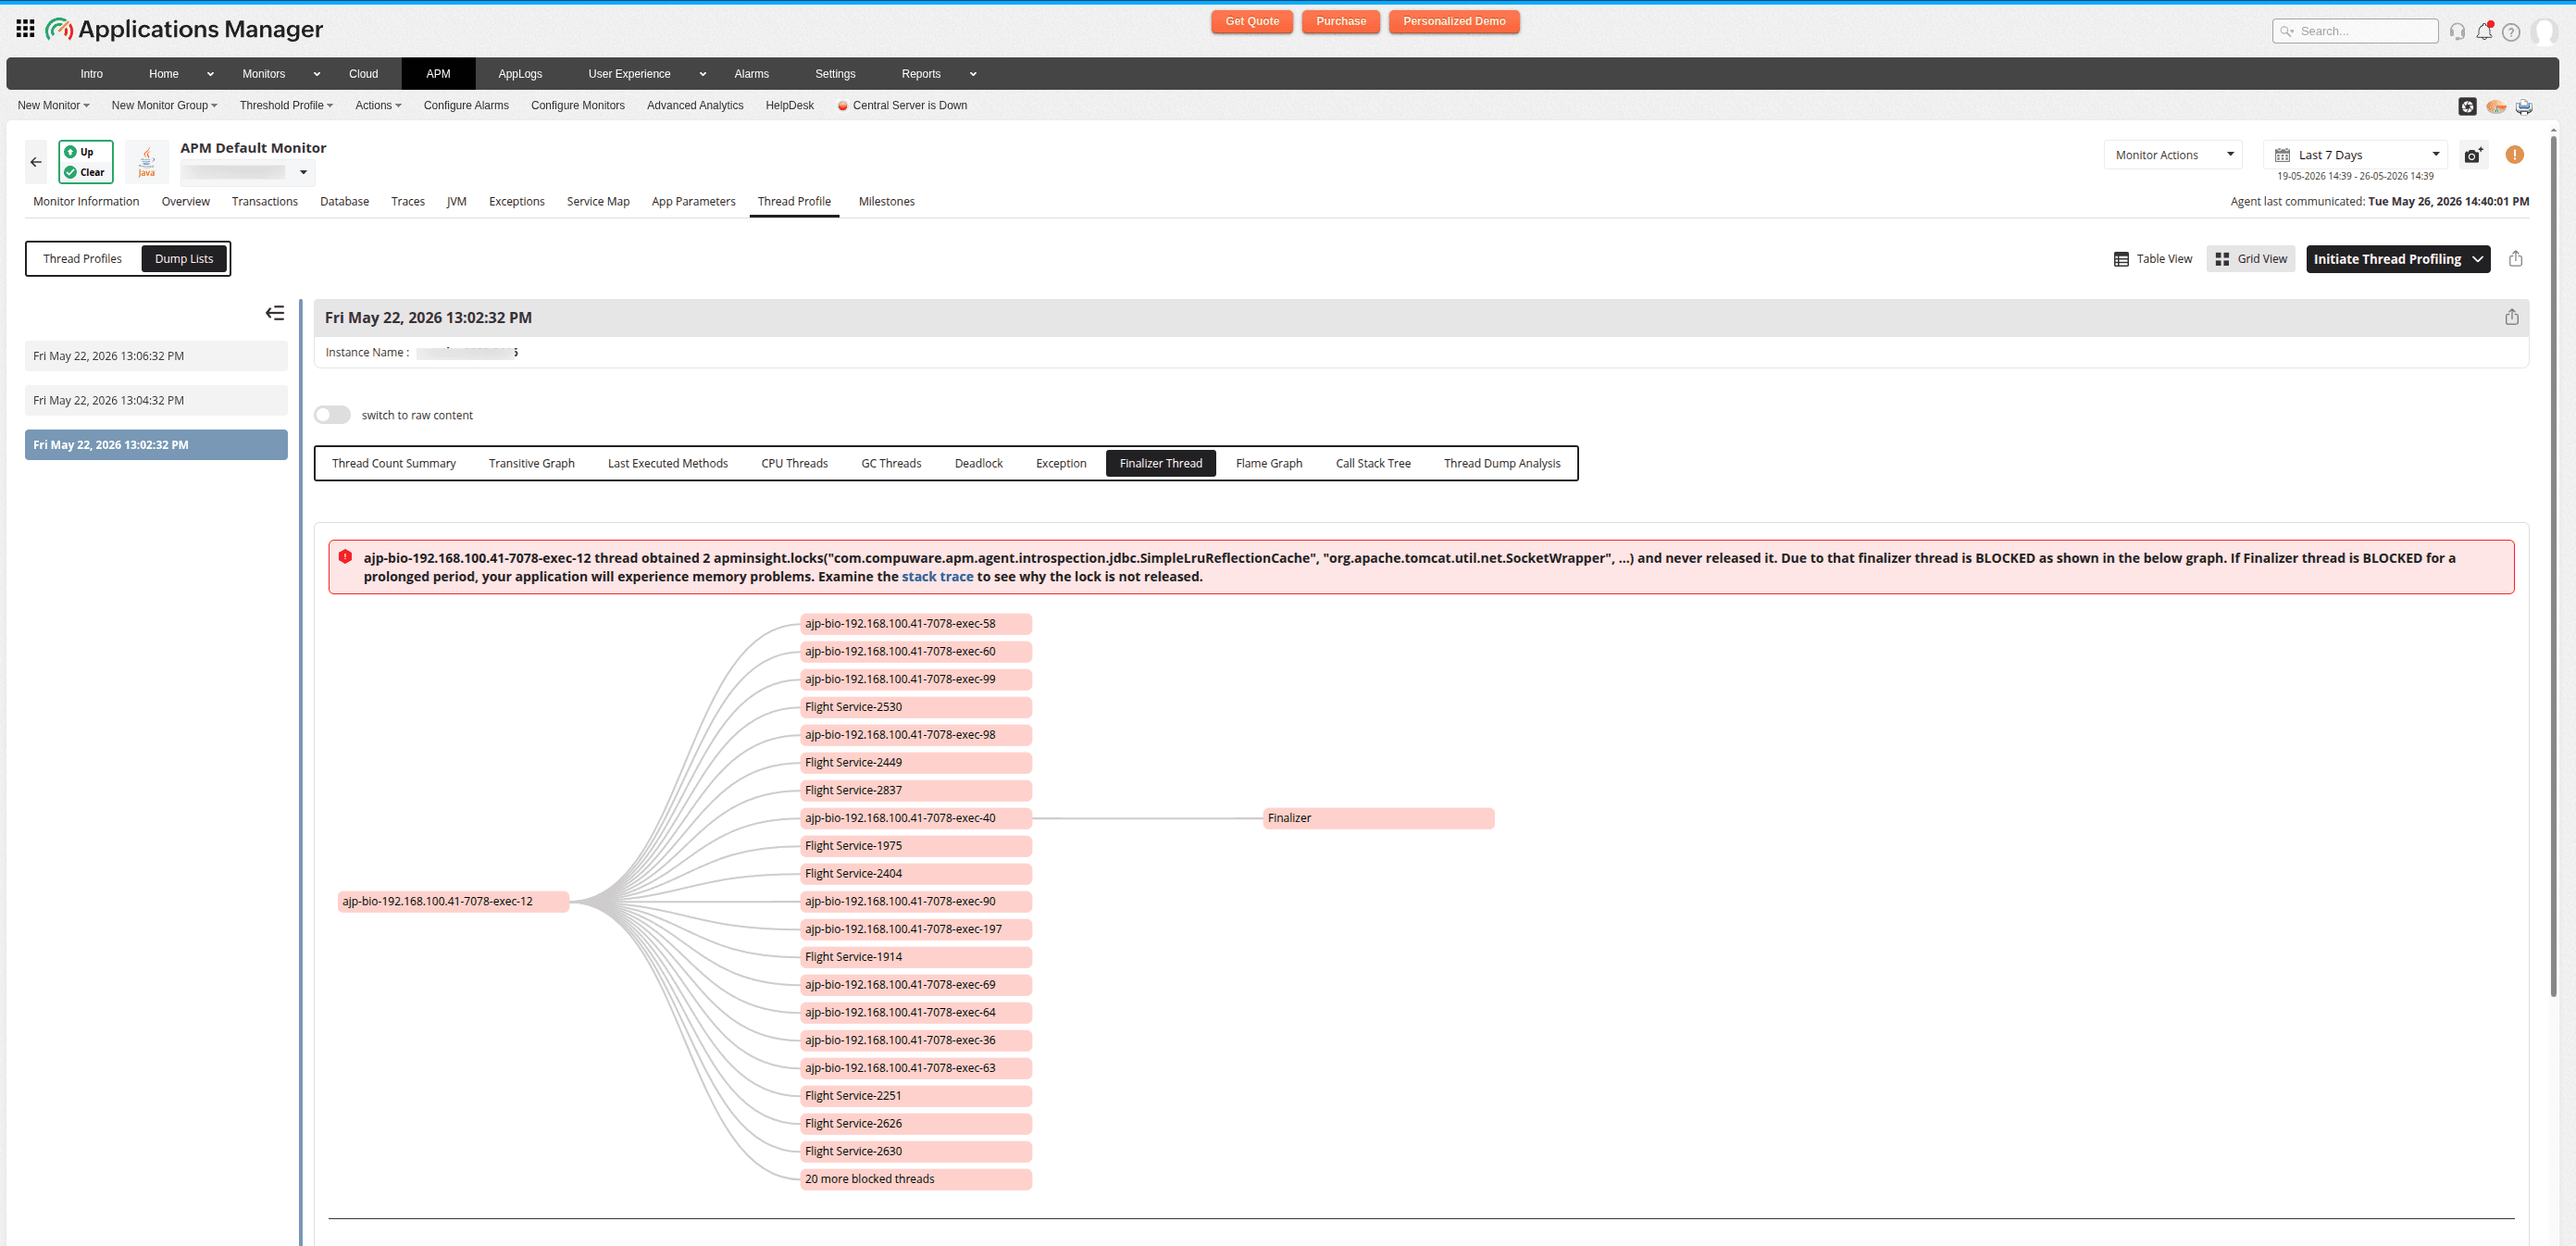
Each entry displays:
- Title message - Thread info with lock details and queue size.
- Tree nodes - Objects awaiting finalization and their dependency chains.
- Severity icons - Warning (yellow) or Danger (red) based on queue depth.
The JVM finalizer thread processes objects with finalize() methods. If it is blocked or overloaded:
- Memory leaks - Objects with finalizers cannot be garbage collected until finalized.
- Resource exhaustion - File handles, sockets, and database connections in the finalizer queue will not close.
- OutOfMemoryError risk - The finalization queue grows unbounded.
Note:
- Clicking the required thread name will show the respective stack trace.
- The information card above the graph contains troubleshooting tips.
Flame graph
The Flame Graph illustrates the distribution of time spent in various functions or code segments, with each horizontal bar representing a function or code segment and its width indicating the thread count (number of threads that have called this method in their stack trace). This visualization helps in identifying areas that need improvement, optimization, and for pinpointing bottlenecks in complex systems.
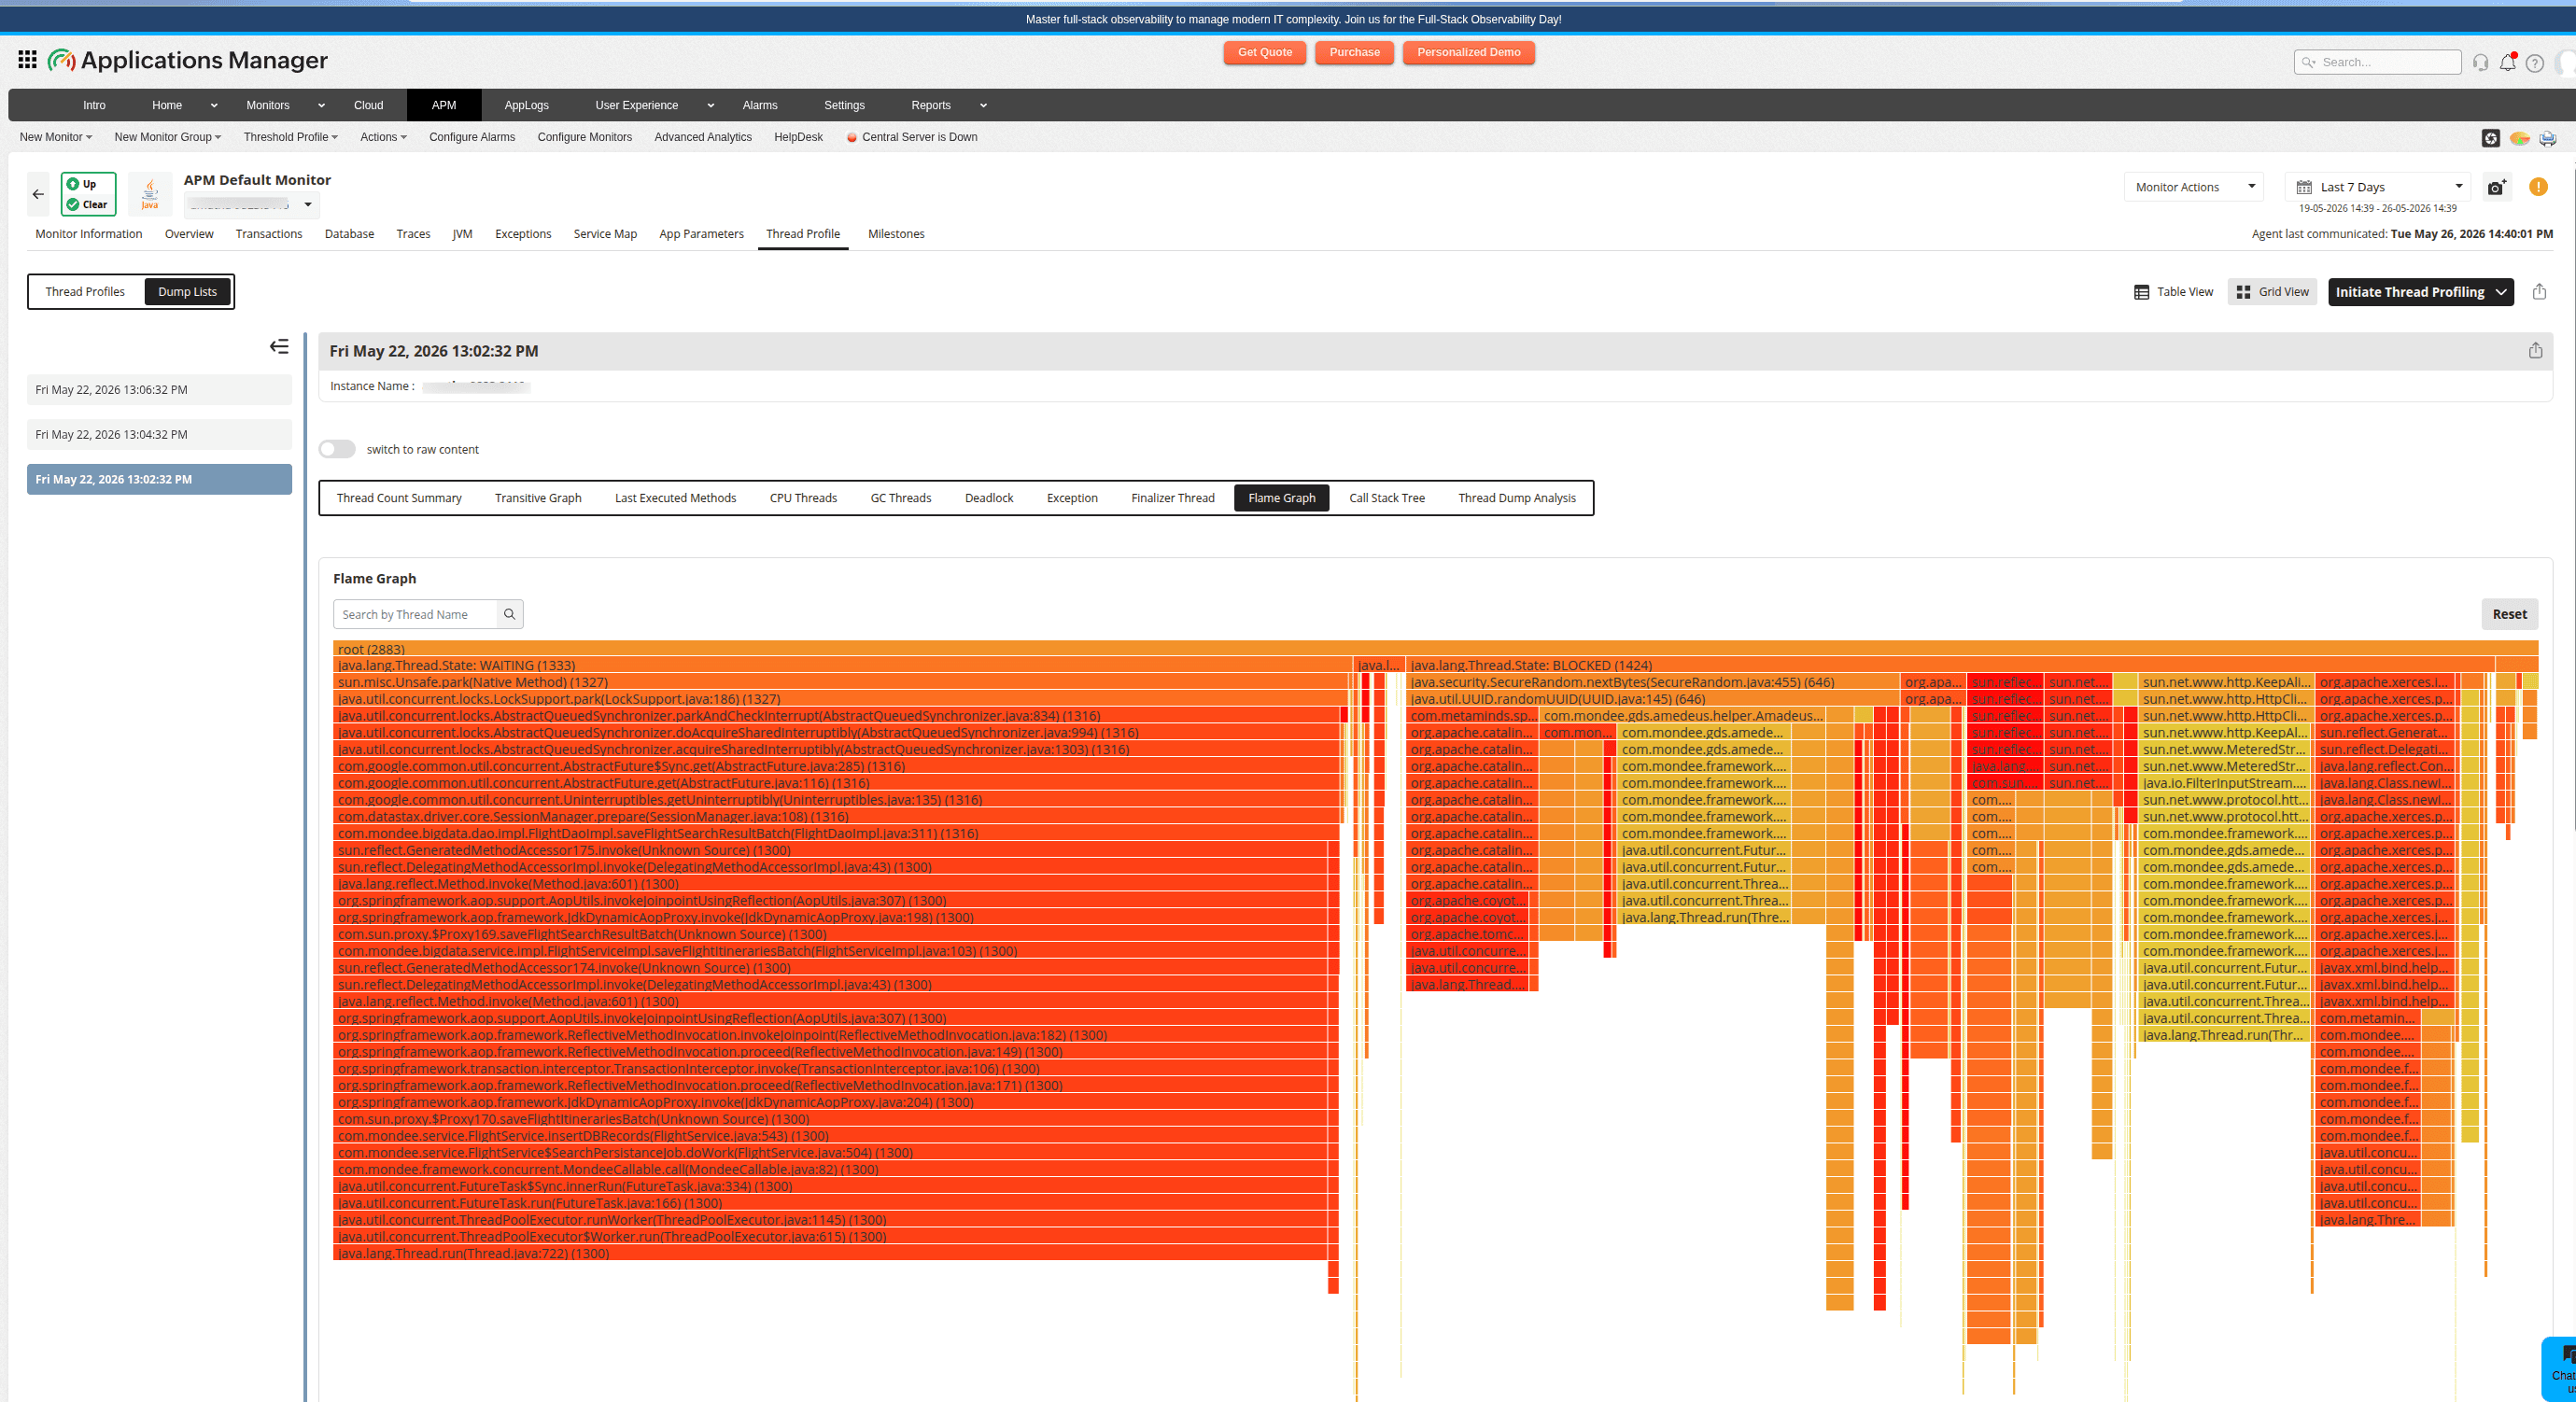
| Element | Description |
|---|---|
| X-axis | Time/sample proportion. Wider rectangles mean more threads at that method. |
| Y-axis | Call stack depth. The bottom is the entry point and the top is the leaf method. |
The flame graph is the fastest way to identify performance bottlenecks. At a glance:
- Wide plateaus at the top - Methods where threads spend the most time (optimization targets).
- Narrow spikes - Rarely-hit code paths.
- Deep stacks - Complex call chains that may be simplifiable.
You can interact with the flame graph as follows:
| Action | Effect |
|---|---|
| Click a rectangle | Zoom in. That method becomes the new root and its children fill the width. |
| Breadcrumb navigation | Shows zoom path. Click any breadcrumb to zoom back. |
| Search | Type a keyword. Matching methods turn magenta and non-matching methods fade. |
| Reset | Returns to full view and clears search highlights. |
| Hover | Shows tooltip with method name and sample count. |
Call stack tree
The Call Stack Tree is used to visualize the performance of a multi-threaded application. It provides a hierarchical representation of its functions, illustrating the flow of control between functions and how they are nested. It allows developers to understand program structure, debug code, identify recursion, analyze dependencies, and trace execution paths.
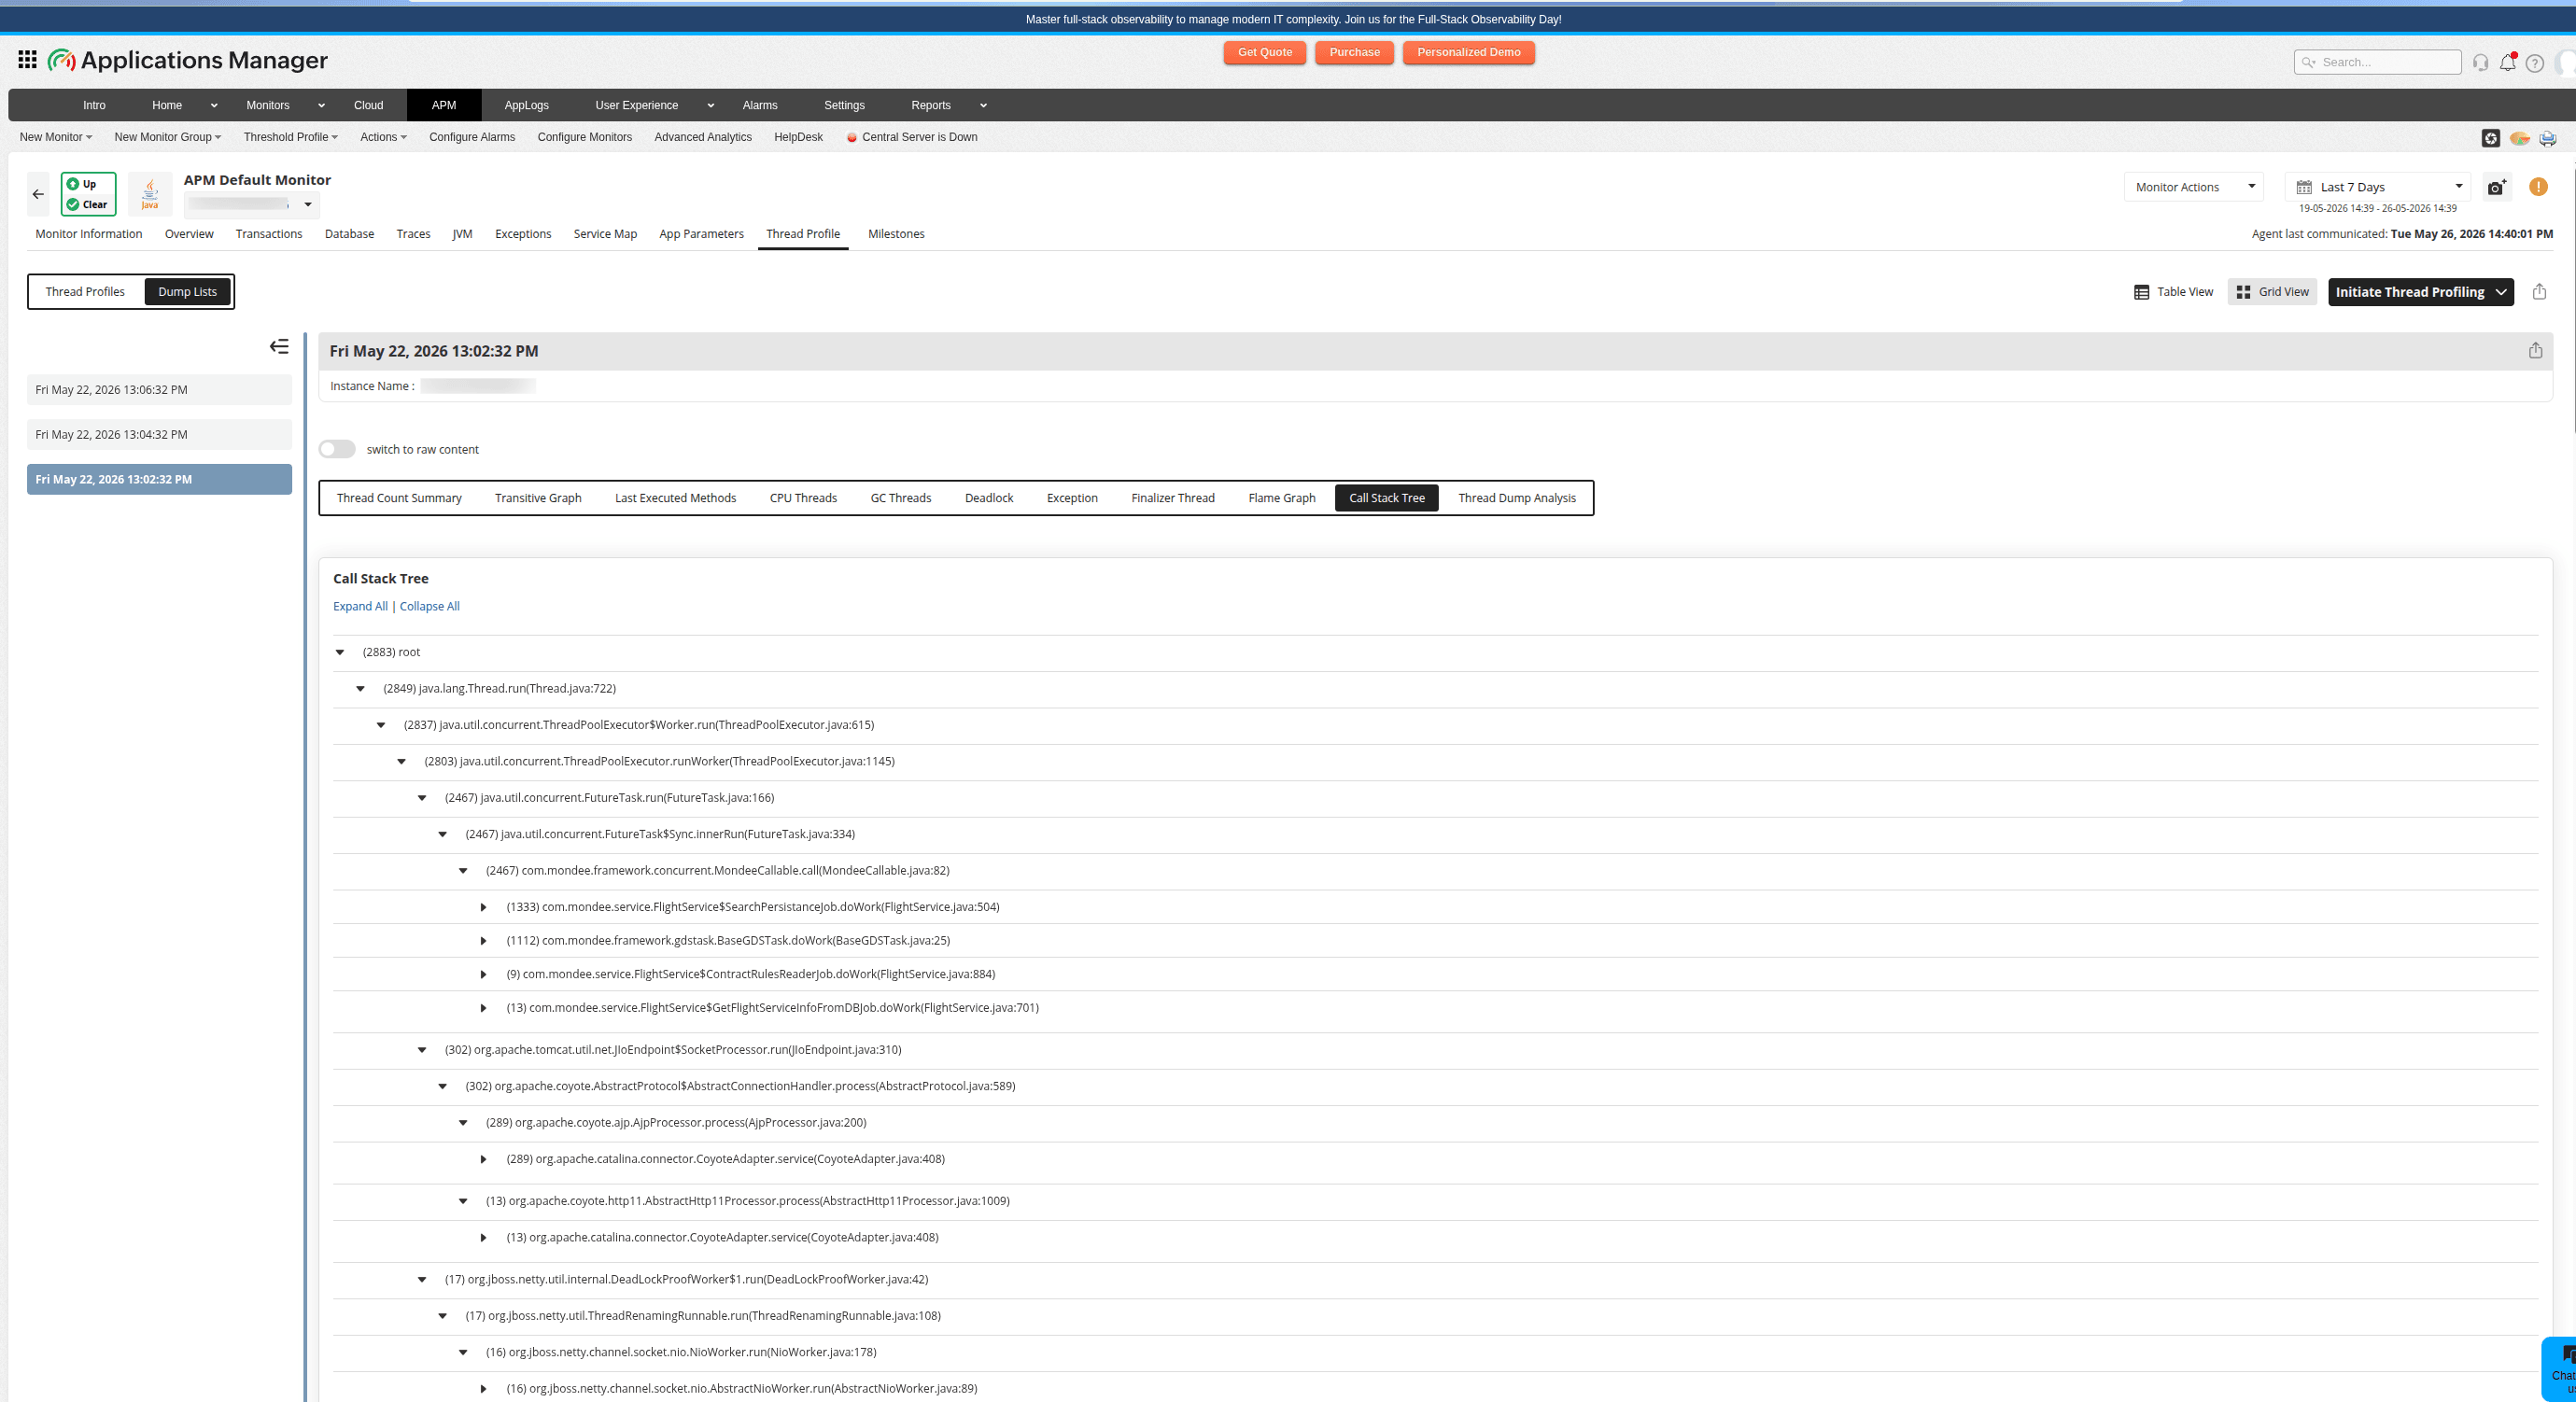
Each node in the tree follows the format: (count) fully.qualified.ClassName.methodName()
You can:
- Click Expand All to open every node in the tree.
- Click Collapse All to collapse to the root only.
- Click the +/- icons to toggle individual nodes.
- Hover over a node to see the full method signature in a tooltip.
The tree auto-expands six levels deep by default, showing the most common call paths. Nodes with the highest thread counts represent the dominant execution paths in your application.
Thread dump analysis detail panel
The Thread Dump Analysis tab provides the complete list of threads in the selected thread dump. The Add Filters option in this tab allows you to add multiple search conditions for thread dump analysis.
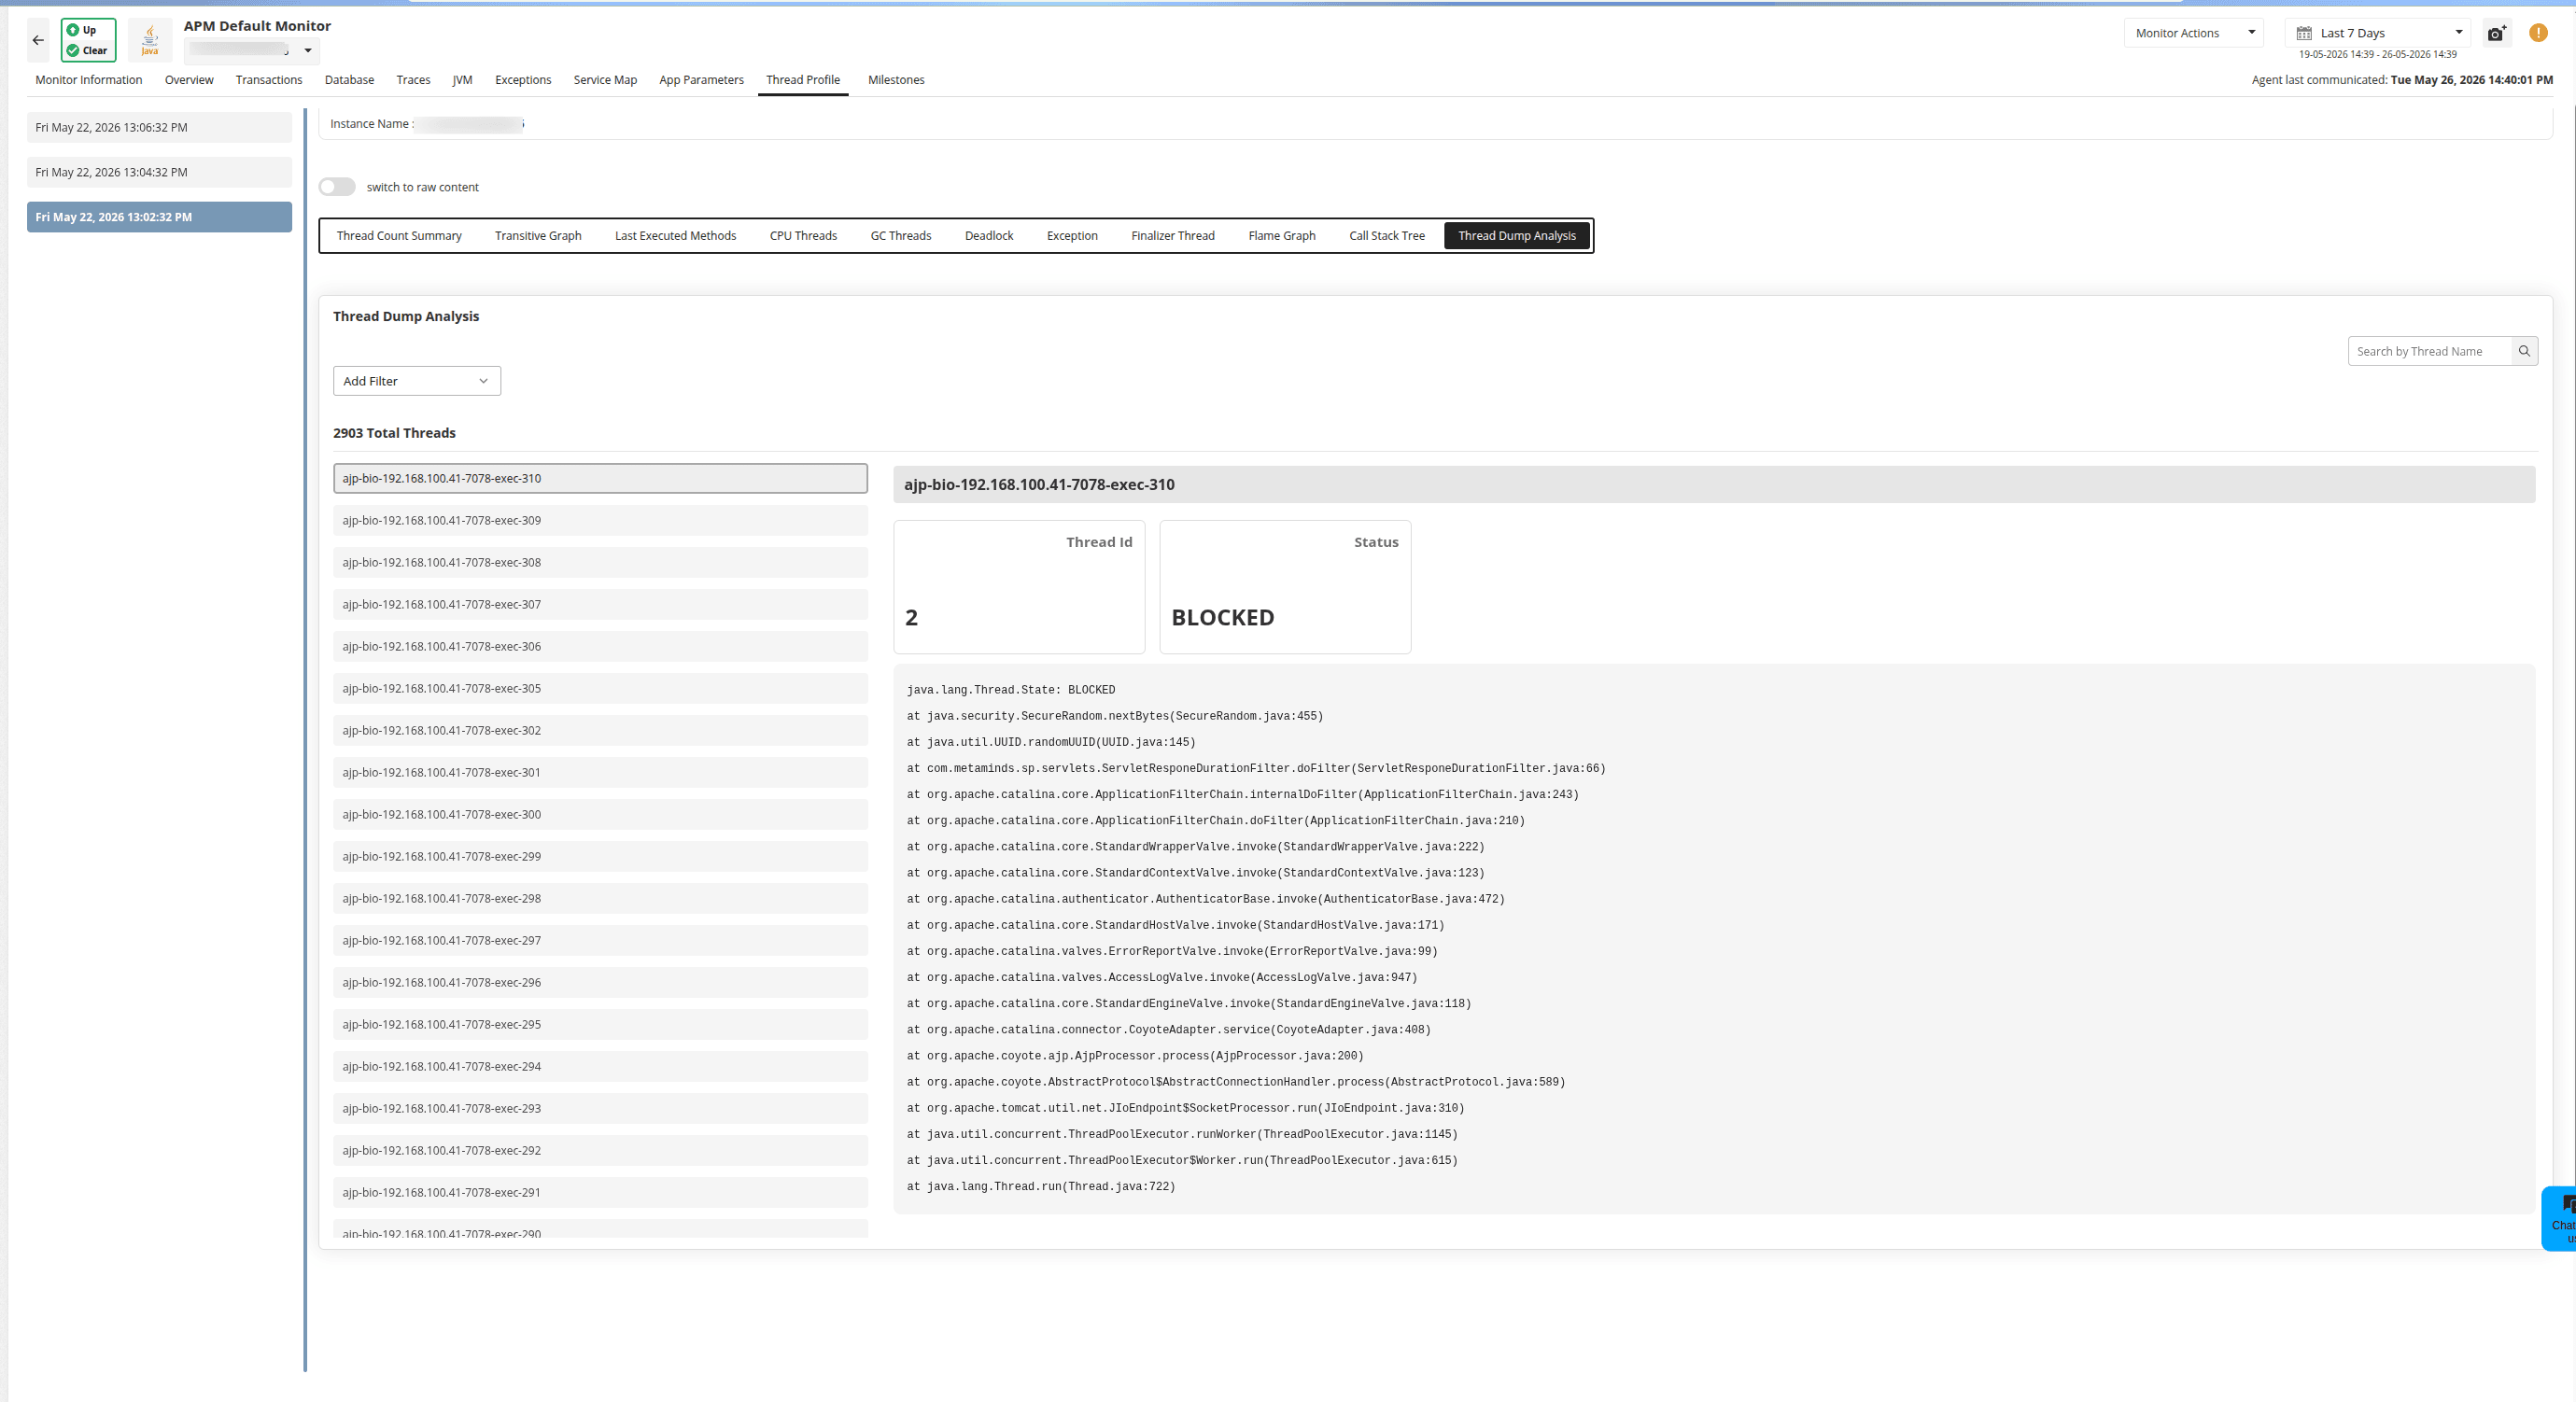
Note: You can close this tab when the analysis is finished.
Thread detail
The right pane shows the selected thread detail, including the full stack trace in monospace format and thread metadata (ID, name, state, priority).
You can:
- Search the thread list by name.
- Apply one or more filters (AND logic between groups, OR within a group).
- View active filters as breadcrumb tags with an option to remove them.
- Click any thread to see its full stack trace.
Recommended analysis workflow
Follow this workflow to perform an end-to-end thread dump analysis:
- Start with the Thread Count Summary tab to get the big picture of thread states, groups, and patterns.
- If the BLOCKED count is high, navigate to the Deadlocks tab to confirm or deny a deadlock, then use the Transitive Graph tab to see blocking chains.
- If CPU usage is high, check the CPU Threads tab to identify which threads are burning CPU, then use the Flame Graph tab to pinpoint the code location.
- If there are many WAITING threads, use the Last Executed Methods tab to find what they are waiting on, then filter further in the Thread Dump Analysis detail panel.
- For GC-related issues, check the GC Threads tab for GC overhead and the Finalizer Thread tab for finalization backlog.
- For error states, use the Exception Threads tab to surface threads with exceptions.
At any point, you can click a thread to open the Thread Dump Analysis detail panel for full stack trace details, use the Flame Graph or Call Stack Tree for a visual overview, or download the raw thread dump output.
