A query that usually takes milliseconds, suddenly takes seconds or even minutes. The application slows down, requests begin timing out, and users start reporting that pages or transactions are unresponsive. But what makes an SQL query slow in the first place?
From missing indexes and inefficient joins to stale statistics, full table scans, and poorly chosen execution plans, several database-level issues can turn an otherwise simple query into a performance bottleneck.
This article walks you through why SQL queries become slow, how they affect your business, how Applications Manager can help identify the problem faster, and how you can troubleshoot slow queries manually.
TL;DR: Short on time? Watch this 2-minute video to understand why SQL queries slow down and how to troubleshoot them.

What is a slow query?
A slow query is an SQL statement that takes significantly longer than expected to execute or return its results. There is no universal definition of a "slow" query. A query taking 500 milliseconds may be unacceptable for a high-volume user transaction but perfectly reasonable for a complex reporting workload. The important question is: Is the query taking longer than it normally should for its workload?
For example, an application may normally retrieve customer information in 100 ms. If the same query starts taking 5 seconds, the query has become a performance concern even though the database itself may still be available.
Common symptoms
- Application pages take longer to load
- Transactions take several seconds to complete
- API response times increase
- Database CPU or I/O usage rises
- Queries begin timing out
- Users experience intermittent application slowness
- Background jobs take longer to complete
When a query suddenly becomes slow, make sure to ask the following questions to understand what's changed:
- Did the amount of data increase?
- Did the query or application code change?
- Did database statistics or indexes change?
- Are other queries consuming database resources?
This usually happens because, either the query, execution plan, data distribution, indexes, or competing workload may have changed.
Why do slow queries happen?
Slow SQL queries usually result from a combination of query design, database structure, data volume, and resource contention. Some of which are as follows:
1. Missing or ineffective indexes
Indexes help the database locate relevant rows without scanning an entire table. When an appropriate index is missing, the database may need to examine a large portion of the table to find the required records.
For example:
SELECT *
FROM orders
WHERE customer_id = 10245;
If customer_id is frequently used for filtering but does not have a suitable index, the database may have to scan a large number of rows. However, adding indexes indiscriminately is not a solution. Indexes also consume storage and can increase the cost of INSERT, UPDATE, and DELETE operations.
What to check:
Look at the execution plan and determine whether the database is performing a table or index scan where a more efficient access path could be used.
2. Inefficient joins
Queries that join multiple large tables can become expensive when the join conditions are poorly designed or the participating columns are not appropriately indexed. For example:
SELECT c.name, o.order_id
FROM customers c
JOIN orders o
ON c.id = o.customer_id
WHERE c.region = 'South';
As the number of customers and orders grows, inefficient joins can consume substantial CPU, memory, and I/O resources.
What to check:
Look into the execution plan and examine how tables are joined, how many rows are processed, and whether indexes are being used effectively.
3. Full table scans
A table scan occurs when the database reads a large portion or all of a table to find the required rows. For a small table, scanning the entire table may actually be more efficient than using an index. The problem usually occurs when a large table is repeatedly scanned for a query that could have used a more efficient access path.
What to check:
Use the execution plan to determine how much data is being read and whether the scan is appropriate for the query.
4. Stale statistics
Database optimizers use statistics about data distribution to estimate how many rows a query will return. When those statistics become outdated, the optimizer makes poor decisions on how to execute the query. For example, it may select an inefficient join strategy or access path because it incorrectly estimates the number of matching rows.
What to check:
Determine when statistics were last updated and whether significant data changes have occurred since then.
5. Poor execution plans
The SQL statement itself may look reasonable while the database chooses an inefficient execution plan. An execution plan describes how the database intends to retrieve and process the requested data. A poor plan can result in:
- Excessive table or index scans
- Inefficient joins
- High CPU consumption
- Excessive I/O
- Large intermediate result sets
- Increased query execution time
The same query can also behave differently as data volume, statistics, indexes, or database conditions change. On SQL Server, parameter sniffing can also contribute to this behavior. The optimizer may generate and cache a plan based on the parameter values used when the query first executes. If those values are not representative of later executions, the cached plan may be inefficient for other parameter values, causing a query that previously ran quickly to take significantly longer.
What to check:
Compare the current execution plan with a previously known good plan when available. If query performance varies significantly for different parameter values, check whether parameter sniffing may be contributing to the problem, along with statistics, indexes, and data distribution.
6. Large or rapidly growing datasets
A query that worked well when a table contained 100,000 rows may behave very differently when that table grows to hundreds of millions of rows. Data growth does not automatically make a well-optimized query slow. However, as tables grow, inefficient access patterns that were less noticeable on smaller datasets can become significant performance problems. In other words, growth often exposes a query that was scanning or processing more data than necessary all along.
For example, a query that relies on scanning a large portion of a table, sorting a large result set, or processing more rows than necessary may take considerably longer as the dataset grows. Growth can also increase memory and I/O demands when more data needs to be read or processed
What to check:
Compare query performance with data-volume trends and review the execution plan to see whether the query is scanning or processing more rows than necessary. Check whether joins, sorting, aggregation, and filtering are becoming more expensive as the dataset grows and verify that existing indexes remain effective.
7. Resource contention
Apart from the SQL statement itself, other queries, backups, maintenance jobs, locks, and resource-intensive operations may compete for CPU, memory, I/O, or database connections. This can make an otherwise efficient query appear slow.
Applications Manager's SQL monitoring capabilities can correlate query performance with metrics such as CPU, memory, waits, locks, sessions, and other database activity to help narrow down the bottleneck. Also, not every slow query needs to be optimized. A well-optimized query can still be delayed by a lock, disk I/O, memory pressure, CPU contention, or another competing workload.
What is the business impact of slow queries?
A slow query rarely stays confined to the database. When an application depends on that query, the delay propagates through the application stack.
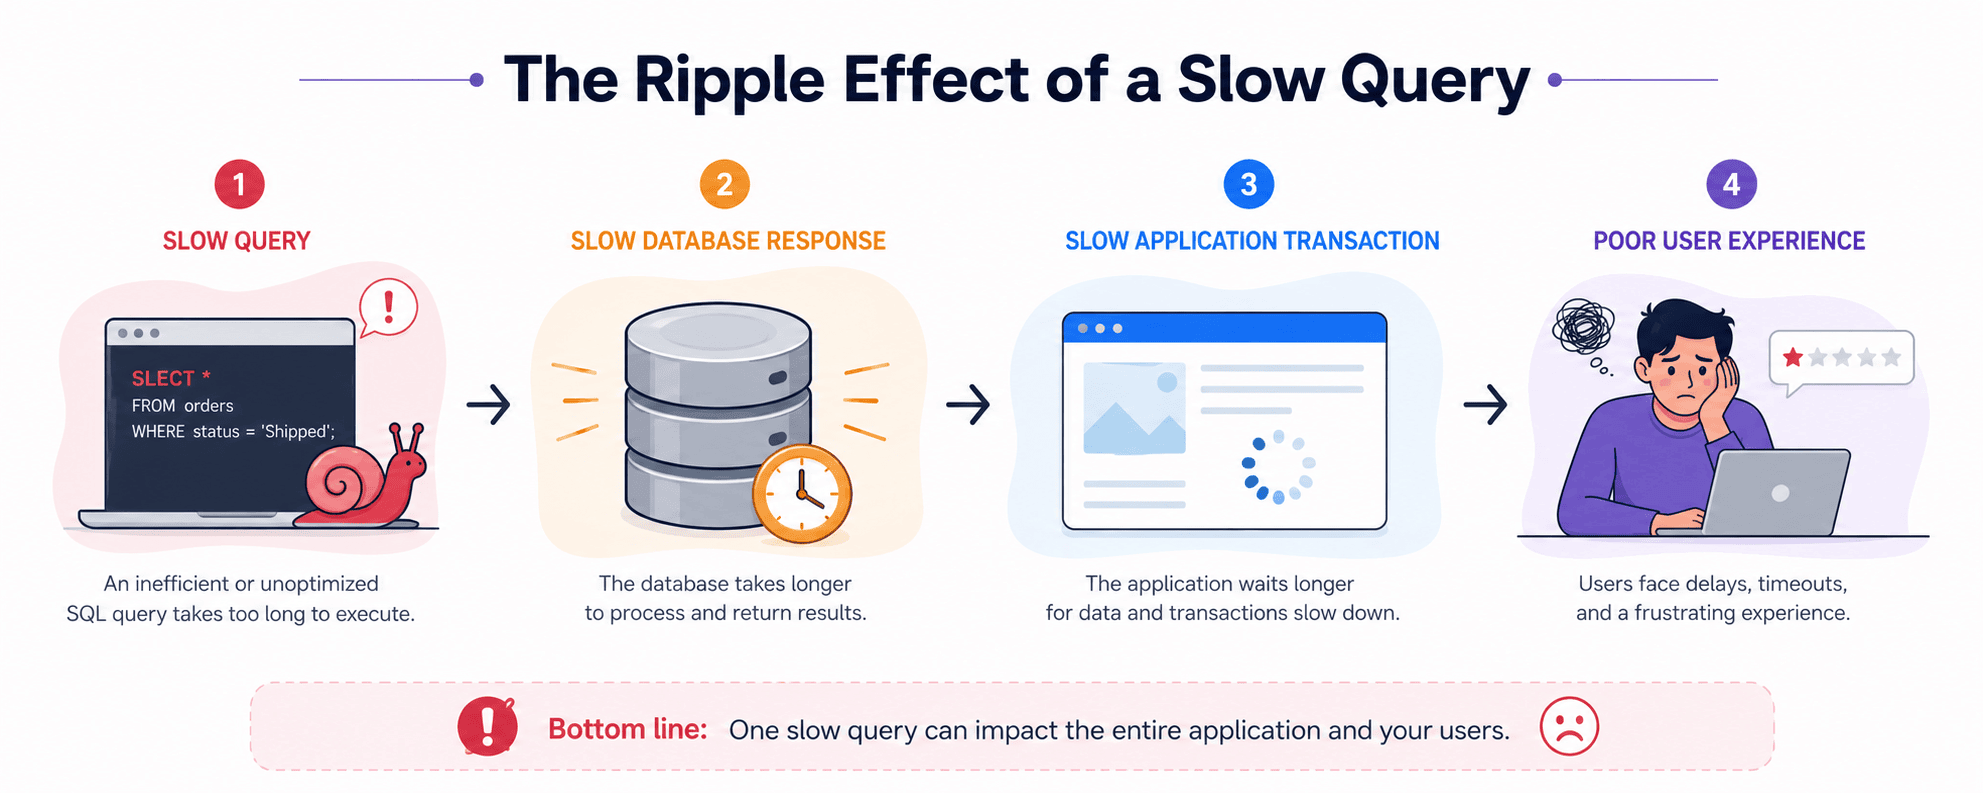
For customer-facing applications, this can mean:
Longer page-load times: Users wait longer for pages, searches, dashboards, or reports to load.
Transaction timeouts: Queries that exceed application or database timeout thresholds can cause failed transactions.
Interrupted business operations: Slow database operations can delay order processing, payments, customer service workflows, reporting, and other critical processes.
Poor customer experience: Repeated delays can frustrate users and affect their perception of application reliability.
Higher operational effort: DBAs and developers may spend hours trying to determine whether the problem originates in the query, database, infrastructure, or application.
In high-volume environments, even a small increase in query latency can become significant when the query executes thousands or millions of times.
Can Applications Manager help?
Yes! ManageEngine Applications Manager can help identify slow SQL queries, check their execution behavior, analyze database performance, and correlate query problems with broader database conditions. Its database monitoring capabilities also provides visibility into query performance, database resources, locks, sessions, indexes, and other performance indicators.
Start by finding which queries are taking the longest. Applications Manager helps you identify slow running SQL statements and query performance issues so that you can focus on the queries that needs your attention the most.
For SQL Server environments, Applications Manager provides deeper SQL performance monitoring, including slow and frequently executed queries, wait information, query-plan usage, resource utilization, and index-related insights.
How Applications Manager helps troubleshoot slow queries
Instead of waiting for users to report that an application is slow, you can use query and database performance data to detect abnormal behavior, understand what is causing the slowdown, and respond before it becomes a larger application issue.
Want to see how Applications Manager helps troubleshoot slow SQL queries? Select Get Started below to explore the interactive demo.
1. Identify slow SQL statements
Start by identifying which queries are taking the longest to execute. Applications Manager provides visibility into slow-running SQL statements and query performance, helping you focus troubleshooting efforts on the queries that matter most.
For selected queries, Database Query Monitor can track query execution time and errors at configured polling intervals. This helps you identify queries that are consistently taking longer than expected rather than relying on a single slow execution.
2. Find the top-performing offenders
Not every slow query deserves the same attention. A query that runs once a day for a reporting task may have less impact than a query that executes thousands of times per minute.
Use Top SQL/query performance views to prioritize queries based on their execution behavior and resource impact, particularly in supported SQL monitoring environments.
3. Set thresholds to detect abnormal behavior
Monitoring query performance is more productive when you can identify normal variances and define conditions that require attention. Applications Manager has threshold and performance anomaly profiles that are customizable according to the metrics you choose to monitor. If a threshold is breached, an alert notifies you of a potential performance issue, so you can address the problem without having to constantly watch the console.
For example, you can set acceptable performance limits for the selected monitored metrics and receive threshold breach alerts to know when the performance has moved beyond the set limits. This approach helps teams detect performance degradation earlier, giving them an opportunity to investigate before the issue has a wider impact.
4. Analyze query behavior
Once a problematic query is identified, investigate how it behaves. Look into metrics such as:
- Execution time
- CPU consumption
- I/O activity
- Wait time
- Query frequency
- Resource utilization
- Related database activity
Applications Manager's SQL monitoring capabilities provide visibility into these performance indicators so teams can correlate query behavior with database conditions.
5. Automate responses to alerts
Apart from just detecting a performance problem, Applications Manager also allows alerts to be associated with notification and automated actions, helping teams define an appropriate response when a monitored condition occurs.
This can reduce manual intervention when a predefined response is appropriate. The available action depends on the monitor and the action configured for the environment.
Automated actions can help teams respond quickly to known conditions, but they should be used carefully. For slow queries, the appropriate response may be investigation or remediation of the underlying issue, such as updating statistics, reviewing an execution plan, or adding an appropriate index, rather than simply terminating the query.
6. Compare historical performance
A query need not necessarily be problematic because it is slow once. The more useful question is,'Has this query become slower than it normally is?'
Historical reports and performance trends help establish context around query behavior and identify recurring or gradual performance degradation. Applications Manager provides reports that allow database and application performance to be analyzed over longer periods.
For example:
Week 1: 120 ms average
Week 4: 180 ms average
Week 8: 950 ms average
That trend tells you much more than a single 950 ms measurement.
7. Correlate the query with the underlying database problem
A slow query can be a symptom rather than the root cause. Applications Manager can provide broader database visibility to help determine whether the slowdown is associated with factors such as:
- High CPU utilization
- Memory pressure
- Locks and blocking
- Wait conditions
- Index problems
- Database connectivity
- Competing workloads
This broader context can reduce the time spent switching between different monitoring tools while investigating the issue.
8. Trace application-level database delays
When the problem appears to users as a slow application transaction, application performance monitoring can provide another layer of visibility. APM Insight can identify slow transactions and drill down into database queries and other calls contributing to transaction latency.
This helps determine whether the database query is responsible for the slow transaction or whether another component in the application stack is contributing to the delay.
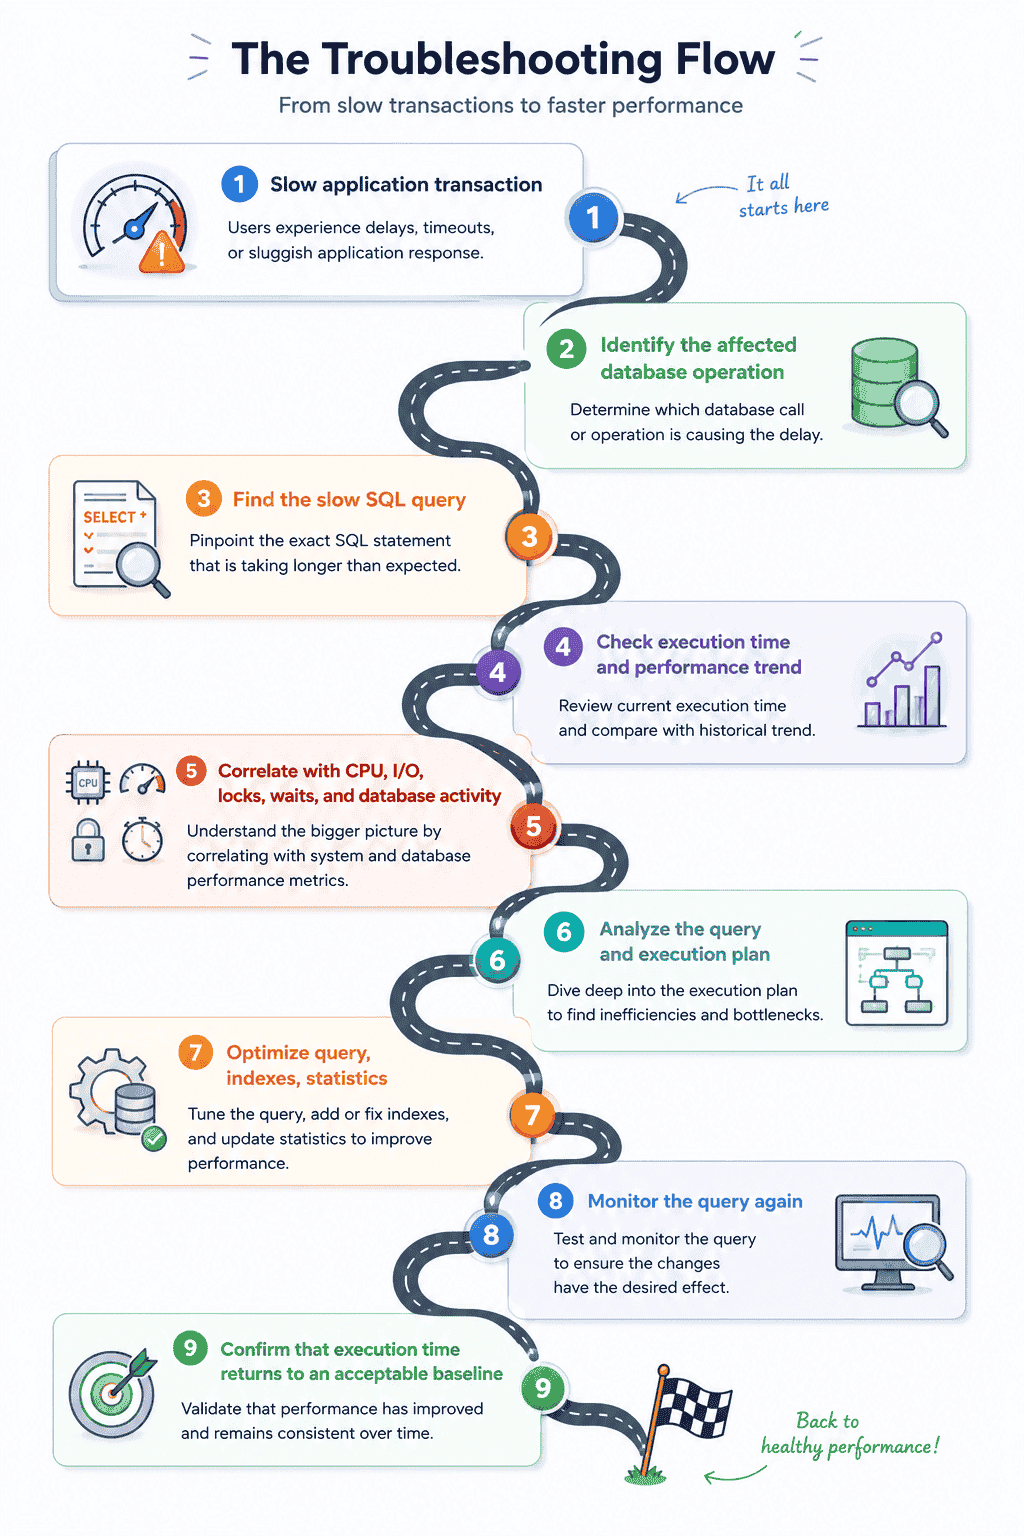
How to resolve slow queries without Applications Manager
You don't necessarily need a monitoring product to troubleshoot a slow query. If you already have access to your database's native diagnostic tools, you can investigate the problem manually.
Step 1: Identify the slow query
Start by finding the SQL statement responsible for the slowdown. Depending on your database, use native tools such as:
- Slow query logs
- Query statistics
- Database performance views
- Active session views
- Query history
- Built-in monitoring dashboards
Make sure to record:
- SQL statement
- Execution time
- Number of executions
- CPU usage
- Logical/physical reads
- Wait time
- Rows returned
Don't optimize a query based only on its execution time. A query that takes 5 seconds once may matter less than one that takes 500 ms but runs thousands of times.
Step 2: Examine the execution plan
Run the query through your database's execution-plan tool and look for:
- Full table scans
- Expensive joins
- Large sorts
- Excessive I/O
- Poor row-count estimates
- Inefficient operators
- Missing or unused indexes
The execution plan should tell you where the database is spending most of its work.
Step 3: Check indexes
Determine whether the columns used for:
- WHERE
- JOIN
- ORDER BY
- GROUP BY
have appropriate indexing. Don't simply add an index for every column involved in the query.
Evaluate the following:
- Existing indexes
- Index selectivity
- Index size
- Write overhead
- Duplicate indexes
- Unused indexes
Then test whether the proposed index actually improves the query.
Step 4: Review the query itself
Look for opportunities to simplify the SQL and check for:
- Unnecessary joins
- Unnecessary columns in SELECT
- Missing filters
- Inefficient sub-queries
- Excessive sorting
- Functions applied to indexed columns
- Queries returning significantly more rows than necessary
For example, avoid retrieving every column when the application only needs two:
SELECT *
FROM customers
WHERE region = 'South';
Instead:
SELECT customer_id, customer_name
FROM customers
WHERE region = 'South';
The exact optimization depends on the database engine and workload, so always validate changes against the actual execution plan and application requirements.
Step 5: Check statistics
If the optimizer is making unexpected decisions, check whether database statistics are current. Large changes in which data distribution can make previously effective execution plans less appropriate. Update statistics according to your database engine's recommended maintenance practices, then compare the execution plan and query performance again.
Step 6: Check for blocking and resource contention
If the query by itself looks efficient, investigate what it is waiting for and check for:
- Blocking sessions
- Locks
- CPU pressure
- Memory pressure
- Disk I/O
- Connection saturation
- Long-running transactions
- Concurrent maintenance jobs
A query may be perfectly optimized but still experience delays because another process is holding a resource it needs.
Step 7: Test the optimization
After changing the query, index, statistics, or configuration:
- Execute the query again.
- Compare execution time.
- Compare CPU and I/O usage.
- Review the new execution plan.
- Test under representative workload.
- Monitor for regressions.
Don't judge an optimization solely by a single test execution.
Quick troubleshooting checklist
Query
☐ Is the SQL statement unnecessarily complex?
☐ Is it returning more data than required?
☐ Are the joins efficient?
Indexes
☐ Are appropriate indexes available?
☐ Are indexes actually being used?
☐ Are there redundant or excessive indexes?
Execution plan
☐ Is the database performing an expensive scan?
☐ Are row estimates significantly different from actual results?
☐ Are there expensive joins, sorts, or other operations?
Statistics
☐ Are statistics current?
☐ Has the data distribution changed significantly?
Resources
☐ Is CPU usage unusually high?
☐ Is there I/O or memory pressure?
☐ Are locks or blocking delaying execution?
☐ Are other workloads competing for resources?
After the fix
☐ Did execution time improve?
☐ Did resource consumption decrease?
☐ Does the improvement hold under normal workload?
☐ Has the query returned to its normal performance baseline?
Get to the roots of your slow query
A slow SQL query is often only the visible symptom of a deeper database or application performance problem. Manual troubleshooting can help diagnose individual incidents, but continuous monitoring provides the visibility needed to detect performance degradation, identify recurring issues, and respond to threshold violations earlier. With Applications Manager, you can monitor query and database performance, correlate slowdowns with underlying conditions, and gain the context needed to get to the root of the problem.