Dashboard
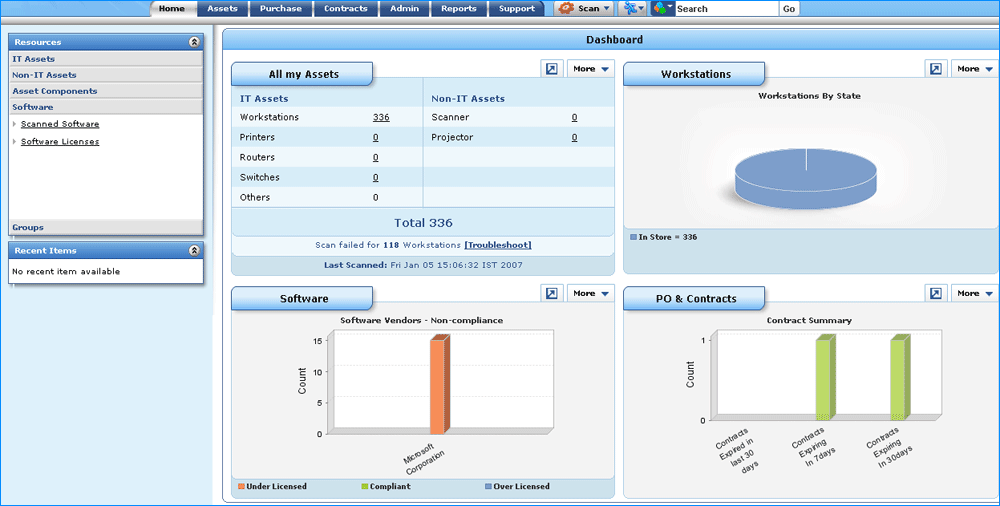
The dashboard of AssetExplorer login home page displays the following,
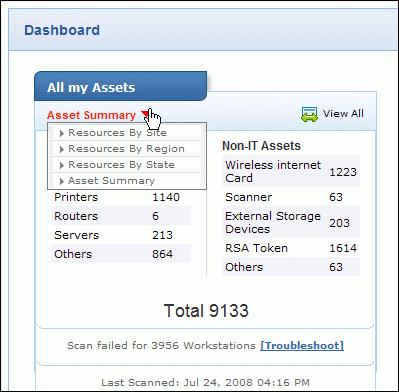
On scanning all the IT & Non-IT assets in the organization, all the assets gets listed below in All my Assets.
You can view the graph of resources by Site, Region, State or Asset Summary.
Click View All link to view the graph enlarged.
The Asset Summary displays each product type count across organization (Workstation, scanner etc.).
It also displays number of failed workstations on scanning at the bottom of the section. Click the Troubleshoot link for troubleshooting tips.

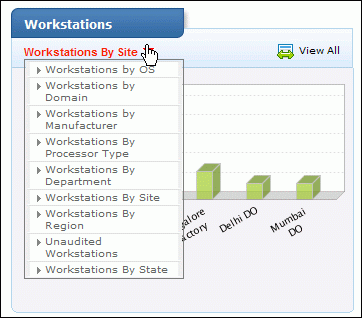
On performing a scan, the Workstations shows the graph of Workstations by OS, Domain, Manufacturer, Processor Type, Department, Site, Region, State and so on.
Click View All link to view the graph enlarged.

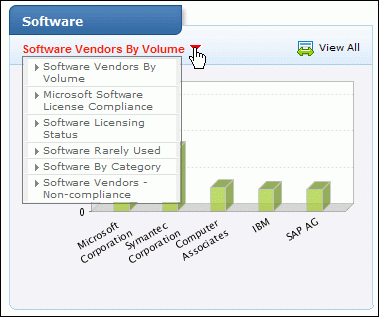
On performing a scan, the Software shows the graph of Software by category, Software licensing status, Software license Compliance, Software Vendors Volume etc.
Click View All link to view the graph enlarged.

PO & Contracts shows the graph of contract summary and purchase order summary.
Contracts summary shows the graph for contracts expiring in next 7days, 30 days, also contracts expired in last 30 days.
Purchase Order summary shows the graph for purchase due today, next 7 days & next 30 days.
Click View All link to view the graph enlarged.

